 Open Access Article
Formation of typical disinfection by-products (DBPs) during chlorination and chloramination of polymyxin B sulfate†
Xingya Wei *a,
Bangjun Hana,
Renzheng Gua,
Weimin Genga and
Naiyun Gaob
aSchool of Municipal and Ecological Engineering, Shanghai Urban Construction Vocational College, Shanghai 200438, China. E-mail: weixingya369@163.com
bCollege of Environmental Science and Engineering, Tongji University, Shanghai 200092, China
First published on 18th July 2023
Abstract
Disinfection by-products (DBPs) formed in chlorination and chloramination are proved to be cytotoxic and genotoxic and arouse increasing attention. However, previous studies of DBP precursors mainly focused on free amino acids (AAs) and few papers evaluated DBPs' formation potential of combined AAs. This study demonstrated that typical carbonaceous (C-) DBPs, trihalomethanes (THMs) and typical nitrogenous (N-) DBPs, dichloroacetonitrile (DCAN), trichloroacetonitrile (TCAN) and trichloronitromethane (TCNM) could be formed during chlorination and chloramination of polymyxin B sulfate (PBS), a common polypeptide antibiotic working against Gram-negative bacterial infections. The effects of major parameters, including disinfectant dose, contact time, solution pH, temperature, bromide concentration and chloramination mode were evaluated in batch experiments. Different kinds of DBPs exhibited different characteristics as disinfectant dose or contact time increased. Solution pH and temperature affected the formation of DBPs greatly. The formation pathways of different DBPs from chlor(am)ination of PBS were also proposed. Combined AAs, such as PBS, were proved to be important precursors of DBPs during disinfections.
1 Introduction
Chlorination and chloramination are the two most widely used disinfection methods in water treatment, and can effectively remove many pathogens like bacteria and viruses and guarantee the biological safety of drinking water.1 However, various kinds of disinfection by-products (DBPs) have been discovered during disinfection processes since early 1970s.2 DBPs are mainly divided into two classes, the carbonaceous disinfection by-products (C-DBPs) and the nitrogenous disinfection by-products (N-DBPs), in subsequent studies.3 Trihalomethanes (THMs, including chloroform (CF), bromodichloromethane (BDCM), dibromochloromethane (DBCM), and bromoform (BF)), haloacetic acids, halogenated aldehydes and halofuranone are common C-DBPs, and N-DBPs mainly include haloacetonitriles (such as dichloroacetonitrile, DCAN and trichloroacetonitrile, TCAN), halonitromethanes (such as trichloronitromethane, TCNM), haloacetamides, cyanogen halides and nitrosamines.4 DBPs, especially N-DBPs were proved to exhibit great cytotoxicity and genotoxicity to animals and human beings, which aroused increasing attention and research.5A proven effective method to control the formation of DBPs was to remove the precursors of DBPs (DBPPs).6,7 Dissolved organic matters (DOM) were the major DBPPs. Specifically, N-DBPs were mainly formed from dissolved organic nitrogen (DON), which accounted for about 10% of the total DOM.8,9 Among DON, amino acids (AAs) are the earliest and most studied precursors of C-DBPs and N-DBPs, which reported to account for 20–75% of total DON in runoffs.10,11 AAs occurs in two forms in natural water, free AAs and combine AAs (dipeptide, polypeptide, protein). Most of previous studies focused on free AAs, which however constitute only averaging 5.9% on a molar basis of total AAs in natural water.12 Thus, it is necessary to investigate the formation of DBPs from combined AAs during disinfections.13
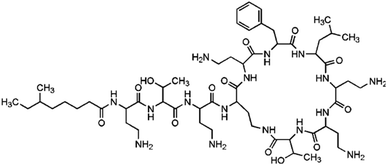
Another relevant factor is that source waters were increasingly polluted by chemical residues and discharges, and the largest amounts of chemical contaminants were pharmaceuticals and personal care products (PPCPs).14 Among PPCPs, antibiotics are a class of drugs widely used and present worldwide. Particularly, polypeptide antibiotics are thought to be high likely to form C-DBPs and N-DBPs during disinfections, due to being a type of combined AAs. As a typical polypeptide antibiotic, polymyxin B sulfate (PBS) has been detected in wastewater15 and was selected as the target contaminant in this experiment. The main characteristics of PBS are listed in Table 1.
The conventional water treatment process cannot significantly remove DBPs or DBPPs.7 Hence, deep water treatment processes, including advanced oxidation, adsorption, membrane technology, biological treatment, and combination processes such as ozonation and biologically activated carbon process, have been widely studied.16–18
To the authors' knowledge, there have been no examinations of DBPs formation potential for PBS. Based on the analysis of molecular structure of PBS, it is likely that typical C-DBPs (THMs) and N-DBPs (DCAN, TCAN and TCNM) could be formed during chlorination and chloramination of PBS,6,13 which was demonstrated by a pre-experiment. The objective of this study was to evaluate the yields of C-DBPs (THMs) and N-DBPs (DCAN, TCAN and TCNM) during chlorination and chloramination of PBS. Batch experiments were carried out to investigate the impacts of major parameters, including disinfectant dose, contact time, solution pH, temperature, bromide concentration and chloramination mode. And formation pathways of different DBPs from chlor(am)ination of PBS were also proposed.
2 Experimental
2.1 Chemicals
All experimental chemicals were at least analytical reagent (AR). PBS was supplied by Aladdin Industrial Inc. (Shanghai, China). Sodium hypochlorite solution (NaClO, free chlorine >5%), ammonium chloride (NH4Cl), sodium thiosulfate (Na2S2O3) and other chemicals were purchased from Sinopharm Chemical Reagent Co., Ltd (Shanghai, China). Standard solutions of different DBPs were obtained from Sigma-Aldrich (St Louis, Missouri, USA). Ultrapure deionized water, obtained from a Millipore Milli-Q Academic Ultra Pure Water Purification System (resistivity >18.2 MΩ, Billerica, MA, USA), was used to prepare all solutions in batch experiments.2.2 Experimental procedure
The chlor(am)ination experiments were carried out in full and sealed 40 mL amber glass bottles under dark condition (experimental procedure see Fig. S1 in ESI†). The concentration of PBS ([PBS]) was kept at 10 μM. NaOCl was diluted to prepare free chlorine stock solutions. Monochloramine (NH2Cl) solutions were made by mixing equal volumes of NaOCl and NH4Cl at a weight ratio of 4 mg L−1 Cl2 to 1 mg L−1 N–NH4+.19 Free chlorine and total chlorine (as Cl2, mg L−1) were measured by DPD-FAS titration before used.13 The residual disinfectant was rapidly quenched set times by Na2S2O3 at twice molarity to initial chlorine or monochloramine concentration.20 All DBPs tests were performed in at least duplicate.The common condition for disinfection experiments was summarized as: chlorine or monochloramine dose as [Cl2]/[PBS] = 50, contact time as t = 24 h, pH = 7, temperature as T = 25 °C, and without bromide. Each batch experiments varied one parameter from the common condition. Based on the practical conditions of disinfection processes in water treatment, the parameters were set as follows:13 chlorine or monochloramine dose ([Cl2]/[PBS] was 10, 20, 30, 40, 50, 70 and 100), contact time (t was 0.5 h, 1 h, 2 h, 3 h, 6 h, 12 h, 24 h, 48 h and 72 h), pH (5, 6, 7, 8 and 9), temperature (T was 15 °C, 25 °C, and 35 °C), bromide concentration ([Br−]/[Cl2] was 0.01, 0.02, 0.05, 0.1, 0.2, and 0.5). Different chloramine application modes were also evaluated: (1) “chloramination” (added with preformed monochloramine); (2) “preammonification” (added free chlorine to premixed solutions containing PBS and NH4Cl); (3) “prechlorination” (added NH4Cl after 5 min, 10 min and 15 min chlorination of PBS).6,20
2.3 Analytical methods
The concentrations of free chlorine and total chlorine (Cl2, mg L−1) were quantified by a Pocket Colorimeter™ II Chlorine (HACH). The yields of THMs, DCAN, TCAN, and TCNM were determined based on USEPA method 524.2, by using a Purge – Trap sample concentrator (Eclipse 4660, OI, USA) and a Gas Chromatograph – Mass Spectrometry (GC-MS, QP2010, Shimadzu, Japan). The injector temperature was set at 190 °C. The column oven temperature was held at 35 °C for 10 min, increased to 72 °C at 7 °C min−1 and held for 1 min, and then increased to 200 °C at 40 °C min−1 and held for 1 min. The ion source temperature was set at 200 °C. Detection limits for CF, BDCM, DBCM, BF, DCAN, TCAN, and TCNM were 0.061, 0.071, 0.087, 0.095, 0.10, 0.15, and 0.25 μg L−1, respectively. The bromine substitution factor (BSF) was introduced to evaluate the proportion of the DBPs which partially or totally brominated, and BSF(THMs) can be calculated as eqn (1).
 | (1) |
3 Results and discussion
3.1 Effect of disinfectant dose
Fig. 1(a) shows DBPs formation of PBS at different chlorine dosages. As chlorine dose increased, the yield of CF increased gradually, while the concentration of DCAN decreased continuously, though DCAN kept as the main product. Specifically, DCAN concentrations were 28.84 μg L−1 and 20.20 μg L−1 when [Cl2]/[PBS] was 10 and 100, respectively. The difference between formation of CF and DCAN is mainly because of their different stability, and the presence of residual chlorine was found to accelerate the hydrolytic degradation of DCAN.21 The yield of TCAN increased firstly and then decreased, which reached a maximum of 10.31 μg L−1 when [Cl2]/[PBS] = 70. This was mainly due to the instability of TCAN, and it exhibited the result under combined action of TCAN formation and hydrolysis. The regularity of TCNM formation was the same as that of CF.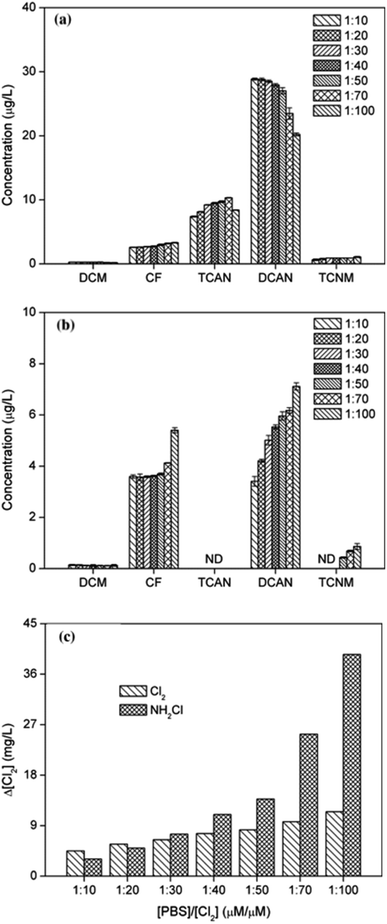 | ||
| Fig. 1 Effect of chlorine (a) or monochloramine (b) dose on DBPs formation from PBS and consumption of disinfectants (c), as chlorine concentration. | ||
It can be seen from Fig. 1(b) that the effect of monochloramine dose on DBPs formation showed different characteristics. The yields of CF, DCAN and TCNM all increased with disinfectant dosage (the same trend as previous studies22,23) and CF could catch up with DCAN during chloramination. Particularly, TCNM only can be detected when [Cl2]/[PBS] ≥50. The yield of DCAN during chloramination was much lower than that of chlorination, and TCAN cannot be detected in chloramination no matter what the chloramine ratio was. This was mainly because of the weaker oxidation ability of chloramine, which showed slow rate to form free chlorine. However, yield of CF was even more than that during chlorination. In addition, the concentration of an intermediate product, dichloromethane (DCM) almost kept the same at all monochloramine doses, meaning that the conversion efficiency of CF was not one of major limiting factors.
Fig. 1(c) shows the consumption of disinfectants after 24 h reaction. With the increase of chlorine dose, there was a large amount of chlorine residual in the solution, accelerating the further hydrolysis of DCAN and leading to the decrease trend of DCAN generation at last. In addition, as disinfectant dose increased, the consumption of monochloramine gradually exceeded that of chlorine.
3.2 Effect of contact time
As shown in Fig. 2, the formations of different DBPs showed different characteristics as contact time increased, both for chlorination and chloramination. The yields of CF increased continuously with reaction time during chlor(am)ination. The eventually concentration of CF was close after 72 h reaction, 9.35 μg L−1 and 10.71 μg L−1 for chlorination and chloramination, respectively. However, the concentrations of DCAN increased firstly and then decreased, which was mainly due to the hydrolytic degradation of DCAN by residual disinfectant.24 Moreover, the inflection point occurred at 24 h for chlorination and 48 h for chloramination, which was because of the different rate to form free chlorine. TCAN only can be detected during chlorination, and it increased in 24 h reaction and changed little then. The yields of TCNM during chlor(am)ination showed similar trend with TCAN in chlorination, which may be because of the weak stability of TCNM as reported before.25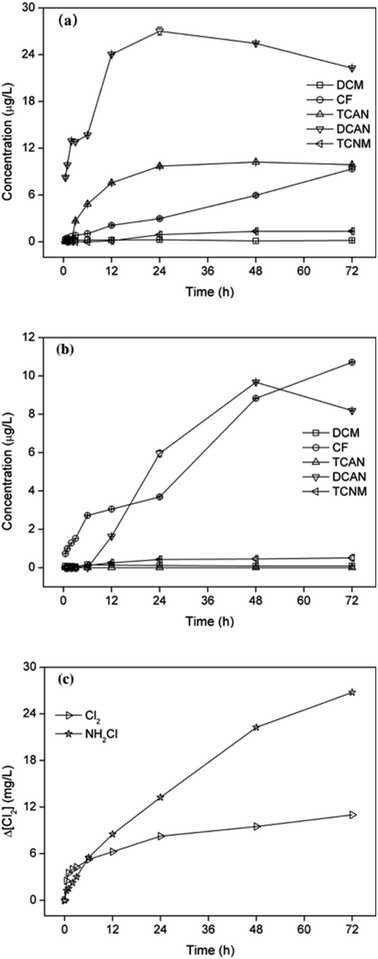 | ||
| Fig. 2 Effect of chlorination (a) or chloramination (b) time on DBPs formation from PBS and consumption of disinfectants (c), as chlorine concentration. | ||
It can be seen from Fig. 2(c), the consumption of disinfectant showed similar trend with increase of DBPs in the initial stage. Particularly, it led to the fast formation of DCAN in 2 h chlorination and rapid increase of CF in 6 h chloramination. The consumption of free chlorine was larger than that of monochloramine within 3 h reaction, and then the consumption of monochloramine increased continuously to exceed that of free chlorine, which mainly due to the low stability of monochloramine.
3.3 Effect of pH
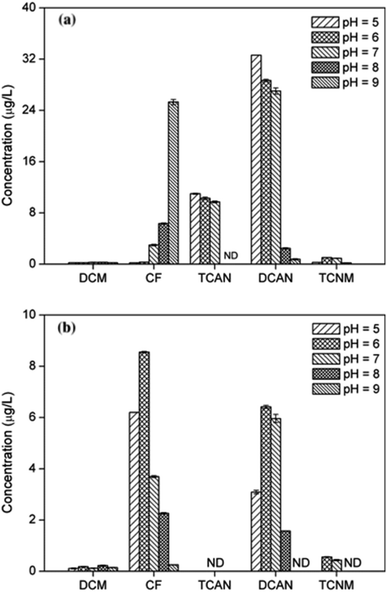
During chlorination (Fig. 3(a)), the yield of CF gradually increased with increasing pH, the same trend as previous study.26 Particularly, it was 0.19 μg L−1 and 25.30 μg L−1 for pH = 5 and pH = 9, respectively. This is probably because that alkaline environment was conducive to the transformation of the intermediate products and eventually generation of CF.13 Conversely, the formation of DCAN and TCAN decreased obviously as pH increased, the same result with previous report.27 For DCAN, it was 32.61 μg L−1 and 2.46 μg L−1 at pH 5 and 8, respectively. What is more, TCAN cannot be detected at pH 8 and 9. This was mainly because the relatively unstable haloacetonitriles (including DCAN and TCAN) could easily hydrolyze under alkaline conditions.28Fig. 3(b) shows that the yields of CF, DCAN and TCNM increased when pH changed from 5 to 6, and then decreased rapidly as pH increased. The yields of different DBPs were maximum when pH = 6, which was different from previous study in which the maximum yields came out at pH 7.6 Moreover, DCAN and TCNM were undetectable when pH reached 9 and 8, respectively. The formation trend of CF, DCAN and TCNM during chloramination was mainly resulted from two aspects: (1) the facilitation of N-DBPs hydrolysis under alkaline conditions; (2) the great impact of pH on the stability and effectivity of monochloramine.29 Under alkaline conditions, monochloramine keeps stable and is difficult to hydrolyze to release free chlorine.
3.4 Effect of temperature
The yields of CF increased gradually with increasing temperature both in chlorination and chloramination (Fig. 4), the same with previous study.6 This was mainly due to the acceleration of formation rate of CF by increasing temperature. The formation of DCAN showed the same trend with CF during chlor(am)ination, which was, however, different from previous study.6 This was probably because that the improvement in generation of DCAN was greater than that in hydrolysis of DCAN, as temperature increased. Moreover, the yields of TCAN during chlorination also increased with temperature, owing to the same reason as DCAN.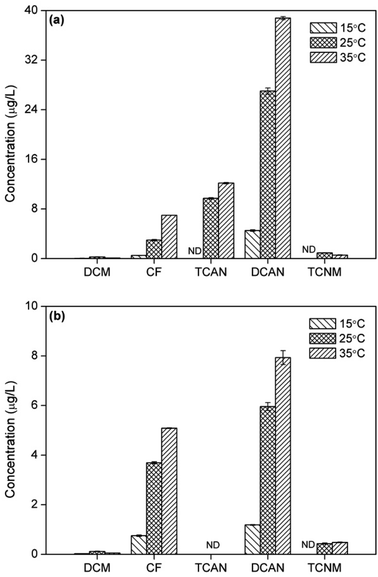 | ||
| Fig. 4 Effect of temperature on DBPs formation from PBS during chlorination (a) or chloramination (b). | ||
However, the formation of TCNM presented different patterns. There was no TCNM detected at 15 °C in both disinfection processes. During chlorination, the yield of TCNM decreased as temperature increased from 25 °C to 35 °C. On the contrast, the concentration of TCNM at 35 °C was larger than that at 25 °C in chloramination. This was because TCNM had low stability and easy to hydrolyze. The higher temperature can both promote the generation and hydrolysis of TCNM, which had opposite influences on TCNM concentration and eventually led to different result.
3.5 Effect of bromide
The effect of bromide on formation potential of THMs was investigated by adding different concentrations of bromide ([Br−]/[Cl2] = 0.01, 0.02, 0.05, 0.1, 0.2 and 0.5, respectively) during chlorination and chloramination. The results were shown in Fig. 5.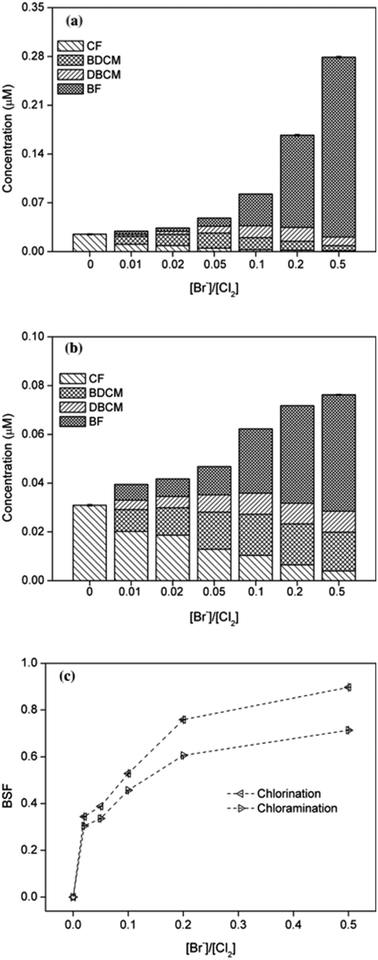 | ||
| Fig. 5 Effect of bromide on THMs formation from chlorination (a) or chloramination (b) of PBS and corresponding bromine substitution factor (BSF) (c). | ||
It can be seen that the total yields of THMs significantly increased with the increasing concentration of bromide, both in chlorination and chloramination, the same result with previous studies.20,23 The rate of increase in yield of THMs in chloramination was obviously higher than that in chlorination, which mainly due to the slower efficiency to release free chlorine. Particularly, the concentration of CF decreased continuously while BF had the opposite pattern, and the yields of BDCM and DBCM increased firstly and then decreased. For chlorination, the maximum values of BDCM and DBCM occurred at [Br−]/[Cl2] = 0.05 and 0.2, respectively. These all indicated the process of bromine substitution for chlorine.
The BSF(THMs) was calculated in order to evaluate the effect of bromide ions. As shown in Fig. 5(c), BSF(THMs) increased with the increasing bromide concentration both for chlorination and chloramination, the same as previous report.30 BSF(THMs) for chlorination was higher than that for chloramination and the value gap gradually increased with increasing bromide concentration, which also because of the slower reaction rate of chloramine. Particularly, when [Br−]/[Cl2] = 0.5, BSF(THMs)s for chlorination and chloramination were 0.96 and 0.77, respectively. Moreover, the addition of bromide increased the overall toxicity of THMs, since brominated DBPs are more toxic than chlorinated DBPs.
In addition, as concentration of bromide increased during chlorination or chloramination, the yield of DCAN decreased obviously and neither TCAN nor TCNM can be detected.
3.6 Effect of chloramination mode
The effects of different chloramination modes (chloramination, prechlorination and preammonification) on the formation potential of DBPs were shown in Fig. 6.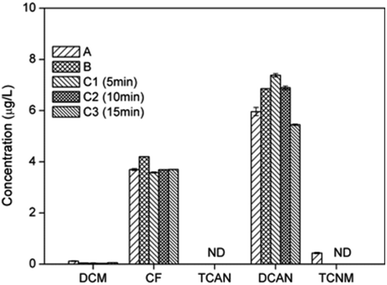 | ||
| Fig. 6 Effect of different chloramination modes (A) chloramination; (B) preammonification; (C) prechlorination on DBPs formation from PBS. | ||
The yields of CF under different chloramination modes were almost the same. This was probably because that CF formation during chlorination and chloramination did not differ significantly when [Cl2]/[PBS] was 50 (2.97 μg L−1 and 3.69 μg L−1, respectively).
The concentrations of DCAN were ranged as: 15 min prechlorination < chloramination < preammonification ∼10 min prechlorination < 5 min prechlorination. This was the result of a combination of two factors: the stronger generation capability of DCAN for chlorination; the rapid consumption of chlorine before the post-addition of amine reduced subsequent chloramine production.
TCAN cannot be detected under all chloramination modes. This was mainly because that the prechlorination time was not long enough to form a stable amount of TCAN.
TCNM only can be detected in chloramination. This was mainly due to the slow generation and low stability of TCNM. The large amount of free chlorine during prechlorination and during the initial reaction after post-addition of chlorine in preammonification accelerated the hydrolysis of TCNM.
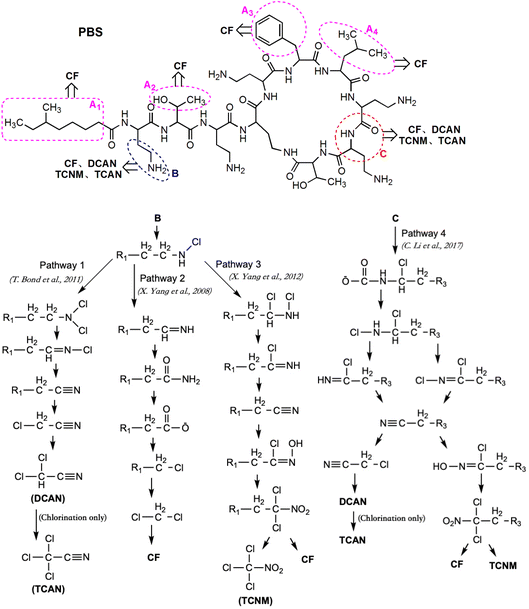
3.7 Proposed formation pathways of DBPs from chlori(am)nation of PBS
The molecule of PBS formed by the dehydration condensation of 11 amino acids with a carboxylic acid, containing a seven-membered ring and a long-chain branch. The molecular structure can be divided into three major categories: 5 short branched chains of hydrocarbon groups (Part A), 5 short branched chains containing free amino acids (Part B) and 11 peptide bonds plus linked hydrocarbon groups (Part C). Referring to previous studies,4,6,13,25,31 the proposed pathways for PBS to generate different DBPs during chlorination and chloramination are shown in Fig. 7 (except that TCAN was only detected in chlorination).The hydrocarbon groups in Part A were easily oxidized by HOCl to form halogenated hydrocarbons, some of which eventually formed CF.6 The hydrocarbon groups in Part B and Part C can also be oxidized to form CF (Fig. 7, Pathway 2 (ref. 31) and Pathway 4 (ref. 13)) though relatively difficult, especially for Part C. For the –CH2–CH2–NH2 group in short chain branches (Part B), substitution and elimination reactions can be carried out under oxidation of HOCl to generate –CH2–C![[triple bond, length as m-dash]](https://www.rsc.org/images/entities/char_e002.gif) N and finally form DCAN and TCAN (Fig. 7, Pathway 1 (ref. 4)). In addition, the amino group in –CH2–CH2–NH2 group can also be oxidized by HOCl to form a nitro group (–NO2) and finally form TCNM (Fig. 7, Pathway 3 (ref. 25)). For the peptide bond moiety in the molecular structure of PBS (Part C), DBPs such as CF, DCAN, TCAN and TCNM can also be generated through different pathways under the function of HOCl (Fig. 7, Pathway 4 (ref. 13)). Considering the difficulty of each reaction, the oxidation of hydrocarbon groups in Part A was the major pathway to form CF, and dominant formation pathways of DCAN/TCAN and TCNM were Pathway 1 and Pathway 3, respectively.
N and finally form DCAN and TCAN (Fig. 7, Pathway 1 (ref. 4)). In addition, the amino group in –CH2–CH2–NH2 group can also be oxidized by HOCl to form a nitro group (–NO2) and finally form TCNM (Fig. 7, Pathway 3 (ref. 25)). For the peptide bond moiety in the molecular structure of PBS (Part C), DBPs such as CF, DCAN, TCAN and TCNM can also be generated through different pathways under the function of HOCl (Fig. 7, Pathway 4 (ref. 13)). Considering the difficulty of each reaction, the oxidation of hydrocarbon groups in Part A was the major pathway to form CF, and dominant formation pathways of DCAN/TCAN and TCNM were Pathway 1 and Pathway 3, respectively.
4 Conclusions
The study demonstrated that PBS, like free amino acids, could be the precursor of typical C-DBPs and N-DBPs during chlorination and chloramination. DCAN was the major DBPs from chlorination of PBS, while CF could catch up with DCAN during chloramination. TCAN could only be detected during chlorination. Different kinds of DBPs exhibited different characteristics as disinfectants dose or contact time increased, which was mainly due to the different oxidation ability of disinfectants and different stability of the products. Particularly, as chlorine dose increased for chlorination, the yields of CF and TCNM increased continuously, the concentration of DCAN decreased persistently, and the formation of TCAN increased firstly and then decreased. It was found that pH and temperature both had great effect on DBPs formation from chlorination and chloramination of PBS, which was mainly because of the effectiveness of disinfectants and the stability of DBPs. As for chloramination, the yields of different DBPs reached maximum values when pH = 6. The concentrations of CF and DCAN increased gradually with temperature. The yields and BSF of THMs gradually increased with the concentration of bromide, both in chlorination and chloramination. In order to reduce the formation of DBPs, the disinfection process can be adjusted to the following conditions: selecting chloramination instead of chlorination, maintaining neutral condition, appropriately lowing reaction temperature and removing bromine from solution. However, the impact of other substances in natural water bodies was not considered in batch experiments, and further research on the control method of DBPs formation is still needed to be carried out in the future.Author contributions
Xingya Wei was in charge of the study and performed the preparation, experiments, analysis and writing. Bangjun Han and Renzheng Gu provided helpful suggestions and discussions. Weimin Geng participated in the collection and analysis of the data. Naiyun Gao helped revise the manuscript. All authors have given approval to the final version of the manuscript.Conflicts of interest
There are no conflicts to declare.Acknowledgements
This work was financially supported by “Chenguang Program” supported by Shanghai Education Development Foundation and Shanghai Municipal Education Commission (No. 18CGB11) and 2022 Research Programs supported by Shanghai Urban Construction Vocational College (No. cjky202233).Notes and references
- A. Tawk, M. Deborde, J. Labanowski and H. Gallard, Water Res., 2015, 76, 132–142 CrossRef CAS PubMed.
- J. J. Rook, Water Treat. Exam., 1974, 23, 234–243 Search PubMed.
- S. W. Krasner, H. S. Weinberg, H. S. Richardson, S. J. Pastor, R. Chinn, M. J. Sclimenti, G. D. Onstad and A. D. Thruston, Environ. Sci. Technol., 2006, 40, 7175–7185 CrossRef CAS PubMed.
- T. Bond, J. Huang, M. R. Templeton and N. Graham, Water Res., 2011, 45, 4341–4354 CrossRef CAS PubMed.
- M. G. Muellner, E. D. Wagner, K. McCalla, S. D. Richardson, Y. T. Woo and M. J. Plewa, Environ. Sci. Technol., 2007, 41, 645–651 CrossRef CAS PubMed.
- X. Wei, N. Gao and C. Li, J. Environ. Chem. Eng., 2017, 5, 4397–4405 CrossRef CAS.
- S. W. Krasner, Philos. Trans. R. Soc., A, 2009, 367, 4077–4095 CrossRef CAS PubMed.
- W. Lee, P. Westerhoff and J. P. Croue, Environ. Sci. Technol., 2007, 41, 5485–5490 CrossRef CAS PubMed.
- A. D. Shah and W. A. Mitch, Environ. Sci. Technol., 2012, 46, 119–131 CrossRef CAS PubMed.
- M. L. Trehy, R. A. Yost and C. J. Miles, Environ. Sci. Technol., 1986, 20, 1117–1122 CrossRef CAS.
- H. Frank, S. Patrick, W. Peter and F. Hannes, Biogeochemistry, 2000, 50, 137–161 CrossRef CAS.
- A. Dotson and P. Westerhoff, J. - Am. Water Works Assoc., 2009, 101, 101–115 CrossRef CAS.
- C. Li, N. Gao, W. Chu, T. Bond and X. Wei, Chem. Eng. J., 2017, 307, 487–495 CrossRef CAS.
- S. Mompelat, B. L. Bot and O. Thomas, Environ. Int., 2009, 35, 803–814 CrossRef CAS.
- N. Wang, J. Gao, Q. Wang, S. Xiao and G. Zhuang, J. Hazard. Mater., 2022, 431, 128616 CrossRef CAS PubMed.
- L. Guzzella, D. Feretti and S. Monarca, Water Res., 2002, 36, 4307–4318 CrossRef CAS PubMed.
- L. Zhang, P. Ma, L. Dai, S. Li, W. Yu and J. Guan, Catal. Sci. Technol., 2021, 11, 3834–3844 RSC.
- L. Zhang, X. Li, S. Chen, J. Guan, Y. Guo and We. Yu, Catal. Commun., 2023, 176, 106627 CrossRef CAS.
- W. A. Mitch and D. L. Sedlak, Environ. Sci. Technol., 2002, 36, 588–595 CrossRef CAS PubMed.
- X. Yang, C. Shang and P. Westerhoff, Water Res., 2007, 41, 1193–1200 CrossRef CAS PubMed.
- D. A. Reckhow, T. L. Platt, A. L. MacNeill and J. N. McClellan, J. Water Supply: Res. Technol.-AQUA, 2001, 50, 1–13 CrossRef CAS.
- X. Sun, L. Che, Y. Lu, L. Sun and S. Zhao, Water Sci. Technol.: Water Supply, 2015, 15, 142–149 CAS.
- F. Wang, B. Gao, D. Ma, R. Li, S. Sun, Q. Yue, Y. Wang and Q. Li, Environ. Sci. Pollut. Res., 2016, 23, 1576–1583 CrossRef CAS PubMed.
- H. Zhang, J. Qu, H. LIU and D. Wei, J. Environ. Sci., 2009, 21, 54–61 CrossRef CAS.
- X. Yang, Q. Shen, W. Guo, J. Peng and Y. Liang, Chemosphere, 2012, 88, 25–32 CrossRef CAS PubMed.
- K. P. Singh, P. Rai, P. Pandey and S. Sinha, Environ. Sci. Pollut. Res., 2012, 19, 113–127 CrossRef CAS PubMed.
- W. Chu, D. Yao, Y. Deng, M. Sui and N. Gao, J. Hazard. Mater., 2017, 327, 153–160 CrossRef CAS PubMed.
- V. Glezer, B. Harris, N. Tal, B. Iosefzon and O. Lev, Water Res., 1999, 33, 1938–1948 CrossRef CAS.
- C. T. Jafvert and R. L. Valentine, Environ. Sci. Technol., 1992, 26, 577–586 CrossRef CAS.
- T. Bond, J. Huang, N. J. D. Graham and M. R. Templeton, Sci. Total Environ., 2014, 470, 469–479 CrossRef PubMed.
- X. Yang, C. Shang, W. Lee, P. Westerhoff and C. Fan, Water Res., 2008, 42, 2329–2339 CrossRef CAS PubMed.
Footnote |
| † Electronic supplementary information (ESI) available. See DOI: https://doi.org/10.1039/d3ra01981k |
| This journal is © The Royal Society of Chemistry 2023 |

![[thin space (1/6-em)]](https://www.rsc.org/images/entities/char_2009.gif)
