 Open Access Article
Fabrication of a lamellar alginate-based aerogel decorated with carbon quantum dots for controlled fluorescence behaviors
Haibing Liu†
a,
Lin Zhang†a,
Jie Guan†a,
Junhang Dingb,
Bingbing Wang *a,
Ming Liu*c,
Daohao Li
 a and
Yanzhi Xiaa
aState Key Laboratory of Bio-fibers and Eco-textiles, College of Materials Science and Engineering, College of Textiles and Clothing, Shandong Collaborative Innovation Center of Marine Bio-based Fibers and Ecological Textiles, Institute of Functional Textiles and Advanced Materials, Qingdao University, Qingdao 266071, P. R. China. E-mail: qduwbb@qdu.edu.cn
bSchool of Rehabilitation Sciences and Engineering, University of Health and Rehabilitation Sciences, Qingdao 266071, P. R. China
cCollege of Tourism and Geographical Science, Qingdao University, Qingdao 266071, P. R. China. E-mail: liumingqd@aliyun.com
First published on 18th May 2023
Abstract
This study aimed to construct an alginate aerogel doped with carbon quantum dots and investigate the fluorescence properties of the composites. The carbon quantum dots with the highest fluorescence intensity were obtained using a methanol–water ratio of 1![[thin space (1/6-em)]](https://www.rsc.org/images/entities/char_2009.gif) :
:![[thin space (1/6-em)]](https://www.rsc.org/images/entities/char_2009.gif) 1, a reaction time of 90 minutes, and a reaction temperature of 160 °C. The fluorescent carbon quantum dot sodium alginate-based aerogel (FCSA) obtained by compounding alginate and carbon quantum dots exhibited excellent fluorescence properties when the concentration of nano-carbon quantum dot solution was 10.0 vol%. By incorporating nano-carbon quantum dots, the fluorescence properties of the lamellar alginate aerogel can be easily and efficiently adjusted. The alginate aerogel decorated with nano-carbon quantum dots exhibits promising potential in biomedical applications due to its biodegradable, biocompatible, and sustainable properties.
1, a reaction time of 90 minutes, and a reaction temperature of 160 °C. The fluorescent carbon quantum dot sodium alginate-based aerogel (FCSA) obtained by compounding alginate and carbon quantum dots exhibited excellent fluorescence properties when the concentration of nano-carbon quantum dot solution was 10.0 vol%. By incorporating nano-carbon quantum dots, the fluorescence properties of the lamellar alginate aerogel can be easily and efficiently adjusted. The alginate aerogel decorated with nano-carbon quantum dots exhibits promising potential in biomedical applications due to its biodegradable, biocompatible, and sustainable properties.
1. Introduction
As a naturally rich and sustainable marine biomass, seaweeds have attracted increasing attention in recent decades. Among them, alginate is a water-soluble polysaccharide extracted from brown algae,1,2 with characteristics of good biocompatibility,3 biodegradability,4 and low toxicity.5 Alginate is a polysaccharide composed of 1–4 linked α-L-guluronic acid (G) and β-D-mannuronic acid (M),6,7 which is widely used in alginate flame retardant fiber,8,9 alginate composite aerogel,10,11 drug carriers,12 and wound healing.13 Particularly, the three-dimensional alginate-based network aerogels have attracted tremendous attention due to their low density,14 large specific surface area,15 and high porosity.16 These unique characteristics of alginate-based aerogels offer unique bioavailability and the ability to carry the target molecules, making them broadly used in aerospace,17 energy storage,18 and as catalyst carriers.19 Additionally, fluorescent nano-level materials, such as semiconductor quantum dots,20 polymer dots,21 and carbon dots,22–25 are extensively reported due to their vital applications in photoelectric devices26 and fluorescent label.27 Due to the unique optical and chemical properties of fluorescent nanomaterials, targeted therapy, biosensing, and biological imaging are widely used in the medical field.28 The carbon quantum dots29–32 are a carbon-based zero-dimensional material with particle sizes of less than 20 nm33 and show greatly potential aspects in terms of photocatalysis34–36 and sensing.37 Carbon quantum dots present good biocompatibility,38 low cytotoxicity,39 environmental protection,40 and good water dispersibility.41 Hence, the constructed composite of alginate-based aerogel doped with carbon quantum dots not only has the features of biocompatibility and degradability of alginate, but also inherits the distinguished fluorescent properties of carbon quantum dots, which can be applied in fluorescence bio-imaging and medical fields.42Herein, carbon quantum dots were synthesized by one-step hydrothermal method. Afterwards, the as-obtained nano-carbon quantum dots with various ratios were blended into sodium alginate solution, and thus alginate-based fluorescent aerogels with different fluorescent properties were successfully fabricated after a freeze-drying process. The results showed that the embedding of nano-carbon quantum dots does not change the excitation wavelength dependence of the sodium alginate-based aerogel, but the corresponding fluorescence properties of the lamellar composite aerogel can be tuned easily and evidently.
2. Experiments
2.1 Materials and reagents
L (+)-Ascorbic acid and anhydrous methanol were purchased from Sinopharm Group Chemical Reagent Co., Ltd Sodium alginate was purchased from Shandong Jiejing Group Co., Ltd All chemicals used were without further purification.2.2 Synthesis of nano-carbon quantum dot
A nano-carbon quantum dot solution was formed by a simple one-step hydrothermal method. First, 0.8 g of L (+)-ascorbic acid was added to 20 mL of methanol–water mixed solution. Then a uniform colorless transparent solution was obtained under stirring for 10 minutes. Next, the above solution was placed in a Teflon-lined stain less steel autoclave and heated at a constant temperature for several hours. After hydrothermal treatment, the nano-carbon quantum dot solution has been prepared successfully.2.3 Construction of sodium alginate-based fluorescent aerogel
At room temperature, 2 g of sodium alginate was added to 100 mL of deionized water under a mechanical stirring. Then 0 mL, 5 mL, 10 mL, and 15 mL of nano-carbon quantum dots solutions were added to 2 wt% sodium alginate aqueous solutions, respectively. The fluorescent carbon quantum dot sodium alginate-based aerogel (denoted as FCSA) was obtained by freeze drying for 48 hours. The FCSAs were called as FCSA-0, FCSA-5, FCSA-10, and FCSA-15, with different nano-carbon quantum dots contents of 0 mL, 5 mL, 10 mL, and 15 mL, respectively.2.4 Characterizations
The fluorescence properties of the nano-carbon quantum dot solution and alginate-based composite aerogels were characterized by a highly sensitive integrated fluorescence spectrometer (FluoroMax-4, Horiba Scientific Instruments Division). The Ultraviolet-visible (UV-Vis) spectrum of the nano-carbon quantum dot solution was attained by UV-Vis spectrophotometer (T9, Beijing General Analysis General Instrument Co., Ltd). The surface functional groups analysis of nano-carbon quantum dots and alginate-based composite aerogels were determined by Fourier Transform Infrared Spectrometer (FTIR) (Nicolet 50, Thermo Fisher Scientific Co., Ltd). The transmission electron microscopy (TEM) and HRTEM analyses of the nano-carbon quantum dots were conducted using a JEM-2100F electron microscope (JEOL, Japan) at an accelerating voltage of 200 kV. The field emission scanning electron microscopy (FESEM) images of alginate-based composite aerogels were acquired on electron microscope (Quanta 250 FEG, FEI, USA). The chemical compositions of the composite aerogels were analyzed by energy dispersive X-ray spectrometer (EDS) attached to the FESEM instrument. X-ray diffraction (XRD) of nano-carbon quantum dot and alginate-based composite aerogels were carried out with DX2700 operating at 40 kV and 30 mA equipped with Cu Kα radiation (λ = 1.5418 Å). X-ray photoelectron spectroscopy (XPS) was completed with ESCA Lab 250 electron spectrometer (Thermo Scientific Corporation) to get detailed chemical compositions of alginate-based composite aerogels.3. Results and discussion
3.1 Fluorescence properties and structural characterizations of nano-carbon quantum dot solution
The as-prepared nano-carbon quantum dot solution was characterized by fluorescence spectrum and ultraviolet-visible absorption spectrum. As shown in Fig. 1(a), the maximum excitation wavelength of the nano-carbon quantum dot solution is 364 nm, the corresponding maximum emission wavelength is 528 nm, and there is a strong ultraviolet absorption peak at 365 nm. Fig. 1(b) shows that the peak intensity at the excitation wavelengths of 360 nm and 370 nm were both strong, which further proves the results obtained in Fig. 1(a).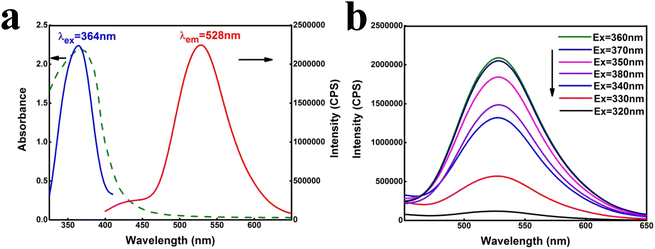 | ||
| Fig. 1 (a) Fluorescence spectra and ultraviolet-visible absorption spectra, (b) the emission spectra of nano-carbon quantum. | ||
The morphology analysis of the nano-carbon quantum dots was performed by transmission electron microscopy (TEM), and the particle size distribution was analyzed by Nano Measure. As displayed in Fig. 2(a) and (b), the results from TEM, high-resolution TEM (HRTEM) and particle size distribution diagrams show that the maximum particle size of 4.1 nm, the minimum particle size of 3.3 nm, and the average particle size of 3.7 nm. The phase structures and functional groups of the nano-carbon quantum dots were analyzed by X-ray diffraction (XRD) and Fourier Transform infrared spectroscopy (FTIR), respectively. Fig. 2(c) shows that a wide diffraction peak at 2θ = 21.2° is obtained. Combined with the HRTEM analysis, it is demonstrated that the carbon quantum dots exist in the microcrystalline state. As shown in Fig. 2(d), the stretching vibration peak of –OH was observed at 3320 cm−1, the stretching vibration peak of C–H bond at 2900 cm−1, and the stretching vibration peak of C![[double bond, length as m-dash]](https://www.rsc.org/images/entities/char_e001.gif) O double bond at 1680 cm−1. The asymmetric and symmetric stretching vibrations of C–O–C were observed at 1143 cm−1 and 1096 cm−1 respectively.
O double bond at 1680 cm−1. The asymmetric and symmetric stretching vibrations of C–O–C were observed at 1143 cm−1 and 1096 cm−1 respectively.
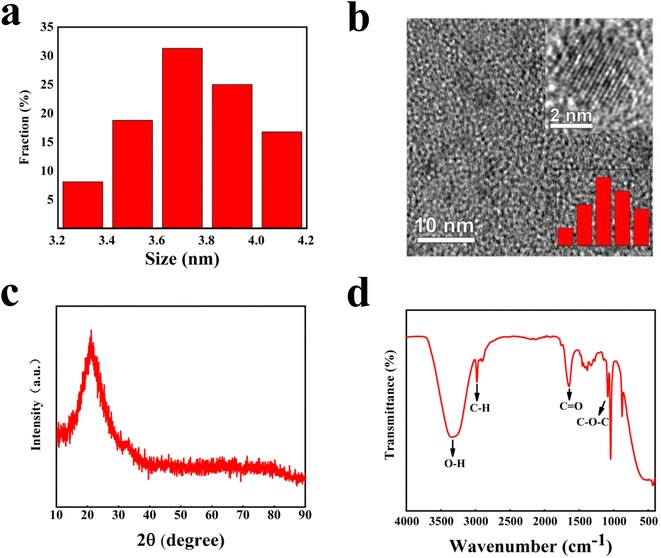 | ||
| Fig. 2 (a) Particle sizes distribution, (b) transmission electron micrographs, (c) X-ray diffraction pattern, and (d) Fourier Transform Infrared spectrum. | ||
As shown in Fig. 3, the methanol–water ratio has a significant effect on fluorescence properties of the nano-carbon quantum dot solution. Under the condition of only water or methanol in binary system (Fig. 3(a)), the nano-carbon quantum dot solution with blue emitters is found, and the fluorescence intensity is much lower than in methanol–water binary system. It is also observed that the emission peak has a red shift and the corresponding half-width becomes wide when only water is used as the solvent in the system. Fig. 3(b) shows that the nano-carbon quantum dot solution synthesized in the methanol–water binary system no longer emits blue light, but emits green light. Moreover, when the ratio of methanol to water is 1![[thin space (1/6-em)]](https://www.rsc.org/images/entities/char_2009.gif) :
:![[thin space (1/6-em)]](https://www.rsc.org/images/entities/char_2009.gif) 1, the fluorescence intensity of the nano-carbon quantum dot solution reaches its maximum.
1, the fluorescence intensity of the nano-carbon quantum dot solution reaches its maximum.
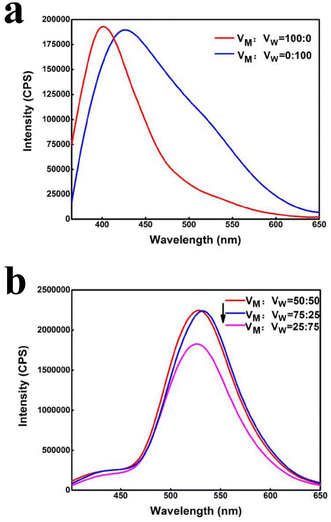 | ||
| Fig. 3 Intensity variations of fluorescence spectra with different methanol volume fraction: (a) 0 and 100% and (b) 25%, 50%, and 75%. | ||
In Fig. 4(a), it is seen the fluorescence intensity of the synthesized nano-carbon quantum dot solution reached the maximum under the reaction time of 90 min. When reaction time was increased from 90 to 150 min, the fluorescence intensity of the nano-carbon quantum dots gradually decreased. Under the reaction time of 180 min, the fluorescence intensity of the emitter was higher than that of the prepared nano-carbon quantum dots solutions at 120 and 150 min. It was concluded that the nano-carbon quantum dot solution prepared at the reaction time of 90 min had the strongest fluorescence intensity. Fig. 4(b) shows that the fluorescence intensity of the synthesized nano-carbon quantum dots was weakest under the reaction temperature of 120 °C. With the temperature increasing from 120 to 160 °C, the fluorescence intensity gradually increased and reached its maximum value. When the temperature was further increased to 180 °C, the fluorescence intensity decreased and the excitation wavelength changed significantly. So, it was determined that the synthesized nano-carbon quantum dot solution had the strongest fluorescence intensity under the reaction temperature of 160 °C.
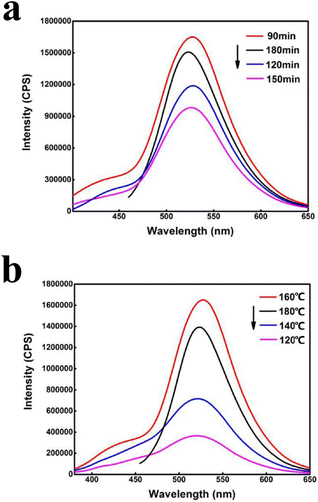 | ||
| Fig. 4 (a) Fluorescence spectra of FCSA at different reaction time and (b) fluorescence spectra of FCSA at different reaction temperatures in methanol–water system. | ||
3.2 Fluorescence properties and morphologies of sodium alginate-based aerogels doped with carbon quantum dots
Fig. 5(a) and (b) are macro photographs of sodium alginate-based fluorescent aerogels exposed to a natural light and an ultraviolet light of 365 nm, respectively. It can be seen that FCSA-0, FCSA-5, FCSA-10, and FCSA-15 all occur white foam-like materials under the natural light. For FCSA-0, a weak blue light was emitted at an ultraviolet light of 365 nm and blue-green lights with different intensities were observed for FCSA-5, FCSA-10, and FCSA-15. Among them, FCSA-10 has the strongest fluorescence property. Fig. 5(c) and (d) show the cross-sectional micro-morphologies of FCSA-0 and FCSA-10, respectively. It is represented that FCSA-0 and FCSA-10 both exhibited two-dimensional (2D) lamellar structures with a smooth surface. Further, it was found that the overall lamella of FCSA-10 aerogel was thicker and denser compared with FCSA-0.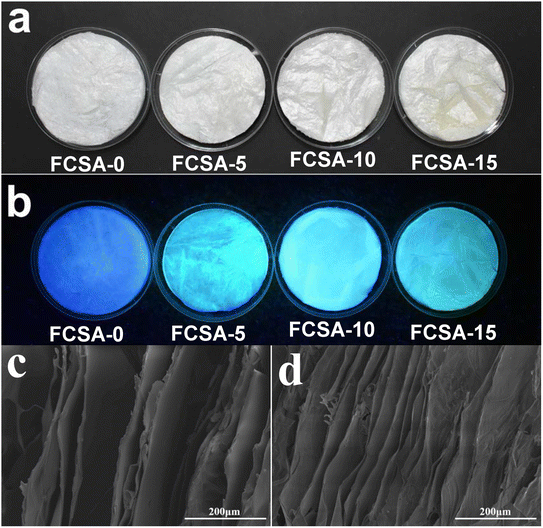 | ||
| Fig. 5 FCSA under (a) natural light and (b) 365 nm UV light, (c) cross-sectional SEM images of FCSA-0 and (d) FCSA-10. | ||
Fig. 6(a) shows that the adding of nano-carbon quantum dots could increasingly enhance the fluorescence performance of sodium alginate-based aerogel. When the nano-carbon quantum dots concentration was increased from 5 vol% to 10 vol%, the fluorescence intensity of the prepared FCSA gradually increased and the emission spectrum was slightly red-shifted. When the nano-carbon quantum dots concentration was up to 10 vol%, the nano-carbon quantum dots were evenly dispersed in FCSA, and the fluorescence intensity of FCSA reached the maximum. When the nano-carbon quantum dots concentration was further increased to 15 vol%, the fluorescence intensity of FCSA dropped sharply due to the aggregations of nano-carbon quantum dots in FCSA. As well known, the sodium alginate solution itself can emit weak blue fluorescence, with excitation wavelength dependence and red-shift phenomenon in the emission spectrum.43 As shown in Fig. 6(b), the nano-carbon quantum dot solution is not dependent on the excitation wavelength. The aerogels composites had excitation wavelength dependence, which is ascribed to the much high content of sodium alginate as the substrate. It can be clearly seen that fluorescence intensity of the sample became greatest under the excitation of an UV light.
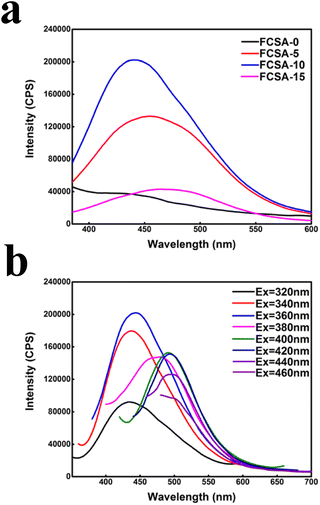 | ||
| Fig. 6 (a) The emission spectra of FCSA-0, FCSA-5, FCSA-10, and FCSA-15, and (b) emission spectra of FCSA-10 under different excitation wavelengths (320 nm–460 nm). | ||
3.3 Microstructures and chemical compositions of sodium alginate-based aerogels doped with carbon quantum dots
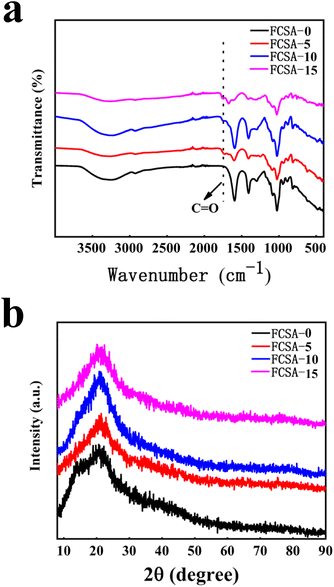
Fourier transform infrared spectra and X-ray diffraction pattern analyses of sodium alginate-based fluorescent composite aerogels were conducted. In Fig. 7(a), it was observed that the functional groups of sodium alginate-based aerogels doped with nano-carbon quantum dots in different proportions were not changed significantly. The stretching vibration peak of C![[double bond, length as m-dash]](https://www.rsc.org/images/entities/char_e001.gif) O double bond was appeared at 1680 cm−1. For FCSA-0, the same peak did not appear. For FCSA-5, FCSA-10, and FCSA-15, C
O double bond was appeared at 1680 cm−1. For FCSA-0, the same peak did not appear. For FCSA-5, FCSA-10, and FCSA-15, C![[double bond, length as m-dash]](https://www.rsc.org/images/entities/char_e001.gif) O stretching vibration peaks all appeared. While the nano-carbon quantum dot solution content increased, the peak intensity gradually increased, and the peak had an obvious shift to 1720 cm−1 for FCSA-15. Fig. 7(b) shows that FCSA-0 had a weak and narrow diffraction peak around 2θ = 14.1°, and a weak and broad diffraction peak around 2θ = 21.2° was found, indicative of characteristic amorphous sodium alginate peaks. For FCSA-5, FCSA-10, and FCSA-15, the diffraction peaks at 2θ = 14.1° was less and less vague with the much covering of nano-carbon quantum dots.
O stretching vibration peaks all appeared. While the nano-carbon quantum dot solution content increased, the peak intensity gradually increased, and the peak had an obvious shift to 1720 cm−1 for FCSA-15. Fig. 7(b) shows that FCSA-0 had a weak and narrow diffraction peak around 2θ = 14.1°, and a weak and broad diffraction peak around 2θ = 21.2° was found, indicative of characteristic amorphous sodium alginate peaks. For FCSA-5, FCSA-10, and FCSA-15, the diffraction peaks at 2θ = 14.1° was less and less vague with the much covering of nano-carbon quantum dots.
Fig. 8(a–d) show the surface energy dispersive spectrometer (EDS) spectrum and X-ray photoelectron spectroscopy (XPS) spectrum for FCSA-10. XPS survey spectrum in Fig. 7(b) shows that the sample is mainly composed of C, O and Na elements, which is consistent with results from the EDS spectrum (Fig. 8(a)). From the high-resolution XPS spectrum of C 1s (Fig. 8(c)), three peaks were observed at 285.1 eV, 286.7 eV, and 288.3 eV, corresponding to three types of carbon C–(C, H), C–O, and C![[double bond, length as m-dash]](https://www.rsc.org/images/entities/char_e001.gif) O, respectively. It is suggested that the appearance of C
O, respectively. It is suggested that the appearance of C![[double bond, length as m-dash]](https://www.rsc.org/images/entities/char_e001.gif) O was stemmed from the addition of nano-carbon quantum dot, which agreed with the result of FTIR analyses in Fig. 7(a) for FCSA-10. From high-resolution spectrum of O 1s (Fig. 8(d)), the two peaks at 531.6 eV and 533.2 eV corresponded to C
O was stemmed from the addition of nano-carbon quantum dot, which agreed with the result of FTIR analyses in Fig. 7(a) for FCSA-10. From high-resolution spectrum of O 1s (Fig. 8(d)), the two peaks at 531.6 eV and 533.2 eV corresponded to C![[double bond, length as m-dash]](https://www.rsc.org/images/entities/char_e001.gif) O and C–O–C or C–OH, respectively, demonstrating the embedding of C
O and C–O–C or C–OH, respectively, demonstrating the embedding of C![[double bond, length as m-dash]](https://www.rsc.org/images/entities/char_e001.gif) O groups. Therefore, it can be concluded that the nano-carbon quantum dots had been successfully doped in alginate aerogels and had a strong interaction each other.
O groups. Therefore, it can be concluded that the nano-carbon quantum dots had been successfully doped in alginate aerogels and had a strong interaction each other.
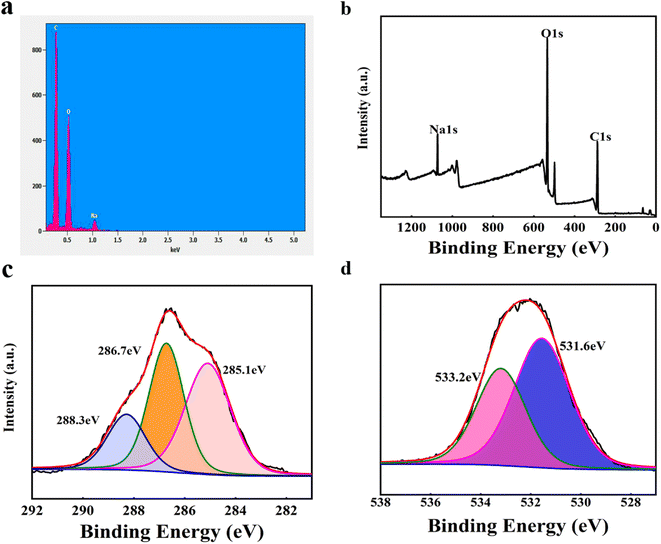 | ||
| Fig. 8 (a) EDS spectrum of FCSA-10, and (b) XPS survey spectrum of FCSA-10 and (c) high-resolution XPS spectrum of O 1s and (d) high-resolution XPS spectrum of C 1s for FCSA-10. | ||
4. Conclusion
In summary, sodium alginate aerogels doped with nano-carbon quantum dots exhibited the excellent and controllable fluorescence properties. The obtained nano-carbon quantum dots had a strong absorption peak at 365 nm, the maximum excitation wavelength was 364 nm, and the maximum emission wavelength was 528 nm. FCSA-0, FCSA-5, FCSA-10, and FCSA-15 were prepared by changing different proportions and using a simple freeze-drying process. The SEM images showed that FCSA-10 still maintained the typical lamellar structures except that the thickness of the sheet was slightly increased compared with that of FCSA-0. The FTIR analyses demonstrated that C![[double bond, length as m-dash]](https://www.rsc.org/images/entities/char_e001.gif) O bonds appeared in FCSA-5, FCSA-10, and FCSA-15, and the peak intensity was enhanced remarkably with the increase of nano-carbon quantum dot concentration. The high-resolution XPS results of C 1s and O 1s also proved the existence of C
O bonds appeared in FCSA-5, FCSA-10, and FCSA-15, and the peak intensity was enhanced remarkably with the increase of nano-carbon quantum dot concentration. The high-resolution XPS results of C 1s and O 1s also proved the existence of C![[double bond, length as m-dash]](https://www.rsc.org/images/entities/char_e001.gif) O bond. The fluorescence intensity can be easily adjusted by adding nano carbon quantum dot solution. The fluorescence intensity of FCSA reached its maximum when the nano-carbon quantum dots content was 10 vol%. This work provides a simple yet efficient avenue to tune fluorescence properties of alginate-based composite aerogels via nano-carbon quantum dots, which has a promising application in the medical field.
O bond. The fluorescence intensity can be easily adjusted by adding nano carbon quantum dot solution. The fluorescence intensity of FCSA reached its maximum when the nano-carbon quantum dots content was 10 vol%. This work provides a simple yet efficient avenue to tune fluorescence properties of alginate-based composite aerogels via nano-carbon quantum dots, which has a promising application in the medical field.
Data availability
The data that support the plots and results within this paper are available from the corresponding authors upon reasonable request.Author contributions
Haibing Liu: writing – original draft, investigation, writing – review & editing, writing – original draft, data curation. Lin Zhang: writing – reviewing and editing. Jie Guan: writing – reviewing and editing. Junhang Ding: investigation, data curation. Bingbing Wang: conceptualization, methodology, writing – review & editing, resources, funding acquisition. Ming Liu: conceptualization, methodology, supervision, writing – reviewing and editing. Yanzhi Xia: methodology, resources.Conflicts of interest
The authors declare no competing interests or non-financial interests.Acknowledgements
All authors commented on the final manuscript. This work is financially supported by the National Natural Science Foundation of China (no. 52273035, no. 51603108), Taishan Scholars Program (no. tspd20181208), the Textile Vision Basic Research Program (no. J202206), the Foundation of Qingdao University State Key Laboratory of Bio-Fibers and Eco-Textiles (no. ZKT09), the Qingdao Science and Technology Plan Key Research and Development Special Project (no. 21-1-2-17-xx), the Postdoctoral Science Foundation of China (no. 2018M632626), the Shandong Provincial Natural Science Foundation (ZR2019BC007).References
- Y. Cai, Q. Lu, X. Guo, S. Wang, J. Qiao and L. Jiang, Adv. Mater., 2015, 27, 4162–4168 CrossRef CAS PubMed.
- C. Liu, P. Li, Y.-J. Xu, Y. Liu, P. Zhu and Y.-Z. Wang, J. Mater. Sci., 2022, 57, 2567–2583 CrossRef CAS.
- O. Veiseh, J. C. Doloff, M. Ma, A. J. Vegas, H. H. Tam, A. R. Bader, J. Li, E. Langan, J. Wyckoff, W. S. Loo, S. Jhunjhunwala, A. Chiu, S. Siebert, K. Tang, J. Hollister-Lock, S. Aresta-Dasilva, M. Bochenek, J. Mendoza-Elias, Y. Wang, M. Qi, D. M. Lavin, M. Chen, N. Dholakia, R. Thakrar, I. Lacik, G. C. Weir, J. Oberholzer, D. L. Greiner, R. Langer and D. G. Anderson, Nat. Mater., 2015, 14, 643–651 CrossRef CAS PubMed.
- A. Agarwal, Y. Farouz, A. P. Nesmith, L. F. Deravi, M. L. McCain and K. K. Parker, Adv. Funct. Mater., 2013, 23, 3738–3746 CrossRef CAS PubMed.
- H. Huang, J. K. Choi, W. Rao, S. Zhao, P. Agarwal, G. Zhao and X. He, Adv. Funct. Mater., 2015, 25, 6839–6850 CrossRef PubMed.
- Z. Li, A. M. Behrens, N. Ginat, S. Y. Tzeng, X. Lu, S. Sivan, R. Langer and A. Jaklenec, Adv. Mater., 2018, 30, 1803925 CrossRef PubMed.
- C. Menakbi, F. Quignard and T. Mineva, J. Phys. Chem. B, 2016, 120, 3615–3623 CrossRef CAS PubMed.
- T. Ye, D. Li, H. Liu, X. She, Y. Xia, S. Zhang, H. Zhang and D. Yang, Macromolecules, 2018, 51, 9360–9367 CrossRef CAS.
- J. Liu, Y. Song, G. Han, Y. Han, Y. Zhang and W. Jiang, J. Nat. Fibers, 2018, 17, 738–744 CrossRef.
- H.-B. Chen, P. Shen, M.-J. Chen, H.-B. Zhao and D. A. Schiraldi, ACS Appl. Mater. Interfaces, 2016, 8, 32557–32564 CrossRef CAS PubMed.
- Y. Gu, S. Chen, J. Ren, Y. A. Jia, C. Chen, S. Komarneni, D. Yang and X. Yao, ACS Nano, 2018, 12, 245–253 CrossRef CAS PubMed.
- K. Wattanakul, T. Imae, W.-W. Chang, C.-C. Chu, R. Nakahata and S.-i. Yusa, Polym. J., 2019, 51, 771–780 CrossRef CAS.
- J. C. Doloff, O. Veiseh, A. J. Vegas, H. H. Tam, S. Farah, M. Ma, J. Li, A. Bader, A. Chiu, A. Sadraei, S. Aresta-Dasilva, M. Griffin, S. Jhunjhunwala, M. Webber, S. Siebert, K. Tang, M. Chen, E. Langan, N. Dholokia, R. Thakrar, M. Qi, J. Oberholzer, D. L. Greiner, R. Langer and D. G. Anderson, Nat. Mater., 2017, 16, 671 CrossRef CAS PubMed.
- D. Chen, H. Gao, Z. Jin, J. Wang, W. Dong, X. Huang and G. Wang, ACS Appl. Nano Mater., 2018, 1, 933–939 CrossRef CAS.
- J. Li, S. Chen, X. Zhu, X. She, T. Liu, H. Zhang, S. Komarneni, D. Yang and X. Yao, Adv. Sci., 2017, 4, 1700345 CrossRef PubMed.
- T. Linhares, M. T. Pessoa de Amorim and L. Duraes, J. Mater. Chem. A, 2019, 7, 22768–22802 RSC.
- L. An, J. Wang, D. Petit, J. N. Armstrong, K. Hanson, J. Hamilton, M. Souza, D. Zhao, C. Li, Y. Liu, Y. Huang, Y. Hu, Z. Li, Z. Shao, A. O. Desjarlais and S. Ren, Nano Lett., 2020, 20, 3828–3835 CrossRef CAS PubMed.
- J. Song, C. Chen, Z. Yang, Y. Kuang, T. Li, Y. Li, H. Huang, I. Kierzewski, B. Liu, S. He, T. Gao, S. U. Yuruker, A. Gong, B. Yang and L. Hu, ACS Nano, 2018, 12, 140–147 CrossRef CAS PubMed.
- S. Mahadik-Khanolkar, S. Donthula, C. Sotiriou-Leventis and N. Leventis, Chem. Mater., 2014, 26, 1303–1317 CrossRef CAS.
- Z. Lv, Y. Wang, J. Chen, J. Wang, Y. Zhou and S.-T. Han, Chem. Rev., 2020, 120, 3941–4006 CrossRef CAS.
- S. Li, X. Wang, R. Hu, H. Chen, M. Li, J. Wang, Y. Wang, L. Liu, F. Lv, X.-J. Liang and S. Wang, Chem. Mater., 2016, 28, 8669–8675 CrossRef CAS.
- Y. Zhou, K. J. Mintz, S. K. Sharma and R. M. Leblanc, Langmuir, 2019, 35, 9115–9132 CrossRef CAS PubMed.
- X. Long, D. Li, B. Wang, Z. Jiang, W. Xu, B. Wang, D. Yang and Y. Xia, Angew. Chem., Int. Ed. Engl., 2019, 58, 11369–11373 CrossRef CAS PubMed.
- X. Yan, B. Wang, J. Ren, X. Long and D. Yang, Angew. Chem., Int. Ed. Engl., 2022, 61, 202209583 Search PubMed.
- M. Z. Fahmi, N. Machmudah, P. Indrawasih, A. Wibrianto, M. A. Ahmad, S. C. W. Sakti and J. Y. Chang, RSC Adv., 2022, 12, 32328–32337 RSC.
- R. K. Behera, A. Sau, L. Mishra, K. Bera, S. Mallik, A. Nayak, S. Basu and M. K. Sarangi, J. Phys. Chem. C, 2019, 123, 27937–27944 CrossRef CAS.
- H. Yukawa and Y. Baba, Anal. Chem., 2017, 89, 2671–2681 CrossRef CAS PubMed.
- A. A. Kajani, L. Rafiee, S. H. Javanmard, N. Dana and S. Jandaghian, RSC Adv., 2023, 13, 9491–9500 RSC.
- R. Wang, K.-Q. Lu, Z.-R. Tang and Y.-J. Xu, J. Mater. Chem. A, 2017, 5, 3717–3734 RSC.
- K.-Q. Lu, Q. Quan, N. Zhang and Y.-J. Xu, J. Energy Chem., 2016, 25, 927–935 CrossRef.
- S. H. Li, B. Weng, K. Q. Lu and Y. J. Xu, Acta Phys.-Chim. Sin., 2018, 34, 708–718 CAS.
- R. Wang, K.-Q. Lu, F. Zhang, Z.-R. Tang and Y.-J. Xu, Appl. Catal., B, 2018, 233, 11–18 CrossRef CAS.
- V. Georgakilas, J. A. Perman, J. Tucek and R. Zboril, Chem. Rev., 2015, 115, 4744–4822 CrossRef CAS PubMed.
- Q. Wang, J. Li, X. Tu, H. Liu, M. Shu, R. Si, C. T. J. Ferguson, K. A. I. Zhang and R. Li, Chem. Mater., 2020, 32, 734–743 CrossRef CAS.
- F. Zhang, Y. H. Li, J. Y. Li, Z. R. Tang and Y. J. Xu, Environ. Pollut., 2019, 253, 365–376 CrossRef CAS.
- S.-H. Li, M.-Y. Qi, Y.-Y. Fan, Y. Yang, M. Anpo, Y. M. A. Yamada, Z.-R. Tang and Y.-J. Xu, Appl. Catal., B, 2021, 292 Search PubMed.
- X. Yan, Y. Song, C. Zhu, H. Li, D. Du, X. Su and Y. Lin, Anal. Chem., 2018, 90, 2618–2624 CrossRef CAS PubMed.
- H. B. Jalali, M. M. Aria, U. M. Dikbas, S. Sadeghi, B. G. Kumar, M. Sahin, I. H. Kavakli, C. W. Ow-Yang and S. Nizamoglu, ACS Nano, 2018, 12, 8104–8114 CrossRef.
- X. Shi, H. Meng, Y. Sun, L. Qu, Y. Lin, Z. Li and D. Du, Small, 2019, 15, 1901507 CrossRef CAS PubMed.
- Y. Huang, Y. Liang, Y. Rao, D. Zhu, J.-j. Cao, Z. Shen, W. Ho and S. C. Lee, Environ. Sci. Technol., 2017, 51, 2924–2933 CrossRef CAS.
- K. Jiang, Y. Wang, C. Cai and H. Lin, Chem. Mater., 2017, 29, 4866–4873 CrossRef CAS.
- Y. Wang, Q. Zhuang and Y. Ni, Chem.–Eur. J., 2015, 21, 13004–13011 CrossRef CAS PubMed.
- G. Tedeschi, J. Jesus Benitez, L. Ceseracciu, K. Dastmalchi, B. Itin, R. E. Stark, A. Heredia, A. Athanassiou and J. A. Heredia-Guerrero, ACS Sustainable Chem. Eng., 2018, 6, 14955–14966 CrossRef CAS.
Footnote |
| † These authors contributed equally to this work. |
| This journal is © The Royal Society of Chemistry 2023 |

