 Open Access Article
Ni–Al layered double hydroxide-coupled layered mesoporous titanium dioxide (Ni–Al LDH/LM-TiO2) composites with integrated adsorption-photocatalysis performance
Li-Yuan Zhang *abc,
Yan-Lin Hana,
Min Liuabc and
Sheng-Lian Denga
aCollege of Chemistry and Chemical Engineering, Neijiang Normal University, Neijiang 641112, China
bKey Laboratory of Fruit Waste Treatment and Resource Recycling of the Sichuan Provincial College, Neijiang 641112, China
cSpecial Agricultural Resources in Tuojiang River Basin Sharing and Service Platform of Sichuan Province, No. 1, Xingqiao Street, Neijiang 641112, Sichuan, China. E-mail: zhangliyuansir@126.com; Tel: +86 832 2341577
First published on 5th June 2023
Abstract
Nickel aluminum layered double hydroxides (Ni–Al LDHs) and layered mesoporous titanium dioxide (LM-TiO2) were prepared via a simple precipitation process and novel precipitation–peptization method, respectively, and Ni–Al LDH-coupled LM-TiO2 (Ni–Al LDH/LM-TiO2) composites with dual adsorption and photodegradation properties were obtained via the hydrothermal approach. The adsorption and photocatalytic properties were investigated in detail with methyl orange as the target, and the coupling mechanism was systematically studied. The sample with the best performance was recovered after photocatalytic degradation, which was labeled as 11% Ni–Al LDH/LM TiO2(ST), and characterization and stability studies were carried out. The results showed that Ni–Al LDHs showed good adsorption for pollutants. Ni–Al LDH coupling enhanced the absorption of UV and visible light, and the transmission and separation of photogenerated carriers were also significantly promoted, which was conducive to improving the photocatalytic activity. After treatment in the dark for 30 min, the adsorption of methyl orange by 11% Ni–Al LDHs/LM-TiO2 reached 55.18%. Under illumination for 30 min, the decolorization rate of methyl orange solution reached 87.54%, and the composites also showed an excellent recycling performance and stability.
1. Introduction
With the rapid development of science and technology, the global economy has also rapidly developed. Furthermore, the protection of the environment has attracted increasing attention. The concept of harmonious coexistence between human beings and nature is popular in society, which has strengthened the treatment of major pollution, such as water and air pollution. In the case of industrial wastewater, organic dye pollution is the most serious due to the complex molecular structure, stable properties, recalcitrance, and high toxicity of organic dyes, and thus they pose a great threat to the water environment.For the treatment of industrial wastewater, the traditionally used technologies are mainly chemical, physicochemical, and biological methods, including electrocatalytic degradation,1–4 ultrasonic treatment,5,6 biological flocculation,7,8 adsorption,9,10 and photocatalytic degradation.11–16 Photocatalytic degradation, namely, photocatalytic oxidation technology, which uses sunlight and simulated natural light as light sources to act on semiconductor catalysts to produce photogenerated electrons and holes, and reacts with O2, H2O, and other active substances to generate hydroxyl radicals, superoxide radicals, and other active substances, and eventually decomposes pollutants into harmless inorganic small molecules. The commonly used photocatalysts are mainly semiconductor materials, including TiO2,17–19 CdS,20 and ZnO.21
Photocatalytic oxidation technology has the advantages of simple operation, significant effect, non-toxicity, and no secondary pollution. Presently, it has become an important means to degrade organic compounds in wastewater, and the most frequently used catalyst is TiO2. However, the band gap of TiO2 is very wide, which means that only under ultraviolet light illumination with a wavelength of less than 387 nm, the electrons on the valence band can be excited to transition to the conduction band, and then photogenerated electrons and holes with high activity are produced. The holes capture electrons of hydroxyl ions or water molecules on the material surface to generate hydroxyl radicals with strong oxidation, and the electrons adsorb oxygen molecules on the specimen surface to produce active superoxide free radicals, ˙O2−, which further transform into free radicals, ˙HO2 and ˙OH. Subsequently, ˙OH can degrade most organic pollutants into small inorganic molecules, CO2 and H2O. However, the sunlight utilization rate of TiO2 is only 3–5%, and the generated electrons and holes easily recombine, which decreases the photocatalytic performance and limits the practical application of TiO2. To address the shortcomings of photocatalysts in practical applications, researchers mainly modify photocatalysts by expanding their light absorption range and improving the separation efficiency of photo-generated carriers. The common modification methods include morphology or size regulation,22,23 metal and non-metal ion doping,24–26 semiconductor recombination,27 precious metal deposition,28 etc.
LDHs are a new class of inorganic materials, also known as ionic clay compounds,29–32 which have attracted extensive attention due to their unique physicochemical properties. The spatial structure of LDHs is similar to the octahedral structure of Mg(OH)2, and its molecular formula is [M2+1−xM3+x(OH)2]x+(An−)x/n·mH2O, where M2+ is a divalent metal ion (such as Zn2+, Fe2+, Mg2+, and Ni2+); M3+ is a trivalent metal ion (such as Al3+, Fe3+, Mn3+, and Cr3+), where the divalent metal ion is the main body of the layer; X is the molar ratio of M3+ and M2+ + M3+, which is generally between 0.2–0.33; and An− is a neutral molecule or anion (H2O, CO2, etc.) that can exist stably between the layers.33–35 The main laminates of LDHs are connected by covalent bonds, and the main forces between the main laminates and the interlayer objects are electrostatic interaction, hydrogen bond, van der Waals force, etc. The layered complex structure is formed between the subjects and objects through orderly arrangement. Due to the unique structure, green environmental protection and other properties of LDHs, they have attracted extensive attention.36–39 Their layered structure is not only controllable and recoverable, but also enables a good adsorption performance. However, their low photocatalytic performance limits their application. As is known, the photocatalytic efficiency of materials is mainly determined by the photon absorption and utilization efficiency, the photogenerated carrier separation efficiency and the surface catalytic reaction efficiency, and thus improving the photocatalytic efficiency requires the synergy of these three aspects. This also makes the coupling of LDHs and semiconductor materials an effective method to elevate their photocatalytic efficiency. Cai et al.40 combined the hydrothermal process and anion exchange method to prepare Co–Al/CdS-LDHs by embellishing bimetallic hydroxides with CdS nanoparticles, which effectively adjusted the photocatalytic activity of Co–Al LDHs under visible light. Wu et al.41 deposited ZnO nanoparticles on the surface of ZnMgAl–CO3-LDH microspheres via the coprecipitation method to form a ZnO/ZnMgAl–CO3-LDH heterojunction photocatalyst, which significantly enhanced the degradation of phenol under UV light, and pointed out that the formation of the heterojunction helped to reduce the recombination rate of excited electrons and holes and improved the photocatalytic performance.
In addition, LDHs are also widely used in the field of photocatalysis. Frogoso et al.42 doped blue light-emitting graphene quantum dots (GQD) in NiTi-based bimetallic hydroxide nanosheets (NiTi-LDH) through a simple impregnation method, and GQD/NiTi-LDH showed excellent photo removal activity for NO and NO2. Zhao et al.43 prepared ZnAl-LDH, which greatly improved the driving force and selectivity for photocatalytic CO2 reduction to CO. Simultaneously, ZnAl-LDH reduced the charge transfer resistance and had a higher photogenerated current density, achieving the reduction of CO2.
The lamellar structure and interlayer anion exchangeability of LDHs endow them with a strong adsorption performance, especially for azo dyes and heavy metal ions in wastewater. However, LDH materials have a low reuse rate after adsorption, cannot be adsorbed under the specific conditions, and are easily affected by other substances. Thus, to improve the property of LDHs, researchers have attempted to modify them in various ways. Deng et al.44 prepared AM/SDS-LDH by inserting sodium dodecyl sulfate between layers, and then grafting acrylamide on LDHs, and tested the adsorption of Congo red by the as-prepared samples. The results showed that the adsorption performance of LDHs after modification was improved, which is mainly due to the electrostatic interaction between the anionic dyes and surface charges. Huang et al.45 synthesized flower-like cobalt aluminum layered double hydroxide hollow microspheres via a one-step solvothermal process. The hollow microspheres possessed a large specific surface area and an excellent adsorption performance. The limited space between the LDH layers provided size selectivity for the adsorbate.
Herein, Ni–Al LDHs and LM-TiO2 were prepared via a simple precipitation method and novel precipitation–peptization approach, respectively, and Ni–Al LDHs/LM-TiO2 composites with adsorption and photodegradation properties were prepared via the hydrothermal process. Furthermore, the modification mechanism was systematically studied, and the adsorption and photocatalytic properties of the samples were investigated.
2. Experimental
2.1 Preparation of LM-TiO2
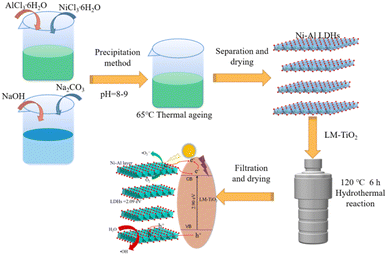
LM/TiO2 was synthesized according to our previous work.46,47 Titanium sulfate (4.8 g) was added to 100 mL deionized water, followed by stirring for 15 min to dissolve it to form a transparent solution, and then ammonia was slowly added dropwise to adjust the pH to 8–9 (about 3 s a drop) and a white precipitate was obtained. Subsequently, it was aged for 1 h, and then washed by centrifugation with deionized water to remove the impurities. Subsequently, the white sediment was transferred to a beaker, and the same amount of deionized water was added and stirred for 15 min to enable even mixing. Next, 0.09 g cetyltrimethylammonium bromide (CTAB) was added and stirred for 20 min. Next, hydrogen peroxide (30%, 8.4 mL) was slowly added dropwise, followed by uninterrupted stirring at 25 °C for 1 h to obtain a transparent yellow sol. The above-mentioned colloidal solution was aged for 12 h, dried at 80 °C in an oven, and then the sample was ground and placed in a crucible. Finally, it was calcined at 550 °C for 2 h in a muffle furnace at a heating rate of 2 °C min−1, followed by cooling in the furnace to get LM-TiO2. Employing the above-mentioned method, simple TiO2 was obtained without the addition of CTAB.2.2 Preparation of LDHs
The preparation of LDHs was based on a previous work.48 Briefly, 1.90 g NiCl2·6H2O and 0.96 g AlCl3·6H2O (Ni![[thin space (1/6-em)]](https://www.rsc.org/images/entities/char_2009.gif) :
:![[thin space (1/6-em)]](https://www.rsc.org/images/entities/char_2009.gif) Al = 1
Al = 1![[thin space (1/6-em)]](https://www.rsc.org/images/entities/char_2009.gif) :
:![[thin space (1/6-em)]](https://www.rsc.org/images/entities/char_2009.gif) 2) were added to 100 mL deionized water under stirring to obtain a green and transparent solution. Then, buffer solution (NaOH and Na2CO3 in molar ratio of 1
2) were added to 100 mL deionized water under stirring to obtain a green and transparent solution. Then, buffer solution (NaOH and Na2CO3 in molar ratio of 1![[thin space (1/6-em)]](https://www.rsc.org/images/entities/char_2009.gif) :
:![[thin space (1/6-em)]](https://www.rsc.org/images/entities/char_2009.gif) 1) was slowly added to the solution to adjust the pH to 9–10 and kept stirring for 1 h, followed by aging at 65 °C for 12 h. Subsequently, the system was cooled to room temperature, filtered, dried in an oven at 80 °C and ground into a powder to obtain the product Ni–Al LDHs.
1) was slowly added to the solution to adjust the pH to 9–10 and kept stirring for 1 h, followed by aging at 65 °C for 12 h. Subsequently, the system was cooled to room temperature, filtered, dried in an oven at 80 °C and ground into a powder to obtain the product Ni–Al LDHs.
2.3 Synthesis of LDHs/LM-TiO2 composites
The powder LM-TiO2 and Ni–Al LDHs (Ni![[thin space (1/6-em)]](https://www.rsc.org/images/entities/char_2009.gif) :
:![[thin space (1/6-em)]](https://www.rsc.org/images/entities/char_2009.gif) Al = 1
Al = 1![[thin space (1/6-em)]](https://www.rsc.org/images/entities/char_2009.gif) :
:![[thin space (1/6-em)]](https://www.rsc.org/images/entities/char_2009.gif) 2) prepared in “2.1” and “2.2” were added to a 50 mL beaker in a certain proportion, and 30 mL absolute ethanol was poured, followed by agitating for 30 min. Subsequently, the system was treated in an ultrasonic cleaner (120 W, 40 kHz) for 30 min, and then continuously stirred for 1 h. After that, the dispersed system was transferred to a reaction kettle at 120 °C for 6 h. Then, the solid precipitation was dried at 80 °C to obtain Ni–Al LDHs/LM-TiO2 composites. A flow chart of the preparation is illustrated in Fig. 1.
2) prepared in “2.1” and “2.2” were added to a 50 mL beaker in a certain proportion, and 30 mL absolute ethanol was poured, followed by agitating for 30 min. Subsequently, the system was treated in an ultrasonic cleaner (120 W, 40 kHz) for 30 min, and then continuously stirred for 1 h. After that, the dispersed system was transferred to a reaction kettle at 120 °C for 6 h. Then, the solid precipitation was dried at 80 °C to obtain Ni–Al LDHs/LM-TiO2 composites. A flow chart of the preparation is illustrated in Fig. 1.
2.4 Adsorption performance
Briefly, 20 mg of the synthesized samples was weighed and put into a quartz tube, and methyl orange solution (30 mL, 20 mg L−1) was added with a pipette, and then put into a photocatalytic reaction instrument with continual stirring in the dark. An appropriate amount of specimens was taken out at regular intervals and centrifuged (4000 rpm) for 6 min, and the absorbance of the supernatant was recorded with an ultraviolet visible spectrophotometer at a wavelength of 465.2 nm, and converted into the concentration C (mg L−1) through the standard curve between absorbance and concentration of solution of methyl orange. The residual amount of methyl orange was determined, and the equilibrium adsorption capacity Qe was calculated according to formula (1) to reflect the adsorption performance of the sample.
 | (1) |
The adsorption kinetics of LDHs/LM-TiO2 was studied using the pseudo-first-order kinetic eqn (2) and pseudo-second-order kinetic eqn (3), and the related constants were also determined.
 | (2) |
 | (3) |
2.5 Photocatalytic performance
0.02 g of the as-prepared solid sample was placed in a quartz tube, and then methyl orange solution (30 mL, 20 mg L−1) was accurately transferred to it using a pipette. The power of the metal halide lamp was regulated to 330 W. The other steps were carried out according to previous work.46 Finally, the mineralization degree of methyl orange before and after the photocatalytic reaction was analyzed by measuring the change in total organic carbon concentration in the degradation process. The mineralization degree of methyl orange was calculated according to eqn (4), where TOC0 is the mass concentration of total organic carbon in the initial methyl orange solution (mg L−1); and TOC30min is the mass concentration of total organic carbon in methyl orange solution (mg L−1) after photocatalytic reaction for 30 min.| Mineralization degree = (1 − TOC30min/TOC0) × 100% | (4) |
2.6 Characterization
The morphology and structure were investigated by scanning electron microscopy (SEM), X-ray diffraction (XRD), and surface area analyzer (BET). The optical characteristics were characterized by ultraviolet-visible spectroscopy (UV-Vis-Abs), Fourier transform infrared spectroscopy (FTIR), X-ray photoelectron spectroscopy (XPS), and fluorescence spectroscopy. The photocurrent (i–t) and electrochemical impedance spectroscopy (EIS) of the prepared samples were recorded on an electrochemical workstation according to an previous work.493. Results and discussion
3.1 Morphology and structure
Fig. 2 presents the SEM images of TiO2, LM-TiO2, LDHs and LDHs/LM-TiO2. It can be observed from Fig. 2a that the particle size of the simple TiO2 obtained by the precipitation–peptization process is similar to that of LM-TiO2; however, the surface of the pristine simple TiO2 is smoother. Some small particles accumulated to form a block solid with a smooth surface and similar particle size. This was caused by the aggregation and sedimentation of the colloidal particles during the sol aging process. In contrast, LM-TiO2, as shown in Fig. 2b, showed a special lamellar morphology, with large particles, most of which were dispersed, and its surface is quite flat. This illustrates that the introduction of CTAB changed the morphology of TiO2, improved the specific surface area, provided active sites for the photocatalytic reaction, and could adsorb more oxygen molecules, which are conducive to the photoreaction. It can be seen in Fig. 2c that Ni–Al LDHs synthesized by the precipitation approach have a basic layered morphology of hydrotalcite compounds. Overall, the particle size of LDHs is small and dispersed, and the material surface is quite smooth; however, their layered morphology is irregular. It also can be observed that large particles were formed by the stacking of fine layered particles. The equipment used to prepare bimetallic materials via the precipitation process is simple and the reaction conditions are mild; however, the products are easily affected by the experimental parameters, such as the dropping rate of precipitant, aging time and temperature, which have a great impact on the morphology of the products. Fig. 2d presents the SEM image of LDHs/LM-TiO2, which basically presents a layered morphology; however, there are no separated laminated particles, the particles are dispersed, and the shape is nearly the same as that of LM-TiO2 and LDHs. However, the surface of LDHs/LM-TiO2 is quite rough with some small particles attached. This may be because, firstly, LDHs have a good dispersion and can be uniformly coupled on the surface of TiO2 during the hydrothermal process. Secondly, the coupling of LDHs and TiO2 inhibits the agglomeration of TiO2. Fig. 2e shows the particle size distribution of LDHs/LM-TiO2, and it can be seen that the average particle size of the sample is 2.43 μm. The specific surface area of the layered particles is larger, which can increase the active site of the material surface to absorb more organic substances, thus facilitating the photocatalytic reaction process. LDHs/LM-TiO2 has a smaller particle size compared with simple TiO2, which is beneficial for shortening the time for the photo-generated electrons and holes to reach the surface of the photocatalyst, accelerating the reaction with substances adsorbed on the catalyst surface, and enhancing the catalytic activity.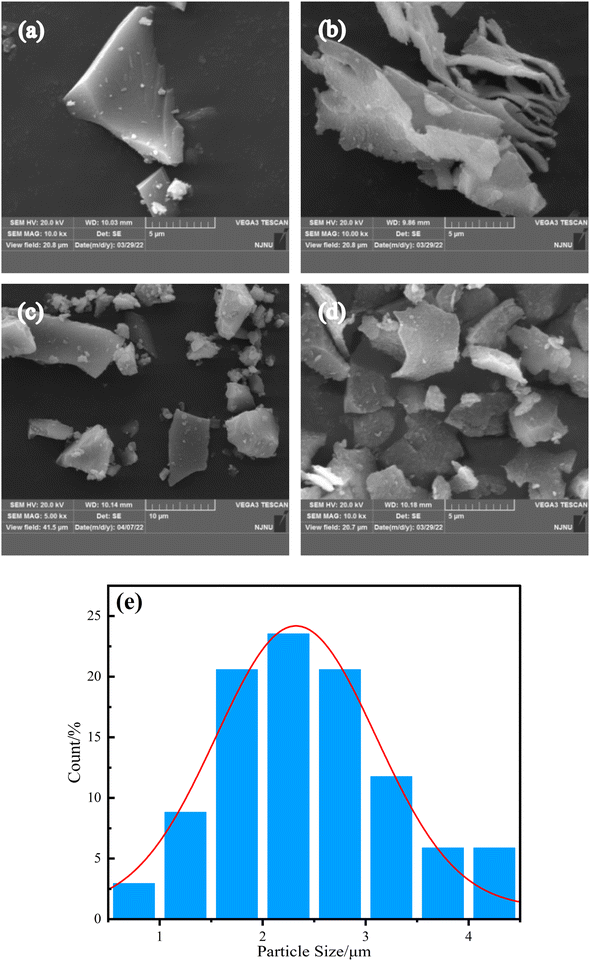 | ||
| Fig. 2 SEM of simple TiO2, LM-TiO2, LDHs and LDHs/LM-TiO2 (a) simple TiO2, (b) LM-TiO2, (c) LDHs, and (d) LDHs/LM-TiO2, and (e) histogram of the particle size distribution of LDHs/LM-TiO2. | ||
Fig. 3 presents the XRD patterns of various LDHs/LM-TiO2 and LDHs calcined at 550 °C. Based on anatase TiO2 (ICDD PDF #21-1272), the diffraction angle at 2θ = 25.3° is the characteristic peak of the (101) lattice plane of anatase titanium dioxide and no diffraction peak of rutile was detected, which indicates that the titanium dioxide prepared at this temperature is anatase. In addition, the diffraction peak position of each diffraction angle in curve f is basically consistent with the standard card (Ni–Al LDHs ICDD PDF#22-0452), indicating that the crystal phase is nickel aluminum bimetallic hydroxides, and it can also be analyzed that it has the characteristics of a layered structure, because the peaks at 11.6° and 22.3° correspond to (003) and (006), respectively. They are generated by the diffraction of the plane base, which can be found in the hexagonal structure of R![[3 with combining macron]](https://www.rsc.org/images/entities/char_0033_0304.gif) m rhombic symmetry.50 According to the curve of simple titanium dioxide in Fig. 3a, the (101) characteristic peak intensity at the 2θ value of 25.3° is quite high with a small peak width, demonstrating that the TiO2 prepared via the precipitation–peptization method has a good crystallinity. Fig. 3b–e show the patterns of CTAB-modified titanium dioxide with a loading of 0%, 9%, 11% and 13% LDHs, respectively. It can be seen that CTAB-modified TiO2 does not have the diffraction peak of CTAB, and the intensity of the characteristic peak decreased and its width increased, illustrating that the crystallinity decreased and the growth of titanium dioxide grains was inhibited. This is because CTAB has a low melting point, and the residues were at a quite low level after calcination at 550 °C. As a surfactant, CTAB has solubilization and other functions, which weaken the crystallization degree of titanium dioxide. After loading LDHs, the peak intensity of LM-TiO2 increased. However, with an increase in the LDH level, the characteristic peak intensity of the specimen showed a weakening trend, indicating that an appropriate amount of LDH-coupled TiO2 promotes crystallization. LDHs have a special layered morphology. Thus, the coupling of LDHs with titanium dioxide results in a certain preferred orientation of the grains, which is reflected by the variation in the intensity of the characteristic peak in the XRD spectrum. In addition, there is no characteristic peak of LDHs in the curves of the LDH/LM-TiO2 composites with various ratios. This is because the loading content of LDHs on the surface of TiO2 is less than the detection limit of the XRD instrument. Besides, according to curve f, it also can be observed that the crystallinity of LDHs synthesized by the precipitation process is not sufficient, which also affects the XRD detection.
m rhombic symmetry.50 According to the curve of simple titanium dioxide in Fig. 3a, the (101) characteristic peak intensity at the 2θ value of 25.3° is quite high with a small peak width, demonstrating that the TiO2 prepared via the precipitation–peptization method has a good crystallinity. Fig. 3b–e show the patterns of CTAB-modified titanium dioxide with a loading of 0%, 9%, 11% and 13% LDHs, respectively. It can be seen that CTAB-modified TiO2 does not have the diffraction peak of CTAB, and the intensity of the characteristic peak decreased and its width increased, illustrating that the crystallinity decreased and the growth of titanium dioxide grains was inhibited. This is because CTAB has a low melting point, and the residues were at a quite low level after calcination at 550 °C. As a surfactant, CTAB has solubilization and other functions, which weaken the crystallization degree of titanium dioxide. After loading LDHs, the peak intensity of LM-TiO2 increased. However, with an increase in the LDH level, the characteristic peak intensity of the specimen showed a weakening trend, indicating that an appropriate amount of LDH-coupled TiO2 promotes crystallization. LDHs have a special layered morphology. Thus, the coupling of LDHs with titanium dioxide results in a certain preferred orientation of the grains, which is reflected by the variation in the intensity of the characteristic peak in the XRD spectrum. In addition, there is no characteristic peak of LDHs in the curves of the LDH/LM-TiO2 composites with various ratios. This is because the loading content of LDHs on the surface of TiO2 is less than the detection limit of the XRD instrument. Besides, according to curve f, it also can be observed that the crystallinity of LDHs synthesized by the precipitation process is not sufficient, which also affects the XRD detection.
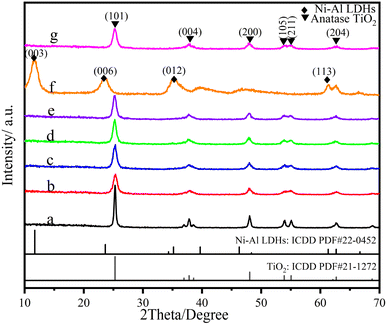 | ||
| Fig. 3 XRD patterns of TiO2 with various coupling ratios and LDHs (a) simple TiO2, (b) 0%, (c) 9%, (d) 11%, (e) 13%, (f) LDHs, and (g) 11% (ST). | ||
As is known, the diffraction intensity and sharpness of the peaks are not only affected by the sample crystallinity, but also related to the grain size. According to the Scherrer formula (5), the smaller the crystal grain, the greater the diffraction peak width, which further indicates that the grain size of CTAB-modified titanium dioxide is reduced, which is also consistent with the SEM results. The grain size of titanium dioxide was calculated using the Scherrer formula (5), and the results are shown in Table 1.
D = Kλ/(β![[thin space (1/6-em)]](https://www.rsc.org/images/entities/char_2009.gif) cos cos![[thin space (1/6-em)]](https://www.rsc.org/images/entities/char_2009.gif) θ) (nm) θ) (nm)
| (5) |
| Sample | Crystallite size/nm |
|---|---|
| TiO2 | 22.30 |
| LM-TiO2 | 9.96 |
| 9% LDHs/LM-TiO2 | 11.85 |
| 11% LDHs/LM-TiO2 | 11.38 |
| 13% LDHs/LM-TiO2 | 11.05 |
| 11% LDHs/LM-TiO2(ST) | 11.54 |
Obviously, the grain size of simple TiO2 is large; however, the introduction of CTAB reduced the grain size, which improved the specific surface area of the specimen and promoted the photoreaction. After coupling with LDHs, the grain size and the diffraction peak intensity both increased; however, with an increasing content of LDHs, the grain size was almost maintained, which illustrates that the loading amount of LDHs does not obviously affect the crystallinity and grain size of the composites.
Fig. 4 shows the N2 adsorption–desorption isothermal curve and pore size distribution of LM-TiO2, 11% LDHs/LM-TiO2 and Ni–Al LDHs. It can be seen in Fig. 4a and b that the curves of LM-TiO2 and 11% LDHs/LM-TiO2 are basically the same; however, there is a convex hysteresis loop at the relative pressure (p/p0) of 0.36 in the second half of the curve, which conforms to type IV H2(b). This phenomenon is often observed in three-dimensional mesoporous materials, illustrating that the product has a complicated pore structure, which includes typical “ink bottle” pores and tubular pores with uneven pore size, and the pore size distribution is quite wide. In addition, the N2 adsorption desorption isotherm curve of Ni–Al LDHs also shows a hysteresis loop, which is mainly related to the capillary condensation of porous materials. This curve belonging to type IV H2(a) has a steeper desorption branch because the pores are blocked at the pore diameter or the hole volatilization effect occurs.
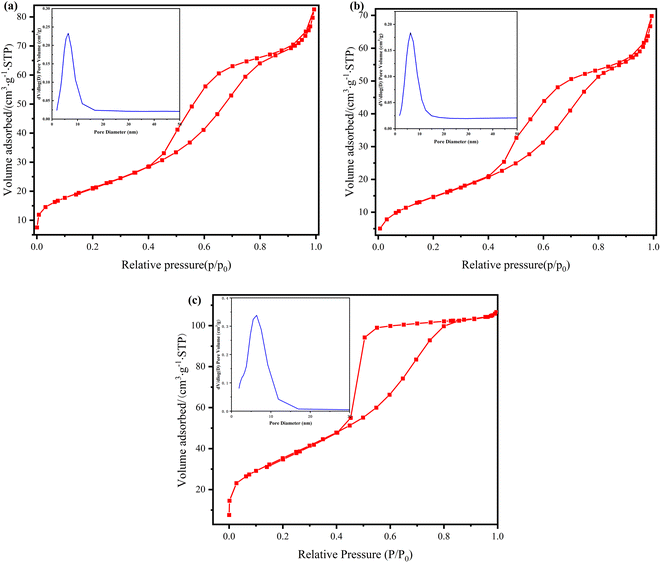 | ||
| Fig. 4 Adsorption–desorption isotherms and pore size distribution of (a) LM-TiO2, (b) 11% LDHs/LM-TiO2 and (c) Ni–Al LDHs. | ||
By analyzing the pore size distribution of the various samples, it can be found in Fig. 4a that LM-TiO2 has a single high and narrow peak, and the distribution is also uniform, mostly in the range 2–16.56 nm, where the average pore size is 6.36 nm. In Fig. 4b, compared with LM-TiO2, the pore size distribution of 11% LDHs/LM-TiO2 is similar; however, the number of mesopores is reduced. Additionally, according to the pore size distribution diagram of Ni–Al LDHs in Fig. 4c, it can be obtained that the LDH sample also forms a mesoporous structure, with an uniform pore size distribution of 1.8–16.57 nm, and the maximum number of pores with an aperture of 6.47 nm is observed. Overall, the pore size distribution of LM-TiO2 (a) and Ni–Al LDHs (c) is very close, indicating that the pore size distribution slightly changed after coupling. The detailed structure data of the samples is shown in Table 2. Ni–Al LDHs have a large specific surface, which is attributed to its special structure. The specific surface area and pore volume of the 11% LDHs/LM-TiO2 composites decreased to a certain extent, which is due to the fact that some pores were blocked during the coupling of LM-TiO2 with LDHs, resulting in a reduction in specific surface area.
| Sample | Specific surface area (m2 g−1) | Pore volume (cm3 g−1) | Pore diameter (nm) |
|---|---|---|---|
| LM-TiO2 | 76.65 | 0.13 | 5.34 |
| 11% LDHs/LM-TiO2 | 56.88 | 0.11 | 5.42 |
| Ni–Al LDHs | 130.42 | 0.16 | 3.77 |
3.2 Optical characteristics
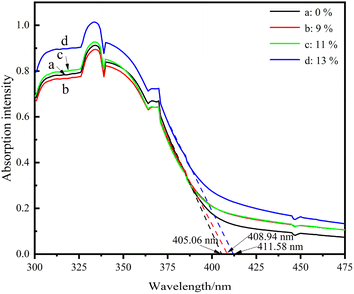
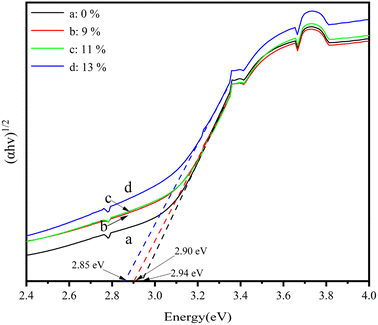
Fig. 5 presents the UV-Vis absorption curves of the LDH/LM-TiO2 samples with various coupling ratios. It can be observed that the absorption intensity of the LDH/LM-TiO2 composites increased in both the UV and visible regions. Also, with an increase in the coupling ratio of LDHs, the absorption intensity of LDHs/LM-TiO2 also increased correspondingly. The increase in absorption intensity effectively improved the photocatalytic ability of LDHs/LM-TiO2. The main reason for this is that the light absorption ability is closely related to the photocatalytic activity. Keeping the other conditions constant, the stronger the ability of the photocatalyst to absorb light, the higher its photocatalytic activity. As shown in Fig. 5, the threshold wavelength of LM-TiO2 particles (λg) is 405.06 nm, and that of both the 9% and 11% LDHs/LM-TiO2 particles is close to 408.94 nm. The threshold wavelength of 13% LDHs/LM-TiO2 is approximately 411.58 nm. This illustrates that the absorption band edge of the sample modified by LDHs has a certain redshift. Thus, the wider absorption range of the modified LDHs/LM-TiO2 resulted in improved photocatalytic activity. The relationship between (αhv)1/2 and photon energy of various LDHs/LM-TiO2 specimens was analyzed by the Tauc plot method, as shown in Fig. 6. The results show that the band gap energy of LM-TiO2, 9%, 11% and 13% LDHs/LM-TiO2 is 2.94 eV, 2.90 eV, 2.90 eV and 2.85 eV, respectively. Shao et al.51 reported that the band gap of Ni–Al LDHs is about 2.09 eV. Generally, the band gap of anatase TiO2 is about 3.2 eV, illustrating that the band gap energy of anatase TiO2 modified with CTAB is reduced. After its modification with LDHs, the energy band gap of LDHs/LM-TiO2 particles decreases with an increase in the content of LDHs. Thus, the light absorption range becomes wider and the photocatalytic property is promoted.After coupling titanium dioxide with LDHs, the UV-Vis absorption band edge was red shifted, which is mainly due to the fact that Ni–Al LDH specimens show strong absorption at about 380 nm and 640 nm in the UV-Vis absorption spectrum. Therefore, after coupling LDHs with titanium dioxide, the absorption intensity in the corresponding UV and visible regions improved.50 Obviously, the absorption enhancement of LDHs/LM-TiO2 in the ultraviolet region can be attributed to the charge transfer from the O 2p to Ni 3d orbital, while the increased absorption in the visible region is due to the feature of Ni2+ in the octahedral configuration, resulting in the d–d transition.52 Therefore, the increase in the absorption intensity of the prepared composites in the UV visible region is mainly due to the action of the small amount of LDHs, and LDHs can provide more photogenerated carriers for photocatalytic reactions, resulting in an improvement in photocatalytic activity.
Fig. 7 illustrates the Fourier transform infrared spectra (FT-IR) of LM-TiO2, LDHs/LM-TiO2 and Ni–Al LDHs. In the infrared spectrum of the Ni–Al LDHs composite, the wide absorption band at about 3800–3400 cm−1 is due to the O–H bond stretching vibration and hydroxyl group of the interlayer water molecules,53 the characteristic peak at about 1635 cm−1 is attributed to the peak generated by the water of crystallization in the layered bimetallic, and the sharp strong peaks at about 1348 cm−1 and 844 cm−1 are caused by the asymmetric stretching of interlayer anion CO32−.53 In the spectra of LM-TiO2 and LDHs/LM-TiO2, the wide absorption peaks at 3800–3400 cm−1 are caused by the stretching of the hydroxyl group on the surface of TiO2 or the O–H bond of the adsorbed water molecules. However, the peak at about 3450 cm−1 is attributed to the bending vibration of H2O molecules. The strong and wide absorption peak detected at approximately 500 cm−1 is attributed to titanium dioxide, and the shape of the two curves is basically the same. The peak observed at about 2360 cm−1 corresponding to the stretching vibration of C–O. With the coupling of LDHs, the peak intensity increased, which may be caused by the increment in the content of CO32− in the interlayer of LDHs. There are many absorption peaks of LDHs in the range of 800–500 cm−1 with high intensity, which may be caused by the stretching vibration of the Ni–O and Al–O bonds formed by metal ions and oxygen atoms or the bonding of metal atom–oxygen atom–metal atoms (Ni–O–Al).54 Through the superposition of LM-TiO2 and LDHs/LM-TiO2 infrared spectra, it can be found that the absorption intensity of 11% LDHs/LM-TiO2 is higher and wider than that of LM-TiO2 at a wavenumber of less than 800 cm−1, indicating that the wave peak in this band contains the absorption peak of Ni–O, Al–O or Ni–O–Al in LDHs, and LDHs were well loaded on the surface of LM-TiO2.
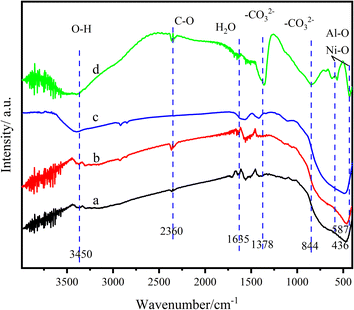 | ||
| Fig. 7 FT-IR spectra of the different materials (a) LM-TiO2, (b) 11% LDHs/LM-TiO2, (c) 11% LDHs/LM-TiO2(ST), and (d) Ni–Al LDHs. | ||
The element composition and chemical bonding state of the LDH/LM-TiO2 surface were characterized by X-ray photoelectron spectroscopy (XPS), and the results are presented in Fig. 8, where Fig. 8a is the XPS full spectrum, while Fig. 8b–f are the element spectra of Ti, O, Ni, Al and C elements, respectively. The charge correction was carried out based on the external pollution carbon (284.8 eV). Simultaneously, the curve of each element was fitted to determine its chemical state or change in surface electronic structure. It can be obtained from Fig. 8a that the main components in LM-TiO2 and LDHs/LM-TiO2 are Ti, O and C, and C elements according to the XPS test. The C element in LDHs/LM-TiO2 has a relatively high content, some of which may be introduced during the sample test, and the other is due to the fact that the interlayer anion of the LDH material is CO32−, and the total amount of C element increased after coupling with LM-TiO2. Besides, some Ni and Al elements were detected in LDHs/LM-TiO2. Fig. 8b shows the XPS spectrum of the Ti element, where the binding energies of spin orbits Ti 2p3/2 and Ti 2p1/2 in LDHs/LM-TiO2 are 458.44 eV and 464.13 eV, respectively. The peak at 458.44 eV belongs to Ti3+ and that at 464.13 eV corresponds to Ti4+,55 in which Ti3+ is attributed to the existence of oxygen vacancy in TiO2.56 Also, the binding energy of Ti element is greater than that of the standard value, demonstrating that Ti mainly existed in the form of Ti4+.55 In comparison with LM-TiO2, the binding energies of the Ti 2p3/2 and Ti 2p1/2 spin orbits of the LDHs/LM-TiO2 composites decreased by 0.45 eV and 0.46 eV, respectively. The change in chemical shift indicates that the modification of LDHs greatly changed the chemical environment around Ti4+, which may be because some Ni atoms and Al atoms entered the LM-TiO2 lattice to form Ti–O–Ni bonds and Ti–O–Al bonds, resulting in lattice distortion and an increase in the electron cloud density of the Ti atom. Consequently, the peak of Ti element moved towards the low energy direction after coupling. This may also be because the Ti element obtains electrons and performs reduction, which shifts the binding energy towards the low field, which is also consistent with the FTIR analysis. The XPS spectrum of O element is shown in Fig. 8c. The binding energy of LDHs/LM-TiO2 at the O 1s orbit is 0.44 eV lower than that of LM-TiO2. Specifically, after coupling LDHs with titanium dioxide, the electron cloud density around the O atom increased, leading to a decrease in the binding energy of the Ti atom. After fitting, the peak of the hydroxyl oxygen (˙OH) appeared at about 530.79 eV,57 and the peak intensity of LDHs/LM-TiO2 hydroxyl oxygen (˙OH) is weaker than that of LM-TiO2, which may be attributed to the loading of LDHs on the surface of titanium dioxide during the coupling process. Therefore, the peak intensity of the hydroxyl oxygen (˙OH) on the sample surface during the XPS test decreased. In addition, this may also be caused by the combination of oxygen atoms with aluminum and nickel atoms to form Al–O bond and Ni–O bond.
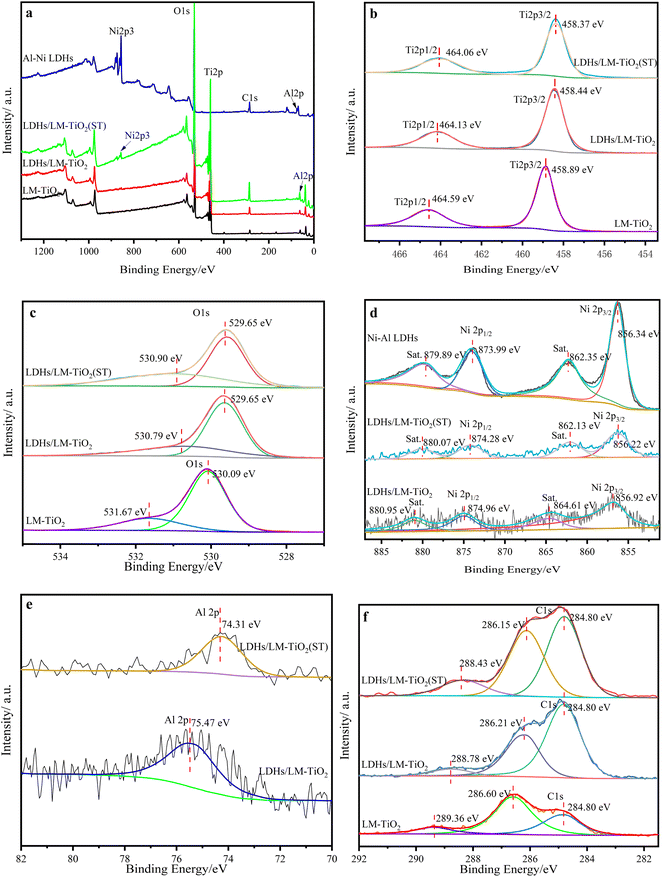 | ||
| Fig. 8 XPS spectra of LM-TiO2, 11% LDHs/LM-TiO2, 11% LDHs/LM-TiO2(ST) and LDHs (a) survey, (b) Ti 2p peaks, (c) O 1s and O 2s peaks, (d) Ni 2p peaks, (e) Al 2p peaks and (f) C 1s peaks. | ||
As observed in Fig. 8d, the peaks at the binding energies of 856.34 eV and 873.99 eV belong to the Ni 2p3/2 and Ni 2p1/2 spin orbits, respectively, which are attributed to Ni–OH.58 Alternatively, the peaks at 862.35 eV and 879.89 eV are the characteristic peaks of Ni 2p3/2 and Ni 2p1/2, respectively, which proves that the nickel in the sample existed in the form Ni3+, and the peaks are caused by the charge transfer and multi-electron transition in the atom.59,60 In addition, it can be observed that the binding energy of Ni 2p in LDHs/LM-TiO2 increased compared with that in Ni–Al LDHs because the binding energy is relevant to the surface electron density. The electrons transferred from the surface of LDHs to TiO2, increasing the surface electron density of titanium dioxide.32 As shown Fig. 8e, the peak at 75.37 eV belongs to the characteristic peak of Al 2p, indicating that aluminum exists in the form of Al3+.61 In the peak fitting diagram of C element in Fig. 8f, the peaks at about 284.8 eV, 286.21 eV and 288.78 eV are the peaks of extraneous C 1s caused in the test. However, according to the comparison of the two curves, it was found that only the peak at 284.8 eV in the LDHs/LM-TiO2 sample is much stronger than that in LM-TiO2, which is due to the increase in the total amount of C element and the intensity of the peak caused by the C source contained in the LDH interlayer anion.
The XPS quantitative results show that the contents of Ti, O, and C in LM-TiO2 are 28.14 at%, 62.21 at%, and 9.65 at%, respectively. The contents of the constituent elements Ti, O, C, Ni and Al in LDHs/LM-TiO2 are 26.09 at%, 54.79 at%, 15.4 at%, 0.95 at%, and 2.77 at%, respectively. It can be obtained that the atomic ratio of O/Ti in LM-TiO2 and LDHs/LM-TiO2 is greater than the stoichiometric ratio of the standard TiO2 (2![[thin space (1/6-em)]](https://www.rsc.org/images/entities/char_2009.gif) :
:![[thin space (1/6-em)]](https://www.rsc.org/images/entities/char_2009.gif) 1). Due to the modification by CTAB in LM-TiO2, the specific surface area of the material increased, making it easier to adsorb water and hydroxyl (˙OH), which resulted in an increase in oxygen content on the material surface. In addition, when LDHs were loaded on the surface of titanium dioxide, the number of interlayer water molecules or surface hydroxyl decreased (Al–OH and Ni–OH), and the oxygen atoms entered the lattice and combined with Al or Ni atoms to form Al–O and Ni–O bonds, which reduced the oxygen content on the specimen surface. Therefore, the ratio of O/Ti in the sample was greater than the standard value.
1). Due to the modification by CTAB in LM-TiO2, the specific surface area of the material increased, making it easier to adsorb water and hydroxyl (˙OH), which resulted in an increase in oxygen content on the material surface. In addition, when LDHs were loaded on the surface of titanium dioxide, the number of interlayer water molecules or surface hydroxyl decreased (Al–OH and Ni–OH), and the oxygen atoms entered the lattice and combined with Al or Ni atoms to form Al–O and Ni–O bonds, which reduced the oxygen content on the specimen surface. Therefore, the ratio of O/Ti in the sample was greater than the standard value.
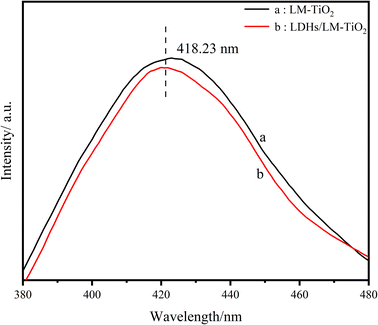
Fig. 9 illustrates the fluorescence spectra, in which the linearity of the two curves is virtually identical. The maximum fluorescence emission wavelength of the two materials is 418.23 nm, and the fluorescence intensity of 11% LDH-modified LM-TiO2 was weakened in the measured wavelength range. As is known from theory, the recombination of electrons and holes produces photoluminescence; however, it is also related to fluorescence luminescence. In the fluorescence spectra, the fluorescence intensity of the maximum absorption peak of 11% LDHs/LM-TiO2 is lower than that of LM-TiO2, which indicates that the photogenerated electrons and holes are not easy to recombine, and the number of photons produced is reduced. Thus, the recombination rate of photogenerated electrons and holes decreased, and the life of electrons and holes was prolonged, which is conducive to the generation of a large number of strong oxidizing groups, thus promoting the photocatalytic reaction.
3.3 Photocurrent and impedance performance analysis
The transfer of photoproduced electrons and holes at the interface of materials is an important factor affecting the photocatalytic activity. Fig. 10 and 11 show the photocurrent (i–t) and electrochemical impedance spectra (EIS) of the as-prepared LM-TiO2, 11% LDHs/LM-TiO2 and Ni–Al LDHs measured by an electrochemical workstation. It can be observed from Fig. 10 that the transient photocurrent intensity of LM-TiO2 and LDHs is quite low, which indicates the low separation rate of photogenerated electrons and holes of the two materials. Additionally, the photocurrent of the 11% LDHs/LM-TiO2 composites is strong, about 0.65 μA cm−2, which is 8 times that of LM-TiO2 (0.08 μA cm−2). This is because the electron coupling between LDHs and titanium dioxide reduces the recombination rate of photogenerated electrons and holes, improves their separation efficiency, and effectively enhances the transmission and separation of photogenerated carriers between them.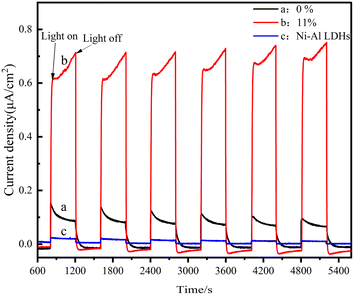 | ||
| Fig. 10 Photocurrent curves of different materials (a) LM-TiO2, (b) 11% LDHs/LM-TiO2, and (c) Ni–Al LDHs. | ||
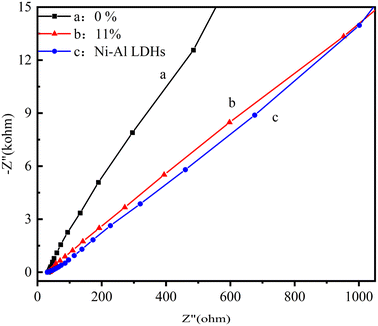 | ||
| Fig. 11 Electrochemical impedance spectroscopy of various materials (a) LM-TiO2, (b) 11% LDHs/LM-TiO2, and (c) Ni–Al LDHs. | ||
Fig. 11 shows the electrochemical impedance spectra of the different samples, which can be used to explore the difficulty of charge transfer on the surface of materials. Generally, the semicircle of the Nyquist plot from the impedance spectrum is regarded as the charge transfer resistance of the electrode material, and its radius is related to the charge transfer efficiency between the electrode and the electrolyte. The smaller the semicircle diameter, the smaller the obstacles encountered by charge transfer at the interface, and the higher the transfer efficiency, which is conducive to the improvement of catalytic activity. It can be observed in Fig. 11 that the radius of LM-TiO2 is larger than that of LDHs; however, the arc radius of the 11% LDHs/LM-TiO2 composite material is smaller than that of LM-TiO2. This indicates that the modified LDHs/LM-TiO2 has a smaller impedance and better conductivity compared to LM-TiO2, illustrating an increase in the mobility and separation rate of the photo-generated electron hole pairs. Based on the above-mentioned results, it can be concluded that LDHs and titanium dioxide were successfully coupled, and the construction of 11% LDHs/LM-TiO2 composites is conducive to the transfer and separation of photogenerated carriers, which is consistent with the PL fluorescence test and following photocatalysis evaluation results.
3.4 Adsorption and photocatalytic performance
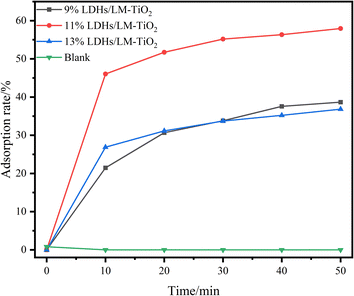
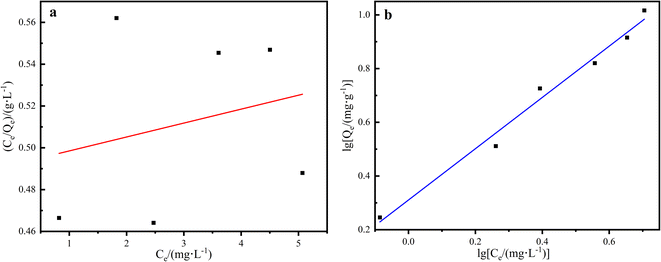
In the adsorption performance investigation, 20 mg L−1 methyl orange solution was used as the adsorbed solution by the different LDHs/LM-TiO2 samples, and the adsorption was performed at room temperature (25 °C) with a solid to liquid ratio of 20 mg/30 mL. The suspension was put in the photocatalysis reactor in the dark, and an ultraviolet spectrophotometer was used to determine the absorbance of the solution at regular intervals. Fig. 12 shows the adsorption rate of methyl orange solution (20 mg L−1) by the different LDHs/LM-TiO2 specimens. As is known, in the photocatalytic process, titanium dioxide has no obvious adsorption effect on methyl orange. It can be seen from Fig. 12 that the three LDHs/LM-TiO2 composites all show a certain adsorption for methyl orange solution. The adsorption rates of 9% and 13% LDHs/LM-TiO2 for methyl orange were 38.65% and 36.83%, respectively. However, that of 11% LDHs/LM-TiO2 reached as high as 57.98%, which is mainly caused by the adsorption of the LDH materials loaded on the surface of TiO2. In addition, the adsorption rate of methyl orange by LDHs/LM-TiO2 was quite fast within 10 min, and with a further extension of the reaction time, the adsorption speed of methyl orange by LDHs/LM-TiO2 gradually decreased, and the adsorption equilibrium was basically reached in 30–40 min.The adsorption isotherms of the 11% LDHs/LM-TiO2 samples were studied. Firstly, methyl orange solution with different concentrations was prepared, and the adsorption tests were carried out with a solid–liquid ratio of 20 mg: 30 mL for 30 min. Subsequently, the solution was taken out and centrifuged, and the absorbance of the supernatant was measured using a UV-vis spectrophotometer, according to which the content of residual methyl orange in the solution after adsorption was determined from the standard curve. The adsorption capacity of LDHs/LM-TiO2 in the different solutions was calculated using formula (1), and the adsorption isotherms of methyl orange on the 11% LDHs/LM-TiO2 samples were fitted by the Langmuir (6) and Freundlich (7) adsorption isotherm equations.
 | (6) |
 | (7) |
| Langmuir | Freundlich | ||||
|---|---|---|---|---|---|
| Qm (mg g−1) | KL (L mg−1) | R2 | n | KF (L g−1) | R2 |
| __ | __ | __ | 1.047 | 2.045 | 0.9807 |
It can be seen from the linear relationship in Fig. 13 and Table 3 that the adsorption of methyl orange by LDHs/LM-TiO2 is better described by the Freundlich adsorption isotherm equation compared with the Langmuir isotherm adsorption model, and the linear correlation coefficient reaches 0.9807. The adsorption of methyl orange on the modified LDHs/LM-TiO2 is bilayer adsorption. As is known, the Freundlich adsorption isotherm model assumes that the adsorption process exists on a heterogeneous surface and is used to describe the reversible adsorption, not only monolayer adsorption.62
To understand the reaction process and mechanism, the adsorption kinetics of LDHs/LM-TiO2 was studied using the pseudo-first-order (2) and pseudo-second-order (3) adsorption kinetic equations, and the adsorption rate constants were also determined. The fitting results are presented in Fig. 14, and the calculated data are listed in Tables 4 and 5. It can be observed from Fig. 14, Tables 4 and 5 that the mean value of the linear correlation coefficient R2 obtained by fitting the different LDHs/LM-TiO2 samples with the pseudo-first-order and pseudo-second-order kinetic equations is 0.9514 and 0.9986, respectively, illustrating that the adsorption of methyl orange by LDHs/LM-TiO2 is more suitably described by the second-order kinetic equation.
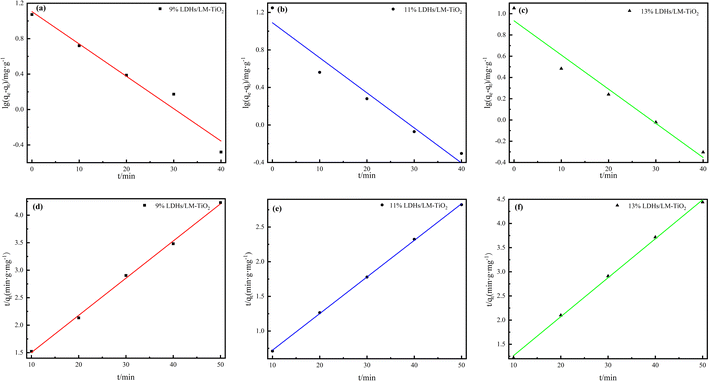 | ||
| Fig. 14 Pseudo-first-order (a–c) and pseudo-second-order (d–f) kinetic models of various LDHs/LM-TiO2 samples. | ||
| LDHs/LM-TiO2 | ρ (mg L−1) | qe (mg g−1) | Pseudo-first-order | ||
|---|---|---|---|---|---|
| kad (min) | qe (mg g−1) | R2 | |||
| 9% | 20.44 | 11.82 | 0.084 | 12.75 | 0.9576 |
| 11% | 17.72 | 0.086 | 12.31 | 0.9409 | |
| 13% | 11.26 | 0.074 | 8.57 | 0.9557 | |
| LDHs/LM-TiO2 | ρ (mg L−1) | qe (mg g−1) | Pseudo-second-order | ||
|---|---|---|---|---|---|
| k (g mg−1 min−1) | qe (mg g−1) | R2 | |||
| 9% | 20.44 | 11.82 | 0.0055 | 14.79 | 0.9977 |
| 11% | 17.72 | 0.0143 | 18.94 | 0.9996 | |
| 13% | 11.26 | 0.0142 | 12.40 | 0.9984 | |
The adsorption rate constant and equilibrium adsorption capacity of LDHs/LM-TiO2 with different coupled ratios were calculated according to the pseudo-second-order kinetic equation. For 11% LDHs/LM-TiO2, the adsorption rate constant (k) and the equilibrium adsorption capacity (qe) are 0.0143 g mg−1 min−1 and 18.94 mg g−1, respectively. In addition, the adsorption rate constant and the equilibrium adsorption capacity of 9% LDHs/LM-TiO2 are 0.0055 g mg−1 min−1 and 14.79 mg g−1, and that of 13% LDHs/LM-TiO2 are 0.0142 g mg−1 min−1 and 12.40 mg g−1, respectively. The adsorption rate constant is positively correlated with the adsorption rate, which means that the adsorption rate and adsorption capacity of 11% LDHs/LM-TiO2 for methyl orange are greater than the other two. The adsorption process conforms to the pseudo second-order kinetic model, and the way is mainly chemical adsorption.
Fig. 15 shows the photocatalytic performance of the LDH/LM-TiO2 samples with various coupling ratios. Firstly, the samples were treated under the same dark conditions for 30 min, and then the absorbance of the supernatant was tested after centrifugation, as shown in Table 6. It can be observed that the absorbance of the titanium dioxide group did not change significantly; however, that of the LDHs/LM-TiO2 group changed obviously, showing a good adsorption performance. Adsorption equilibrium was basically reached after treatment in the dark for 30 min, and thus the photodegradation process could be carried out continuously. Under the same illumination, the decolorization rate of methyl orange by the different LDHs/LM-TiO2 followed the order 11% > 13% > 9% > LM-TiO2 > TiO2 > blank. The absorbance of methyl orange solution in the blank group was basically maintained, indicating that only the photocatalysts had a photocatalytic degradation effect on methyl orange solution. Maintaining the other conditions, the photocatalytic performance of LM-TiO2 was better than that of simple TiO2 when illuminated for 25 min due to the formation of a layered mesoporous structure via the induction of CTAB in the former. Thus, the specific surface area and the number of reactive sites increased, which are helpful for the degradation performance of the photocatalyst.
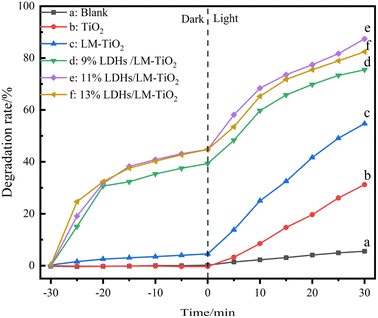 | ||
| Fig. 15 Decolorization rates of methyl orange by simple TiO2 and LDHs/LM-TiO2 with various coupled ratios (a) blank group, (b) TiO2, (c) 0%, (d) 9%, (e) 11%, and (f) 13%. | ||
| Sample | Blank group | TiO2 | 0% | 9% | 11% | 13% |
|---|---|---|---|---|---|---|
| Absorbance after 30 min in dark | 1.440 | 1.448 | 1.380 | 0.876 | 0.797 | 0.798 |
After treatment in the dark, the adsorption rate of LDHs/LM-TiO2 for methyl orange reached about 50%, showing a good adsorption performance. As is known, the degradation of the dye by the photocatalyst is mainly due to the oxidation of hydroxyl radicals and superoxide radicals generated on its surface and the adsorption of methyl orange dye on the photocatalyst surface helps to improve the photocatalytic reaction rate, elevating the photocatalytic performance. Under the same adsorption and illumination, the decolorization rate of LM-TiO2 was 54.72% after 30 min illumination, while that of 11% LDHs/LM-TiO2 was up to 87.54%, and the decolorization rates of 9% and 13% LDHs/LM-TiO2 were 75.64% and 82.56%, respectively. Thus, it can be concluded that the modification of titanium dioxide with an appropriate amount of LDHs significantly improved the photocatalytic degradation efficiency. With an increase in the loading of LDHs, they agglomerated and reduced the number of active sites for the photocatalytic reaction, thus reducing the number of photogenerated electrons and holes and the generated hydroxyl radical (˙OH), which is not beneficial to the photocatalytic reaction.
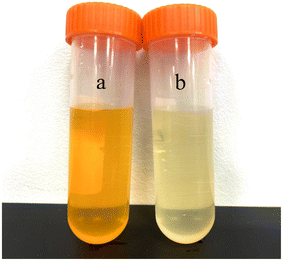
Images of the methyl orange solution before and after degradation are presented in Fig. 16. The mineralization degree of methyl orange solution after photocatalytic degradation by 11% LDHs/LM-TiO2 was determined by testing the change in mass concentration of total organic carbon during the degradation process. According to Table 7, it can be seen that the mineralization degree of methyl orange was 16.0% after photocatalytic degradation. However, according to the change in absorbance, the degradation rate was 87.54%, as illustrated in Fig. 15. The main reason for the significant difference between the two test results is that when 11% LDHs/LM-TiO2 degraded methyl orange solution, most of the chromogenic groups of methyl orange were destroyed and methyl orange changed into colorless substances. This stage involves multiple reaction processes, and only some of the methyl orange eventually degraded into CO2.63
| Sample | TOC (mg L−1) | Mineralization degree (%) |
|---|---|---|
| Initial solution | 12.25 | — |
| Degradation by 11% LDHs/LM-TiO2 | 10.29 | 16.00 |
In this work, LDHs were coupled with LM-TiO2 to prepare adsorption-photocatalysis integrated LDHs/LM-TiO2 composites, which displayed good adsorption and photocatalytic properties. The main reasons for this are as follows: (1) compared with simple TiO2, LDHs/LM-TiO2 has a particular layered mesoporous structure, which increases the specific surface area, and more active sites for the photoreaction are provided on the material surface, which are helpful for the photocatalytic reaction. (2) LDHs have a good adsorption, but weak photocatalytic ability. After coupling with the semiconductor photocatalyst TiO2, the product possessed dual properties of adsorption and photocatalysis. Thus, it can quickly adsorb dyes, such as methyl orange, on its surface, increase the contact area, and effectively elevate the degradation of pollutants under irradiation. (3) Based on simple titanium dioxide, the threshold wavelength of the absorption spectrum of LDHs/LM-TiO2 is red shifted, and the absorption intensity in the ultraviolet and visible regions is obviously increased, which widens the light response range and effectively improves the photocatalytic activity. (4). According to the fluorescence analysis, it can be observed that the fluorescence intensity of LDHs/LM-TiO2 is lower than that of LM-TiO2 to a certain extent, indicating that modification with LDHs reduces the recombination rate of electrons and holes generated by titanium dioxide, thus affecting the photocatalytic reaction. In summary, the LDH-coupled layered mesoporous TiO2 composites improve the photocatalytic activity and also show a good adsorption performance.
In addition, the first-order reaction kinetics was studied, and the kinetic curve of photodegradation of methyl orange solution by the different materials was plotted and fitted, as shown in Fig. 17. As illustrated, each kinetic curve shows a good linear relationship between ln![[thin space (1/6-em)]](https://www.rsc.org/images/entities/char_2009.gif) C0/Ct ∼ t, and the reaction rate constant was calculated according to the formula ln
C0/Ct ∼ t, and the reaction rate constant was calculated according to the formula ln![[thin space (1/6-em)]](https://www.rsc.org/images/entities/char_2009.gif) Ct/C0 = kt. The results demonstrated that the maximum reaction rate constant k was 0.046 min−1 (11% LDHs/LM-TiO2) and the minimum constant k was 0.013 min−1 (TiO2). The photocatalytic degradation of methyl orange by TiO2 and 11% LDHs/LM-TiO2 followed the Langmuir Hinshelwood first-order kinetic model, and the photocatalytic activity of LDH-coupled TiO2 was significantly enhanced.
Ct/C0 = kt. The results demonstrated that the maximum reaction rate constant k was 0.046 min−1 (11% LDHs/LM-TiO2) and the minimum constant k was 0.013 min−1 (TiO2). The photocatalytic degradation of methyl orange by TiO2 and 11% LDHs/LM-TiO2 followed the Langmuir Hinshelwood first-order kinetic model, and the photocatalytic activity of LDH-coupled TiO2 was significantly enhanced.
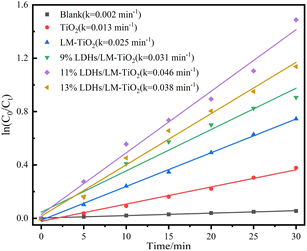 | ||
| Fig. 17 Dynamic curves of degradation of methyl orange by simple TiO2 and LDHs/LM-TiO2 with various coupling ratios. | ||
3.5 Cycling and stability of photodegradation
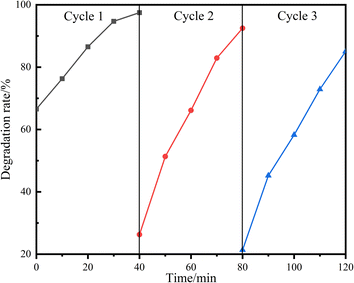
The stability of photocatalysts is quite important in practical applications. Thus, the photocatalytic degradation of methyl orange by the 11% LDH/LM-TiO2 composite was studied, and the stability and recyclability of the catalyst were investigated. As shown in Fig. 18, 11% LDHs/LM-TiO2 showed only slight deactivation after the degradation of methyl orange for three consecutive cycles, and its photocatalytic performance was still quite good. In three cycle tests, the photodegradation of methyl orange by 11% LDHs/LM-TiO2 was 97.50%, 92.49% and 85.05%, respectively. Additionally, after dark treatment, the concentration of methyl orange changed obviously. For the first adsorption, the adsorption rate reached 66.56%, which was reduced to 21.35% in the third cycle. Thus, the adsorption property was significantly reduced. The principal reasons for this are as follows: (1) the methyl orange dye adsorbed in LDHs was not degraded completely during photodegradation, occupying some adsorption sites. (2) During the washing process, methyl orange adhered to the catalyst surface was not completely removed. (3) The adsorption by the sample was mainly attributed to LDHs, and with an increase in the number of experimental repetitions, the content of LDHs loaded on the surface of TiO2 was reduced due to washing, resulting in a reduction in its adsorption performance. However, overall, LDHs/LM-TiO2 still maintained a good photocatalytic performance, indicating that the LDHs/LM-TiO2 composites have a good recycling performance and stability.To demonstrate the stability of the catalyst, 11% LDHs/LM-TiO2 was recovered after photocatalytic degradation and characterized by XRD, FT-IR, and XPS. By comparing curve g in the XRD patterns, curve c in the FTIR spectra, and XPS data of 11% LDHs/LM-TiO2 (ST) with the data before the photocatalytic reaction, it can be seen that the various data for the sample after the reaction are basically consistent with that before the reaction, indicating that 11% LDHs/LM-TiO2 has good stability.
3.6 Photocatalytic degradation mechanism
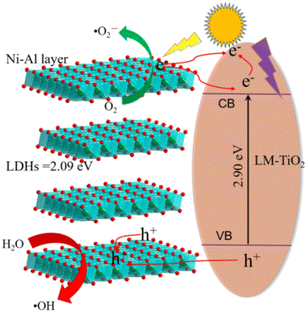
Fig. 19 shows a simple diagram of the adsorption and photocatalysis mechanism of the LDHs/LM-TiO2 composites. According to the UV visible analysis in Section 3.3, the band gap width of LDHs/LM-TiO2 is approximately 2.90 eV, while that of Ni–Al LDHs is 2.09 eV. The valence band and conduction band position of Ni–Al LDHs are higher than that of titanium dioxide. LDHs and titanium dioxide form a Z-type heterojunction, as shown in Fig. 19. Under irradiation, the photogenerated electrons (e−) in the valence band of LDHs transition into the conduction band, and an equal number of holes (h+) are generated in the original valence band. Then, the photogenerated electrons of LDHs transfer from the conduction band with a high Fermi level to the conduction band with a low Fermi level (TiO2) under the action of a potential difference. Simultaneously, the holes produced in the valence band of TiO2 with a low Fermi level move to the valence band of LDHs with a high Fermi level. Besides, some researchers believe that electrons in the TiO2 conduction band are directly recombined with the holes in the valence band of LDHs. Briefly, the formation of this Z-type heterojunction mainly enhances the photocatalytic activity by strengthening the separation of photogenerated electrons and holes, thus inhibiting their recombination.The photocatalytic degradation mechanism of LDHs/LM-TiO2 on dyes is mainly that LDHs/LM-TiO2 absorbs greater photon energy than the bandgap energy, and the electrons in the valence band are excited to transition to the conduction band, while creating holes in the valence band. The electrons and holes generated during this process migrate to the surface of LDHs/LM-TiO2 under the action of an electric field and diffusion. The holes oxidize H2O and HO− adsorbed on the surface of the material into hydroxyl radicals (HO˙) with strong oxidizing activity. Simultaneously, the photogenerated electrons undergo a reduction reaction with the oxygen molecules adsorbed on the material surface to generate superoxide radicals (˙O2−), which further react with H+ to produce H2O2. Finally, the strong oxidizing free radicals such as HO˙ and ˙O2− can specifically mineralize the organic dye molecules adsorbed on the surface of LDHs/LM-TiO2 without breaking the special structure of LDHs/LM-TiO2.
4. Conclusion
Ni–Al LDHs were prepared using nickel chloride and aluminum chloride as raw materials via a simple precipitation process and coupled with LM-TiO2 synthesized by a novel precipitation–peptization approach to obtain Ni–Al LDH/LM-TiO2 composites via the hydrothermal process. The as-prepared composites possessed a large specific surface area and showed a good adsorption and photocatalytic performance for methyl orange. After coupling with Ni–Al LDHs, the light absorption intensity of TiO2 was significantly enhanced, and the UV-Vis absorption band edge showed a certain degree of red shift, inhibiting the recombination of photogenerated electrons and holes, and thus an excellent adsorption and photocatalytic performance was observed. This novel adsorption-photocatalysis-integrated Ni–Al LDH/LM-TiO2 composite provides a reference for the treatment of organic pollutants in sewage.Conflicts of interest
The authors declare that they have no conflicts of interest.Acknowledgements
This work was funded by the Sichuan Science and Technology Plan Project (2023YFG0247), and the Youth Project of Neijiang Normal University (2022QN24).References
- C. C. Li, D. Zhang and X. P. Chen, et al., NiO-Ni foam supported Ag3PO4 for efficient photoelectrocatalytic degradation of oil pollutant in water, Sep. Purif. Technol., 2022, 286, 120410 CrossRef CAS.
- C. Hu, Q. Zhao and G. L. Zang, et al., Preparation and characterization of a novel Ni-doped TiO2 nanotube-modified inactive electrocatalytic electrode for the electrocatalytic degradation of phenol wastewater, Electrochim. Acta, 2021, 405, 139758 CrossRef.
- B. R. Ma, S. S. Xin and X. M. Ma, et al., Preparation of ternary reduced graphene oxide/BiOBr/TiO2 nanotube arrays for photoelectrocatalytic degradation of p-chloronitrobenzene under visible light irradiation, Appl. Surf. Sci., 2021, 551, 149480 CrossRef CAS.
- S. Han, W. Qu and J. Xu, et al., Chemical bath deposition of well-ligned ZnO nanorod arrays on Ag rods for photoelectrocatalytic degradation of rhodamine B, Phys. Status Solidi, 2017, 214(9), 1700059 CrossRef.
- Y. Yu, B. H. Yao and Y. Q. He, et al., Piezo-enhanced photodegradation of organic pollutants on Ag3PO4/ZnO nanowires using visible light and ultrasonic, Appl. Surf. Sci., 2020, 528, 146819 CrossRef CAS.
- R. Mahdavi and S. S. Ashraf Talesh, Enhancement of ultrasound-assisted degradation of Eosin B in the presence of nanoparticles of ZnO as sonocatalyst, Ultrason. Sonochem., 2019, 51, 230–240 CrossRef CAS PubMed.
- N. Ntsangani, K. Okaiyeto and N. U. Uchechukwu, et al., Bioflocculation potentials of a uronic acid-containing glycoprotein produced by Bacillus sp. AEMREG4 isolated from Tyhume River, South Africa, Biotech, 2017, 7(1), 78 Search PubMed.
- C. Y. Zhong, S. Su and D. J. Zhang, et al., Production of a bioflocculant from ramie biodegumming wastewater using a biomass-degrading strain and its application in the treatment of pulping wastewater, Chemosphere, 2020, 253, 126727 CrossRef CAS PubMed.
- F. M. Mpatani, A. A. Aryee and A. N. Kani, et al., Uptake of micropollutant-bisphenol A, methylene blue and neutral red onto a novel bagasse-β-cyclodextrin polymer by adsorption process, Chemosphere, 2020, 259(5), 127439 CrossRef CAS PubMed.
- R. F. Wang, L. G. Deng and X. J. Fan, et al., Removal of heavy metal ion cobalt (II) from wastewater via adsorption method using microcrystalline cellulose–magnesium hydroxide, Int. J. Biol. Macromol., 2021, 189, 607–617 CrossRef CAS PubMed.
- Y. Zhang, N. Xie and L. Zhang, et al., Synthesis of Bi2MoO6/BiOI composites for visible light driven photocatalytic degradation of methylene blue, Sci. Adv. Mater., 2021, 13(4), 545–549 CrossRef CAS.
- L. Y. Zhang, J. You and Q. W. Li, et al., Preparation and photocatalytic properties of CdS/F-TiO2 composites, Coatings, 2019, 9(12), 824 CrossRef CAS.
- A. Manohar, K. Chintagumpala and K. H. Kim, Magnetic hyperthermia and photocatalytic degradation of rhodamine B dye using Zn-doped spinel Fe3O4 nanoparticles, J. Mater. Sci.: Mater. Electron., 2021, 32(6), 1–10 Search PubMed.
- J. X. Zhang, K. Y. Luo and K. Zhao, et al., A synergistic boost of photo-activity of ZnO for photocatalytic degradation of methylene blue by Ag decoration and Fe doping, Mater. Lett., 2020, 286(8), 129250 Search PubMed.
- I. Shahzadi, M. Islam and H. Saeed, et al., Formation of biocompatible MgO/cellulose grafted hydrogel for efficient bactericidal and controlled release of doxorubicin, Int. J. Biol. Macromol., 2022, 220, 1277–1286 CrossRef CAS PubMed.
- S. Moeen, M. Ikram and A. Haider, et al., Comparative study of sonophotocatalytic, photocatalytic, and catalytic activities of magnesium and chitosan-doped Tin oxide quantum dots, ACS Omega, 2022, 7(50), 46428–46439 CrossRef CAS PubMed.
- W. R. Zhang, Y. H. Wang and M. L. Hao, et al., Enhanced photocatalytic degradation of organic pollutants under visible light using Ag-modified TiO2 on activated carbon fibers, Nano, 2021, 16(10), 2130009 CrossRef CAS.
- F. G. Hu, S. P. Sun and H. L. Xu, et al., Investigation on g-C3N4/rGO/TiO2 nanocomposite with enhanced photocatalytic degradation performance, J. Phys. Chem. Solids, 2021, 156, 110181 CrossRef CAS.
- K. Badvi and V. Javanbakht, Enhanced photocatalytic degradation of dye contaminants with TiO2 immobilized on ZSM-5 zeolite modified with nickel nanoparticles, J. Cleaner Prod., 2020, 280, 124518 CrossRef.
- M. Junaid, M. Imran and M. Ikram, et al., The study of Fe-doped CdS nanoparticle-assisted photocatalytic degradation of organic dye in wastewater, Appl. Nanosci., 2019, 9(3), 1593–1602 CrossRef CAS.
- J. Hammouche, K. Daoudi and S. Columbus, et al., Structural and morphological optimization of Ni doped ZnO decorated silicon nanowires for photocatalytic degradation of methylene blue, Inorg. Chem. Commun., 2021, 131, 108763 CrossRef CAS.
- M. Ikram, A. Haider and M. Imran, et al., Cellulose grafted poly acrylic acid doped manganese oxide nanorods as novel platform for catalytic, antibacterial activity and molecular docking analysis, Surf. Interfaces, 2023, 37, 102710 CrossRef CAS.
- A. Raza, J. Z. Hassan and M. Ikram, et al., Advances in liquid-phase and intercalation exfoliations of transition metal dichalcogenides to produce 2D framework, Adv. Mater. Interfaces, 2021, 8(14), 2002205 CrossRef CAS.
- M. Ikram, A. Haider and M. Imran, et al., Assessment of catalytic, antimicrobial and molecular docking analysis of starch-grafted polyacrylic acid doped BaO nanostructures, Int. J. Biol. Macromol., 2023, 230, 123190 CrossRef CAS PubMed.
- M. Ikram, A. Haider and M. Imran, et al., Facile synthesis of copolymerized cellulose grafted hydrogel doped calcium oxide nanocomposites with improved antioxidant activity for anti-arthritic and controlled release of doxorubicin for anti-cancer evaluation, Int. J. Biol. Macromol., 2023, 235, 123874 CrossRef PubMed.
- M. Ikram, A. Haider and S. T. Bibi, et al., Synthesis of Al/starch co-doped in CaO nanoparticles for enhanced catalytic and antimicrobial activities: experimental and DFT approaches, RSC Adv., 2022, 12, 32142–32155 RSC.
- J. X. Bai, R. C. Shen and K. Zhou, et al., Integration of 2D layered CdS/WO3 S-scheme heterojunctions and metallic Ti3C2 MXene-based Ohmic junctions for effective photocatalytic H2 generation, Chin. J. Catal., 2022, 43(2), 359–369 CrossRef CAS.
- Q. G. Fan, T. Wang and W. Fan, et al., Recyclable visible-light photocatalytic composite materials based on tubular Au/TiO2/SiO2 ternary nanocomposites for removal of organic pollutants from water, Compos. Commun., 2022, 32, 101154 CrossRef.
- Z. F. Gao, J. X. Liang and J. Yao, et al., Synthesis of Ce-doped NiAl LDH/RGO composite as an efficient photocatalyst for photocatalytic degradation of ciprofloxacin, J. Environ. Chem. Eng., 2021, 9(4), 105405 CrossRef CAS.
- K. M. Dietmann, T. Linke and M. D. N. Sánchez, et al., Layered double hydroxides with intercalated permanganate and peroxydisulphate anions for oxidative removal of chlorinated organic solvents contaminated water, Minerals, 2020, 10(5), 462 CrossRef CAS.
- M. M. Yan, Y. B. Huang and H. C. He, et al., Efficient removal of arsenic (III) from aqueous solutions by new layered hydroxides (Ca-Fe-Cl LDHs), J. Dispersion Sci. Technol., 2020, 42(7), 998–1008 CrossRef.
- S. X. Chen, Y. F. Huang and X. X. Han, et al., Simultaneous and efficient removal of Cr(VI) and methyl orange on LDHs decorated porous carbons, Chem. Eng. J., 2018, 352, 306–315 CrossRef CAS.
- M. A. Oliver-Tolentino, J. Vázquez-Samperio and A. Manzo-Robledo, et al., An approach to understanding the electrocatalytic activity enhancement by superexchange interaction toward OER in alkaline media of Ni-Fe LDH, J. Phys. Chem. C, 2014, 118(39), 22432 CrossRef CAS.
- L. H. Yao, D. Wei and D. P. Yan, et al., ZnCr layered double hydroxide (LDH) nanosheets assisted formation of hierarchical flower-like CdZnS@LDH microstructures with improved visible-light-driven H2 production, Chem.–Asian J., 2015, 10(3), 630–636 CrossRef CAS PubMed.
- A. Guzmán-Vargas, E. Lima and G. A. Uriostegui-Ortega, et al., Adsorption and subsequent partial photodegradation of methyl violet 2B on Cu/Al layered double hydroxides, Appl. Surf. Sci., 2016, 365, 372–380 CrossRef.
- H. Q. Liu, D. P. Zhao and Y. Liu, et al., NiMoCo layered double hydroxides for electrocatalyst and supercapacitor electrode, Sci. China Mater., 2020, 64, 581–591 CrossRef.
- J. S. Yang, C. Li and D. L. Liang, et al., Central-collapsed structure of CoFeAl layered double hydroxides and its photocatalytic performance, J. Colloid Interface Sci., 2021, 590, 571–579 CrossRef CAS PubMed.
- S. F. Fu, Y. Zheng and X. B. Zhou, et al., Visible light promoted degradation of gaseous volatile organic compounds catalyzed by Au supported layered double hydroxides: Influencing factors, kinetics and mechanism, J. Hazard. Mater., 2018, 363, 41–54 CrossRef PubMed.
- M. J. Suh, Y. Shen and C. K. Chan, et al., Titanium dioxide-layered double hydroxide composite material for adsorption-photocatalysis of water pollutants, Langmuir, 2019, 35(26), 8699–8708 CrossRef CAS PubMed.
- P. W. Cai, S. Q. Ci and N. Wu, et al., Layered structured CoAl/CdS-LDHs nanocomposites as visible light photocatalyst, Phys. Status Solidi A, 2017, 214(6), 1600910 CrossRef.
- S. Z. Wu, N. Li and W. D. Zhang, Attachment of ZnO nanoparticles onto layered double hydroxides microspheres for high performance photocatalysis, J. Porous Mater., 2014, 21(2), 157–164 CrossRef CAS.
- J. Fragoso, A. Pastor and M. Cruz-Yusta, et al., Graphene quantum dots/NiTi layered double hydroxide heterojunction as a highly efficient De-NOx photocatalyst with long persistent post-illumination action, Appl. Catal., B, 2023, 322, 122115 CrossRef CAS.
- J. Zhao, Y. Lu and D. Wu, et al., Regulating divalent metal species in aluminum-based layered double hydroxides to selectively promote photocatalytic CO production from CO2, Sep. Purif. Technol., 2023, 305, 122508 CrossRef CAS.
- L. Deng, H. X. Zeng and S. Zhou, et al., Sodium dodecyl sulfate intercalated and acrylamide anchored layered double hydroxides: A multifunctional adsorbent for highly efficient removal of Congo red, J. Colloid Interface Sci., 2018, 521, 172–182 CrossRef CAS PubMed.
- P. P. Huang, J. Liu and F. Wei, et al., Size-selective adsorption of anionic dyes induced by the layer space in layered double hydroxide hollow microspheres, Mater. Chem. Front., 2017, 1(8), 1550–1555 RSC.
- L. Y. Zhang, Y. L. Han and J. J. Yang, et al., Construction and photocatalysis of carbon quantum dots/layered mesoporous titanium dioxide (CQDs/LM-TiO2) composites, Appl. Surf. Sci., 2021, 546, 149089 CrossRef CAS.
- L. Y. Zhang, J. J. Yang and Y. L. Han, et al., Novel adsorption-photocatalysis integrated bismuth tungstate modified layered mesoporous titanium dioxide (Bi2WO6/LM-TiO2) composites, Opt. Mater., 2022, 130, 112581 CrossRef CAS.
- G. H. Xia, Y. M. Zheng and Z. Y. Sun, et al., Fabrication of ZnAl-LDH mixed metal-oxide composites for photocatalytic degradation of 4-chlorophenol, Environ. Sci. Pollut. Res., 2022, 29, 39441–39450 CrossRef CAS PubMed.
- J. You, L. Y. Zhang and L. Y. He, et al., Photocatalytic degradation of methyl orange on ZnO–TiO2/SO42− heterojunction composites, Opt. Mater., 2022, 131, 112737 CrossRef CAS.
- S. Kim, P. Durand and E. André, et al., Enhanced photocatalytic ability of Cu, Co doped ZnAl based mixed metal oxides derived from layered double hydroxides, Colloids Surf., A, 2017, 524, 43–52 CrossRef CAS.
- L. H. Shao, S. Cheng and Z. F. Yang, et al., Nickel aluminum layered double hydroxide nanosheets grown on oxygen vacancy-rich TiO2 nanobelts for enhanced photodegradation of an antibiotic, J. Photochem. Photobiol., A, 2021, 411, 113209 CrossRef CAS.
- Y. Wei, G. Cheng and J. Y. Xiong, et al., Positive Ni(HCO3)2 as a novel cocatalyst for boosting the photocatalytic hydrogen evolution capability of mesoporous TiO2 nanocrystals, ACS Sustainable Chem. Eng., 2017, 5, 5027–5038 CrossRef CAS.
- R. J. Lu, X. Xu and J. P. Chang, et al., Improvement of photocatalytic activity of TiO2 nanoparticles on selectively reconstructed layered double hydroxide, Appl. Catal., B, 2012, 111, 389–396 CrossRef.
- S. J. Santosa, E. S. Kunarti and Karmanto, Synthesis and utilization of Mg/Al hydrotalcite for removing dissolved humic acid, Appl. Surf. Sci., 2008, 254(23), 7612–7617 CrossRef CAS.
- V. Kumar, O. M. Ntwaeaborwa and J. Holsa, et al., The role of oxygen and titanium related defects on the emission of TiO2: Tb3+ nanophosphor for blue lighting applications, Opt. Mater., 2015, 46, 510–516 CrossRef CAS.
- J. Wang, D. N. Tafen and J. P. Lewis, et al., Origin of photocatalytic activity of nitrogen-doped TiO2 nanobelts, J. Am. Chem. Soc., 2009, 131(34), 12290–12297 CrossRef CAS PubMed.
- B. Erdem, R. A. Hunsicker and G. W. Simmons, et al., XPS and FTIR surface characterization of TiO2 particles used in polymer encapsulation, Langmuir, 2001, 17(9), 2664–2669 CrossRef CAS.
- Y. M. Ni, L. H. Yao and Y. Wang, et al., Construction of hierarchically porous graphitized carbon-supported NiFe layered double hydroxides with a core-shell structure as an enhanced electrocatalyst for the oxygen evolution reaction, Nanoscale, 2017, 9(32), 11596–11604 RSC.
- C. Hao, L. F. Hu and M. Chen, et al., Nickel-cobalt layered double hydroxide nanosheets for high-performance supercapacitor electrode materials, Adv. Funct. Mater., 2014, 24(7), 934–942 CrossRef.
- K. J. Tsai, C. S. Ni and H. Y. Chen, et al., Single-walled carbon nanotubes/Ni-Co-Mn layered double hydroxide nanohybrids as electrode materials for high-performance hybrid energy storage devices, J. Power Sources, 2020, 454, 227912 CrossRef CAS.
- L. Y. Wang, X. Gao and Y. Q. Cheng, et al., TiO2@MgAl-layered double hydroxide with enhanced photocatalytic activity towards degradation of gaseous toluene, J. Photochem. Photobiol., A, 2019, 369, 44–53 CrossRef CAS.
- G. T. Zhang, J. Z. Zhang and J. B. Zeng, et al., Improved structural stability and adsorption capacity of adsorbent material Li1.6Mn1.6O4 via facile surface fluorination, Colloids Surf., A, 2021, 629, 127465 CrossRef CAS.
- L. Y. Zhang, J. You and Q. W. Li, et al., Preparation and Photocatalytic Properties of CdS/F-TiO2 Composites, Coatings, 2019, 9(12), 824 CrossRef CAS.
| This journal is © The Royal Society of Chemistry 2023 |

