 Open Access Article
Unraveling the photophysical characteristics and biological applications of vinyl sulfones as viscosity sensors†
Onnicha Khaikatea,
Thitima Pewklanga,
Tunyawat Khrootkaewa,
Kantapat Chansaenpak b,
Prapassara Muangsopaa,
Chutima Kuhakarn
 c and
Anyanee Kamkaew
 *a
*a
aSchool of Chemistry, Institute of Science, Suranaree University of Technology, Nakhon Ratchasima 30000, Thailand. E-mail: anyanee@sut.ac.th
bNational Nanotechnology Center, National Science and Technology Development Agency, Thailand Science Park, Pathum Thani 12120, Thailand
cDepartment of Chemistry and Center of Excellence for Innovation in Chemistry (PERCH-CIC), Faculty of Science, Mahidol University, Rama 6 Road, Bangkok 10400, Thailand
First published on 2nd June 2023
Abstract
For the first time, a series of vinyl sulfone-NH2-based push–pull fluorophores (4a–4d) were introduced for their potential use in biological applications. The fluorophores 4a–4d were readily synthesized upon reduction of the corresponding vinyl sulfones-NO2 (3a–3d), which were prepared by sulfonylation of nitrostyrene. Both types of probes can be prepared in high yields through a few steps with minimal cost. In diverse solvents, probes 4a–4d exhibited fluorescence with strong emission peaking around 403–490 nm. Additionally, the fluorescence intensity of probe 4d rose approximately 85-fold with increasing viscosity. The probes 4a–4d demonstrated good stability and photostability in a broad pH range. Moreover, probes 4a–4d showed significantly improved biocompatibility compared to those derived from 3a–3d. For cell imaging applications, the developed probes 4a–4d exhibited much stronger blue fluorescence in cancer cells (HepG2) compared to 3a–3d. In addition, probes 4a–4d exhibited low cytotoxicity within 24 h toward both cancer and normal cells (HEK-293). Interestingly, probe 4d showed great sensitivity to viscosity in cancer cells. As a result, readily prepared vinyl sulfone-NH2-based push–pull fluorophores (4a–4d) offer a promising strategy for further development as cancer cell staining agents.
Introduction
Vinyl sulfone scaffolds are useful synthetic targets1 and display crucial roles in natural products and drug discovery.2,3 They can be found in numerous lead compounds and drug candidates such as rigosertib (anticancer), recilisib (radioprotective), and k11777 (antiparasitic).4 For the usefulness of vinyl sulfones, they also have intriguing chemical characteristics and serve as helpful intermediates for the production of structurally complex organic compounds.5,6 As a consequence, a number of studies from many research groups were devoted to the development of novel and convenient synthetic approaches to access vinyl sulfone scaffolds.7,8 Although the vinyl sulfone skeleton has been extensively explored from both the synthetic and biological points of view, to our knowledge, their photophysical and photochemical characteristics with regard to biological applications have not been thoroughly investigated.Small molecule-based fluorescent probes are intriguing because of their explicit and simple synthesis, facile purification, and high fluorescence quantum yield.9–11 Among the small π-conjugated molecular family, push–pull fluorophores are the best candidate for developing effective fluorescent chemosensors. Organic push–pull fluorophores are a category of π-conjugated molecules containing electron-donating (EDGs) and electron-withdrawing groups (EWGs). The push–pull system enables immediate interaction between the EDGs and EWGs via the π-system which can be called intramolecular charge transfer (ICT). In this regard, we and others developed small molecule-based fluorescent probes for biological applications such as cellular imaging and microorganism targeting.12–14
As a part of our continuing endeavour to develop fluorescent probes, we hypothesized that modification of the small molecule vinyl sulfones would affect its photophysical characteristics. Due to the lack of conclusive study on the photophysical and imaging features of vinyl sulfone, we present here the chemical reduction of non-fluorescent probes, vinyl sulfone-NO2 (3), to fluorescent probes, vinyl sulfone-NH2 (4). Following that, their photophysical characteristics and biological applications are investigated. Normally, variations in viscosity are detected during tumour development. Therefore, many viscosity probes were reported to monitor viscosity at the cellular level.15–18 From this point, fluorescent probes 4 are being explored for their capacity to detect changes in the microenvironment of cancer cells. We anticipate that in low-viscous fluids, the C–C bond of probe 4 will rotate freely, resulting in a non-radiative process of the excited state that would quench the fluorescence. Since rotation is restricted in a high-viscous environment, the fluorescence of the probe is projected to increase15 (Scheme 1).
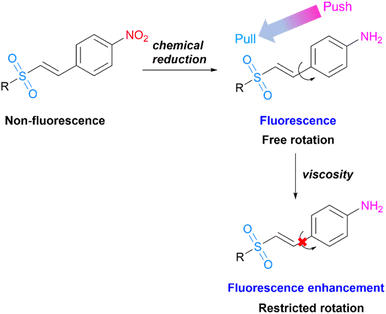 | ||
| Scheme 1 Structural design of vinyl sulfone fluorescent probes and proposed mechanism for viscosity response. | ||
Results and discussion
Synthetic procedures
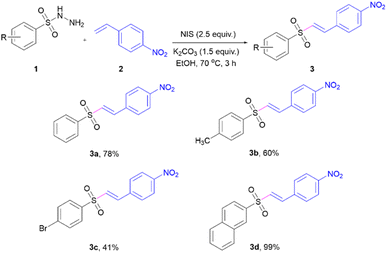
Vinyl sulfone-NO2 probes (3a–3d) were designed to allow their synthesis from various sulfonyl hydrazides (1) and 4-nitrostyrene (2). Substrates 1 with electronically different substituents on the phenyl ring, including p-methyl, p-bromo, and naphthalene-2-sulfonyl hydrazide (1d) were selected for evaluation of their effects on the photophysical properties. Moreover, styrene-bearing nitro moiety at the para position was chosen as a coupling part because it will be employed as a molecular design for the reduction in the next step. The vinyl sulfones-NO2 (3a–3d) were synthesised via sulfonylation of 4-nitrostyrene (2) (Scheme 2), according to a previously reported methodology.19 The reaction between substrates 1 and 2 provided the corresponding products 3a–3d in moderate to excellent yields. All products were characterized by 1H-NMR and 13C-NMR (see the ESI† for details).Photophysical properties of vinyl sulfones-NO2 (3a–3d)
The photophysical properties of vinyl sulfones-NO2 (3a–3d) were measured in different solvents including toluene, chloroform, tetrahydrofuran (THF), dichloromethane (DCM), dimethyl sulfoxide (DMSO), N,N-dimethylformamide (DMF), acetone, acetonitrile (MeCN), methanol (MeOH), DI water and 10 mM PBS buffer (pH 7.4). Compounds 3a–3d exhibited the maximum absorbance at a wavelength ranging from 258 to 332 nm in all tested solvents (Table S1 and Fig. S2†). However, as shown in Fig. S3,† only the weak fluorescence emission of the four probes was observed. Nitroaromatic compounds are typically non-fluorescence as their photo mechanism involves fast or ultrafast non-radiative deactivation of the electronically excited singlet states, increasing intersystem crossing to triplet excited states.20 Therefore, we envisioned that the electronic properties of 3a–3d would alter after the nitro group was reduced, resulting in a push–pull effect in the structures that would produce light.Chemical reduction of nitro groups to amines
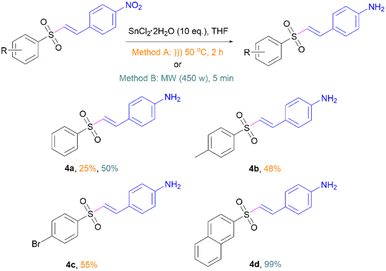
To improve the photophysical properties via electron push–pull effects of vinyl sulfones-NO2 (3a–3d), the nitro group was chemically reduced to amines via in situ hydrogen gas generation catalysed by SnCl2 under sonication or microwave (Scheme 3). This reaction produced the corresponding vinyl sulfones-NH2 (4a–4d) in moderate to excellent yields. All products were analysed by 1H-NMR, 13C-NMR, and HRMS (see the ESI† for details). In our probe design, 4a–4d have electron push–pull effects between the amino and sulfone groups. In this work, only amino moiety located at the para position on substrates was investigated since it exhibited the highest donor ability through resonance effect compared to the other positions.21Photophysical properties of vinyl sulfones-NH2 (4a–4d)
Push–pull chromophores are widely recognized for significantly changing their absorption and emission patterns in solvents with various polarities. Since 4a–4d contain both electron-donating and electron-accepting groups, they possess a typical D–π–A structure. Therefore, we studied their spectral properties in various solutions, and the results are summarized in Table S2.† As shown in Fig. S4,† the absorption spectra of 4a–4d displayed negligible changes in different solvents. In contrast, probes 4a–4d demonstrated fluorescence enhancement peaking around 403–490 nm in different solvents (Fig. S5†). As the solvent polarity increased from toluene to PBS buffer (pH 7.4), the fluorescence emission peaks of both 4a and 4b gradually red-shifted from 403 nm to 452 nm due to the dipole–dipole interaction between solute and solvent,22 showing a stunning bathochromic effect (Fig. 1A and B).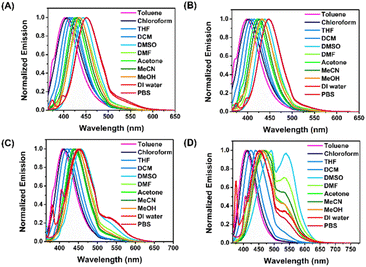 | ||
| Fig. 1 Fluorescent spectra (excited at λmax of each solvent) of (A) 4a, (B) 4b, (C) 4c, and (D) 4d (10 μM) in different solvents. | ||
In the meantime, observation of a broadening of the emission bands in polar solvents and an evident reduction in the fluorescence quantum yield (Φf) indicate a twisted intramolecular charge-transfer (TICT) character for the excited state.23 Obviously, probes 4d exhibited abnormally blue-shifted fluorescence emission peaks in DI water and PBS relative to other high polar solvents (DMSO, DMF, acetone, MeCN, and MeOH) due to molecular aggregation (Fig. 1D).24 In addition, probe 4c in polar solvents, DMSO, DI water, and PBS, showed emission peaks around 455 nm along with shoulder peaks around 504 nm (Fig. 1C). Similarly, probe 4d in DMSO, DMF, acetone, MeCN, MeOH, DI water, and PBS exhibited fluorescence spectra with two emissive peaks. Dual emission might originate from locally excited (LE) and intramolecular charge transfer (ICT) states, which is common for push–pull fluorophores. Their theory was based on the dynamics of excited states, which included local competition between excited states, intersystem crossover to the triplet state, emission from the ICT state, and ultimately deactivation via the non-emissive excited charge-separated state.25,26 Another explanation for the observed behaviors might be related to the derivatives' ability to generate excimers, which is clear in the case of the naphthalene derivative. The molecular excimers are excited dimers that are created when there is a close proximity between two molecules that are interacting, one of which is in an excited state and the other of which is in the ground state. This results in a redistribution of the intensity of the monomer/excimer emission.27,28 It is noteworthy that vinyl sulfones-NH2 4a–4d in all solvents display Stokes shifts between 68 and 127 nm and fluorescence emission wavelengths between 403 and 490 nm. Regarding fluorescent quantum yield (Φf), their emissions exhibit a considerable solvent dependence.
Next, the relationship between the Stokes shift (Δν) and the solvent orientation polarizability (Δf) was investigated using the Lippert–Mataga equation to evaluate the solvatochromism of the 4a–4d.29 The Δν–Δf plots in Fig. S6† reveal that the slopes of the fitting lines for 4a–4d are as large as 5208.2, 4158.4, 5910.8, and 9409.3 respectively. The large slope of the fitting line for 4d suggests that 4d possesses strong solvatochromism.30 This offers strong support for the 4d's ability to serve as appropriate solvent polarity indicators.
Fluorescence response to solvent viscosity
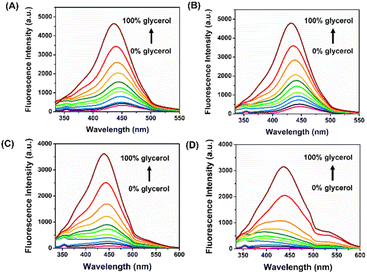
Because fluorescence quenching can occur from rotatable single bonds and excited-state C![[double bond, length as m-dash]](https://www.rsc.org/images/entities/char_e001.gif) C double bonds of 4 in a low-viscosity solvent, this phenomenon results in a nonplanar structure and energy loss via nonradiative pathways. However, because of the restrictions imposed by high-viscosity solvents, excited-state C
C double bonds of 4 in a low-viscosity solvent, this phenomenon results in a nonplanar structure and energy loss via nonradiative pathways. However, because of the restrictions imposed by high-viscosity solvents, excited-state C![[double bond, length as m-dash]](https://www.rsc.org/images/entities/char_e001.gif) C double bonds, and rotatable single bonds in 4 were rigid, resulting in restricted intramolecular rotation (RIR) that increased fluorescence.31 To test the hypothesis, we measured the emission spectra of vinyl sulfones-NH2 (4a–4d) in a system containing water and glycerol. The viscosities of the solutions were raised from pure DI water to pure glycerol by increasing the amount of glycerol in the DI water. From the results shown in Fig. 2A–D, it can be found that 4a–4d exhibited negligible fluorescence in pure DI water. While the emission intensity around 435 nm gradually increases with the increase of solution viscosity. Prominently, the fluorescence intensity was enhanced by ca. 85-fold upon excitation at 315 nm, and the quantum yield changed from 0.0005 to 0.015, which belongs to probe 4d.
C double bonds, and rotatable single bonds in 4 were rigid, resulting in restricted intramolecular rotation (RIR) that increased fluorescence.31 To test the hypothesis, we measured the emission spectra of vinyl sulfones-NH2 (4a–4d) in a system containing water and glycerol. The viscosities of the solutions were raised from pure DI water to pure glycerol by increasing the amount of glycerol in the DI water. From the results shown in Fig. 2A–D, it can be found that 4a–4d exhibited negligible fluorescence in pure DI water. While the emission intensity around 435 nm gradually increases with the increase of solution viscosity. Prominently, the fluorescence intensity was enhanced by ca. 85-fold upon excitation at 315 nm, and the quantum yield changed from 0.0005 to 0.015, which belongs to probe 4d.
pH effects of vinyl sulfones-NH2 (4a–4d) by fluorescence spectroscopic analysis
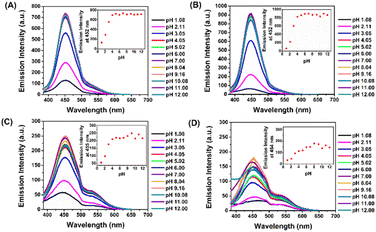
The probes 4a–4d were also examined changes in the optical properties under different pH, owing to its pH-responsive functional group, the amino group. This pH-responsive moiety may undergo protonation, which can lead to changes in its electronic properties and consequent variations in emission intensity. To demonstrate this, the emission responses of 4a–4d were evaluated. As shown in fluorescent spectra (Fig. 3A–D), all four probes exhibited a gradually significant decrease in fluorescence intensity with pH below 3. This phenomenon could be caused by the reduction of electron-donating characteristics, leading to a breakdown of the electron push–pull effect. On the other hand, emission intensity was relatively steady over a wide range from 4 to 12, indicating that D–π–A structure was maintained. Based on these results, it can be concluded that probes 4a–4d preserved their high fluorescence signals over a broad pH range, making them appropriate for cell imaging investigations.Photostability of vinyl sulfones-NH2 (4a–4d)
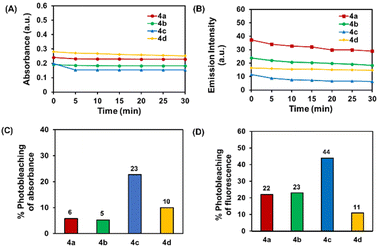
Each probe was dissolved in DMSO and exposed for 30 minutes to a 100 W UV light (365 nm) at room temperature. The maximum absorbance of 4a, 4b, and 4d was reduced by less than 10%, but 4c absorbance was reduced by around 23% (Fig. 4A and C). In addition, there was some drop in fluorescence intensity. Compounds 4a and 4b exhibit comparable photostability, with around 22–23% photobleaching detected. Notably, 4c exhibited the most photobleaching (44%), while 4d is the series' most photostable compound (11% photobleaching) (Fig. 4B and D).Structural determination by DFT calculation
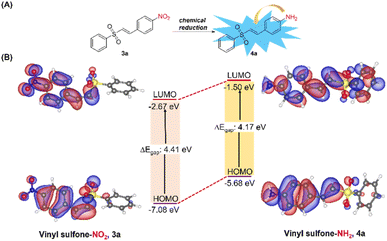
To gain a deeper understanding of the push–pull effect of vinyl sulfones-NH2 (4a–4d), density functional theory (DFT) calculation was conducted using the Turbomole program. Geometric optimization was performed in the gas and water phases at the B3LYP/6-311G level and applied to calculate the frontier molecular orbital (FMO) energy. The FMO model is depicted in Fig. 5. In both the highest occupied molecular orbital (HOMO) and the lowest unoccupied molecular orbital (LUMO), the electronic charge distribution of 3a mainly localized on the 4-nitrobenzene moiety, attributing to the weak electronic coupling between donor and acceptor. Unlike 3a, LUMO orbitals of 4a–4d were delocalized over 4-aminobenzene and sulfone moieties through the π conjugation while the HOMO orbitals were highly localized only on 4-aminobenzene due to the strong electron-donating character of NH2. In addition, smaller HOMO–LUMO energy gaps (4.17 eV) in probe 4a than in probe 3a (4.41 eV) suggested a bathochromic shift in the emission wavelength. The other probes 4b–4d also showed similar profiles as depicted in Fig. S7 and S8.† To summarize, the theoretical calculation results were in good agreement with the experimental data, and the ICT process is crucial in changing the probe's optical properties.Cell viability
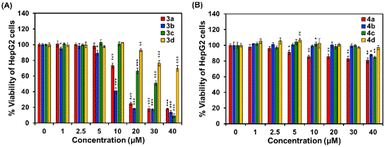
To be useful in biological applications, fluorescence probes must be non-toxic to cells. Thus, an MTT assay was used to assess cytotoxicity against cancer (HepG2) and normal (HEK-293) cells. When HepG2 cells were treated for 24 h with vinyl sulfones-NO2 (3a–3d), the cells maintained more than 85% viability at concentrations up to 5 μM, as shown in Fig. 6A. At the highest concentration (40 μM), cell viability dropped to less than 20%, except for 3d, about 70% viability was still observed at 40 μM. The results showed that 3a–3d were quite toxic to the cells. On the other hand, when the nitro derivatives were reduced to vinyl sulfones-NH2 4a–4d, no significant cytotoxicity was observed at doses up to 40 μM (>80% cells survival, Fig. 6B). For the normal cells, the cytotoxicity patterns were similar. When HEK-293 cells were treated with various concentrations of 3a–3d, the cell viability significantly decreased to about 50% at the concentration of 40 μM (Fig. S9A†). Whereas more than 75% of HEK-293 cells survived upon incubation with 4a–4d (up to 40 μM) for 24 h (Fig. S9B†), indicating that vinyl sulfones-NH2 probes are suitable for cell imaging applications.Confocal imaging
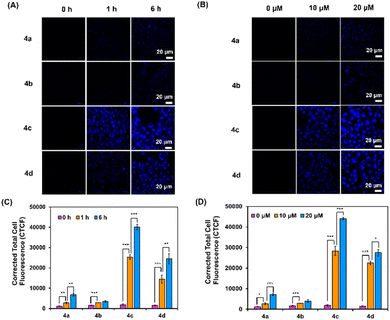
To demonstrate the capability of vinyl sulfones-NO2 (3a–3d) and vinyl sulfones-NH2 (4a–4d) to be cancer cell staining probes, a laser confocal microscope was used for monitoring the fluorescence images. Time-dependent intracellular internalization was firstly examined by incubation of HepG2 cells with 3a–3d and 4a–4d (20 μM) for 0–6 h, followed by imaging. The findings shown in Fig. S10† reveal that even after 6 hours of incubation, there was no fluorescence signal in the HepG2 cells treated with vinyl sulfones-NO2 (3a–3d). In contrast, after 1 h of incubation, vinyl sulfones-NH2 (4a–4d) displayed bright fluorescence in the blue channel, particularly probes 4c and 4d, which had much greater blue fluorescence as seen in Fig. 7A and C.Next, dose-dependent intracellular internalization was also studied for comparison. The cells were treated with 0–20 μM of 3a–3d and 4a–4d, followed by a 6 hours incubation period. When the concentration was raised, compounds 4a–4d showed strong fluorescence (Fig. 7B and D) while compounds 3a–3d showed faint fluorescence at every concentration point (Fig. S11†). On the other hand, no fluorescence was observed from the control cells (HEK-293) after incubation with both 3a–3d and 4a–4d (Fig. S12†). These suggested that, in contrast to normal cells, cancer cells favoured the accumulation of the probes 3a–3d and 4a–4d. Therefore, vinyl sulfones-NH2 (4a–4d) could be used to differentiate between cancerous and healthy cells.
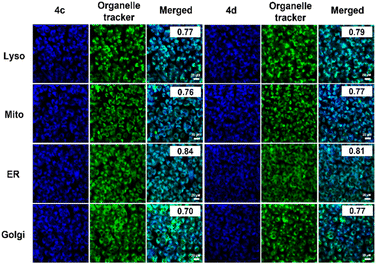
As probes 4c and 4d offered bright fluorescence among the series, the intracellular localization of the probes was investigated. Colocalization experiments were examined with various fluorescent organelle trackers, including LysoTracker (for lysosome), MitoTracker (for mitochondria), ER-Tracker (for endoplasmic reticulum), and C6-NBD Ceramide (for Golgi apparatus), after 6 h exposure to 4c and 4d. As shown in Fig. 8, the blue emission signals from probes colocalized to some degree with LysoTracker, MitoTracker, and Golgi tracker (Pearson's R-value between 0.70–0.79). However, 4c or 4d overlapped more with the green signals from ER-Tracker, with a Pearson's correlation coefficient of 0.84 and 0.81, respectively, exhibiting favourable ER targeting in HepG2.
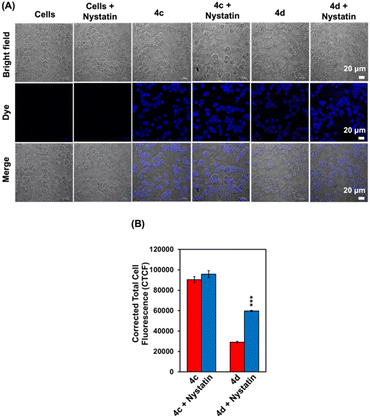
Since the spectroscopic analyses indicated that 4c and 4d exhibited environmental sensitivity behaviours, we further investigated their fluorescence response to changes in viscosity in cancer cells. To test whether probes 4c and 4d could identify changes in viscosity using fluorescence imaging, nystatin was used as an ionophore that could disrupt the ionic equilibrium and increase the viscosity.32–34 Interestingly, compared to untreated cells, intracellular fluorescence enhanced about 2-fold after the cells were pre-treated with nystatin followed by 4d for 30 min (Fig. 9), while fewer changes were observed from 4c. This result is consistent with the spectrometric analysis, which suggests the possible use of 4d as a viscosity detection probe in cancer cells.
Conclusions
In summary, we designed and synthesized the vinyl sulfones-NH2 (4a–4d), containing electron-donating and electron-accepting groups, via a simple reduction from the corresponding vinyl sulfones-NO2 (3a–3d) aiming to enhance the fluorescence emission through push–pull effects. The photophysical properties of these designed probes were systematically investigated, in which 4a–4d exhibit fluorescence emission wavelengths between 403 and 490 nm and have Stokes shifts between 68 and 127 nm. Interestingly, among the series, the fluorescence intensity of 4d showed an enhancement of about 85-fold with increased solvent viscosity. In addition, 4a–4d illustrated stability in a wide range of pH, which are suitable for cell imaging applications. Moreover, probes 4a–4d showed low cytotoxicity toward the HepG2 and HEK-293 cells, implying the biocompatibility of the probes. Cells were lightened by 4c and 4d from the first hour, according to time-dependent cellular uptake findings, and the fluorescence increased with extended time. Intriguingly, after 30 min incubation, intracellular fluorescence from 4d increased about 2-fold after the viscosity of the cells increased, whereas 4c showed very little change. Finally, co-localization experiments displayed that probes 4c and 4d were mainly located in the endoplasmic reticulum. With thorough spectroscopic investigations and computational calculations, we proposed that intramolecular charge transfer (ICT) plays a vital role in altering the 4a–4d probes' optical characteristics, in which the intramolecular rotation in high-viscosity solutions is inhibited, resulting in fluorescence enhancement. As a result, this investigation offers a new powerful molecular design for the application of cellular environment change detection that is simply made in a few steps.Author contributions
O. K. synthesized and characterized all compounds. O. K., T. P., and P. M. conceived all the cell assays. T. K. performed DFT calculations. O. K., T. K., and A. K. prepared data visualizations. K. C., C. K., and A. K. validated the results. O. K. and A. K. wrote the first draft manuscript. All authors reviewed the manuscript.Conflicts of interest
There are no conflicts to declare.Acknowledgements
This work was supported by the Research and Development Fund, Suranaree University of Technology (SUT), Grant No. IRD1-102-65-12-22.Notes and references
- G. Pandey, K. N. Tiwari and V. Puranik, Org. Lett., 2008, 10, 3611–3614 CrossRef CAS PubMed.
- F. Hof, A. Schütz, C. Fäh, S. Meyer, D. Bur, J. Liu, D. E. Goldberg and F. Diederich, Angew. Chem., Int. Ed., 2006, 45, 2138–2141 CrossRef CAS PubMed.
- S. Y. Woo, J. H. Kim, M. K. Moon, S.-H. Han, S. K. Yeon, J. W. Choi, B. K. Jang, H. J. Song, Y. G. Kang, J. W. Kim, J. Lee, D. J. Kim, O. Hwang and K. D. Park, J. Med. Chem., 2014, 57, 1473–1487 CrossRef CAS PubMed.
- R. Ahmadi and S. Emami, Eur. J. Med. Chem., 2022, 234, 114255 CrossRef CAS PubMed.
- H. Kumamoto, K. Deguchi, T. Wagata, Y. Furuya, Y. Odanaka, Y. Kitade and H. Tanaka, Tetrahedron, 2009, 65, 8007–8013 CrossRef CAS.
- S. Sulzer-Mossé, A. Alexakis, J. Mareda, G. Bollot, G. Bernardinelli and Y. Filinchuk, Chem.–Eur. J., 2009, 15, 3204–3220 CrossRef PubMed.
- J. Meesin, P. Katrun, V. Reutrakul, M. Pohmakotr, D. Soorukram and C. Kuhakarn, Tetrahedron, 2016, 72, 1440–1446 CrossRef CAS.
- Z. Zhan, H. Ma, D. Wei, J. Pu, Y. Zhang and G. Huang, Tetrahedron Lett., 2018, 59, 1446–1450 CrossRef CAS.
- S. Shanmugaraju and P. S. Mukherjee, Chem. Commun., 2015, 51, 16014–16032 RSC.
- E. V. Verbitskiy, G. L. Rusinov, O. N. Chupakhin and V. N. Charushin, Dyes Pigm., 2020, 180, 108414 CrossRef CAS.
- R. F. Fatykhov, A. D. Sharapov, E. S. Starnovskaya, Y. K. Shtaitz, M. I. Savchuk, D. S. Kopchuk, I. L. Nikonov, G. V. Zyryanov, I. A. Khalymbadzha and O. N. Chupakhin, Spectrochim. Acta, Part A, 2022, 267, 120499 CrossRef CAS PubMed.
- S. Wangngae, K. Chansaenpak, J. Nootem, U. Ngivprom, S. Aryamueang, R.-Y. Lai and A. Kamkaew, Molecules, 2021, 26, 2979 CrossRef CAS PubMed.
- J. Chan, S. C. Dodani and C. J. Chang, Nat. Chem., 2012, 4, 973–984 CrossRef CAS PubMed.
- Y.-F. Wei, Y. Wang, X.-R. Wei, R. Sun, Y.-J. Xu and J.-F. Ge, Spectrochim. Acta, Part A, 2020, 229, 117865 CrossRef CAS PubMed.
- P. Ning, P. Dong, Q. Geng, L. Bai, Y. Ding, X. Tian, R. Shao, L. Li and X. Meng, J. Mater. Chem. B, 2017, 5, 2743–2749 RSC.
- L. Chen, Y. Feng, Y. Dang, C. Zhong and D. Chen, Anal. Bioanal. Chem., 2020, 412, 7819–7826 CrossRef CAS PubMed.
- M. Ren, Q. Xu, S. Wang, L. Liu and F. Kong, Chem. Commun., 2020, 56, 13351–13354 RSC.
- D. Su, C. Teoh, N. Gao, Q.-H. Xu and Y.-T. Chang, Sensors, 2016, 16, 1397 CrossRef PubMed.
- M. Pramanik, K. Choudhuri and P. Mal, Asian J. Org. Chem., 2019, 8, 144–150 CrossRef CAS.
- Y. M. Poronik, B. Sadowski, K. Szychta, F. H. Quina, V. I. Vullev and D. T. Gryko, J. Mater. Chem. C, 2022, 10, 2870–2904 RSC.
- S. Wangngae, T. Pewklang, K. Chansaenpak, P. Ganta, S. Worakaensai, K. Siwawannapong, S. Kluaiphanngam, N. Nantapong, R.-Y. Lai and A. Kamkaew, New J. Chem., 2021, 45, 11566–11573 RSC.
- P. Xue, B. Yao, J. Sun, Q. Xu, P. Chen, Z. Zhang and R. Lu, J. Mater. Chem. C, 2014, 2, 3942–3950 RSC.
- J.-S. Yang, K.-L. Liau, C.-M. Wang and C.-Y. Hwang, J. Am. Chem. Soc., 2004, 126, 12325–12335 CrossRef CAS PubMed.
- P. Hiranmartsuwan, X. Ma, J. Nootem, R. Daengngern, A. Kamkaew, P. Pinyou, W. Wattanathana, V. Promarak, Z. Li and K. Chansaenpak, Mater. Today Chem., 2022, 26, 101121 CrossRef CAS.
- M. M. Khaled, M. A. Ismail, H. A. A. Medien, A. A. Abdel-Shafi and H. S. Abdel-Samad, Spectrochim. Acta, Part A, 2023, 288, 122090 CrossRef CAS PubMed.
- E. Benassi, B. Carlotti, M. Segado, A. Cesaretti, A. Spalletti, F. Elisei and V. Barone, J. Phys. Chem. B, 2015, 119, 6035–6040 CrossRef CAS PubMed.
- M. Pabst, B. Lunkenheimer and A. Köhn, J. Phys. Chem. C, 2011, 115, 8335–8344 CrossRef CAS.
- A. S. Belova, Y. N. Kononevich, V. A. Sazhnikov, A. A. Safonov, D. S. Ionov, A. A. Anisimov, O. I. Shchegolikhina, M. V. Alfimov and A. M. Muzafarov, Tetrahedron, 2021, 93, 132287 CrossRef CAS.
- N. Mataga, Y. Kaifu and M. Koizumi, Bull. Chem. Soc. Jpn., 1956, 29, 465–470 CrossRef CAS.
- J. Nootem, C. Sattayanon, S. Namuangruk, P. Rashatasakhon, W. Wattanathana, G. Tumcharern and K. Chansaenpak, Dyes Pigm., 2020, 181, 108554 CrossRef CAS.
- J. Liu, W. Zhang, C. Zhou, M. Li, X. Wang, W. Zhang, Z. Liu, L. Wu, T. D. James, P. Li and B. Tang, J. Am. Chem. Soc., 2022, 144, 13586–13599 CrossRef CAS PubMed.
- Z. Yang, Y. He, J.-H. Lee, N. Park, M. Suh, W.-S. Chae, J. Cao, X. Peng, H. Jung, C. Kang and J. S. Kim, J. Am. Chem. Soc., 2013, 135, 9181–9185 CrossRef CAS PubMed.
- O. HURŇÁK and J. Zachar, Gen. Physiol. Biophys., 1995, 14, 359–366 Search PubMed.
- M. J. Hansson, S. Morota, M. Teilum, G. Mattiasson, H. Uchino and E. Elmér, J. Biol. Chem., 2010, 285, 741–750 CrossRef CAS PubMed.
Footnote |
| † Electronic supplementary information (ESI) available: Materials and methods, syntheses and characterisations of all compounds, solvatochromism study, DFT calculations, cytotoxicity assays, and confocal experiments. See DOI: https://doi.org/10.1039/d3ra02354k |
| This journal is © The Royal Society of Chemistry 2023 |

