 Open Access Article
Experimental study and simulation of the reaction mechanism of Al–PTFE mechanically activated energetic composites
Jun Tao * and
Xiaofeng Wang
The Second Department, Xi'an Modern Chemistry Research Institute, Xi'an 710065, China. E-mail: taojun4712230@126.com
First published on 10th July 2023
Abstract
In order to explore the mechanism of reaction involving Al-polytetrafluoroethylene (PTFE) mechanically activated energetic composites, a molecular dynamics simulation was carried out to predict the pyrolysis of PTFE. Then, density functional theory (DFT) was applied to calculate the mechanism of reaction between the products of PTFE pyrolysis and Al. Furthermore, the pressure and temperature obtained during the reaction of Al–PTFE were tested to study the chemical structure before and after heating. Finally, the laser-induced breakdown spectroscopy experiment was performed. According to the experimental results, the main pyrolysis products of PTFE include F, CF, CF2, CF3 and C. The path of the CF3 + Al → CF2 + AlF reaction is the easiest to achieve. AlF3, Al and Al2O3 are the main components of the pyrolysis products of PTFE with Al. Compared with Al–PTFE, the ignition temperature required by the Al–PTFE mechanically activated energetic composite is lower and its combustion reaction is faster.
1 Introduction
Compared with the traditional single substance energetic materials, composite energetic materials usually have higher energy density, lower reaction rate and lower energy release rate.1–3 Amongst the variety of composite energetic materials with good safety performance and high energy density, aluminum (Al) based energetic materials have been widely used in propellants, explosives and other settings.4 Micron or nano particles provide a common means for Al combustion and utilization. However, due to the tendency of oxidation, it is inevitable for a dense Al2O3 film to develop on the surface of Al particles, which adversely affects the long-term storage of Al based energetic materials. At the same time, a higher ignition temperature is required to melt the Al2O3 shell when Al is burned.5 Up to now, it remains unclear whether the fracture of the Al2O3 shell is caused by Al core melting or polycrystalline phase transformation.4Fluoropolymer is a commonly used coating agent, while polytetrafluoroethylene (PTFE) is often used as the composite with other materials to effectively improve the combustion performance.6 The composite of PTFE and Al is applicable to prevent the further oxidation of Al–Al2O3 spheres and ensure the active Al content of the material,7 which improves the storage performance of Al-based energetic materials. In the process of ignition, the hydroxyl groups on the surface of PTFE and Al2O3 shell undergoes pre-ignition reaction (PIR), which makes Al2O3 shell prone to cracking, thus reducing the ignition energy of Al–PTFE and enhancing the activity of the reaction system.8 In addition, PTFE can react with Al, and the bond energy of Al–F is higher than that of Al–O. Therefore, Al–PTFE is characterized by high calorific value and high reaction heat. Specifically, the specific energy per unit mass/volume of Al–PTFE exceeds twice that of TNT, despite its poor performance in strength, density and insensitivity.
The content, particle size and morphology of Al tend to have a significant impact on Al-based composite energetic materials in terms of energy release. In the experiment conducted by Li et al.,9 Al–PTFE owning about 60% Al in mass fraction release a large amount of heat during reaction process. In general, it is considered that a smaller particle size of Al leads to a faster pace of combustion reaction.10 However, there are also some studies indicating that the reaction activity of nano Al can be reduced by the relatively low content of active Al or particle agglomeration.11 By changing spherical Al particles into flake Al particles, the decomposition temperature of Al based mixture can be effectively reduced and the decomposition rate can be improved.12 In regard to the characteristics of macroscopic detonation, the particle size of Al makes a huge difference to the velocity and pressure of detonation as well as other parameters of Al based explosives,13 thus affecting the threshold of material impact reaction.14 It is expected that the combustion performance of Al matrix composite energetic materials can be further improved by mixing and optimizing coarse and fine Al particles.15 Therefore, the research on the reaction process of Al based energetic materials plays a significant role in promoting the synthesis of energetic materials.
In recent years, Russia and the United States have began to rely on mechanical activation (usually the equivalent of the reaction inhibition ball milling method16–19) to increase the interface contact between Al and PTFE reactants, reduce the distance of diffusion, as well as improve the rate of energy release and conversion. With regard to the reactivity of metal–PTFE mechanically activated energetic composites, Koch EC monitored the reaction of metal/fluoropolymer composites through17 infrared spectroscopy, and then analyzed the reaction of Mg–PTFE composites. D. D. Dlott et al.20–23 explored the reaction threshold and energy release mechanism of nano-Al–PTFE and B/PTFE composites initiated by laser flash heating through transient spectroscopy, and detected the transient intermediate products obtained through the reaction. Tao J. et al. researched the characteristics of concentrated ignition and reaction process of Al–PTFE composites.24 In spite of this, there remains a lack of systematic research on the reaction mechanism of Al–PTFE mechanically activated energetic composites, especially the dynamic decomposition process of PTFE and its reaction mechanism with Al under anaerobic/aerobic conditions.
In the present study, the reaction mechanism of Al–PTFE mechanically activated energetic composites is systematically investigated from different perspectives such as the cracking of PTFE, the reactivity of Al–PTFE composites, the reaction activation energy of Al–PTFE composites, the gas generation in the reaction of Al–PTFE composites, and the laser-induced breakdown spectroscopy of Al–PTFE composites. The correlation between the decomposition products of PTFE and their distribution with time was obtained, and the reaction mechanism between PTFE decomposition products and Al under aerobic/anaerobic condition was analyzed. This work can effectively guide the formulation design of explosives containing Al–PTFE composites, and gain a deeper understanding of the reaction path and energy release mechanism of Al–PTFE composites.
2 Experiment and computation
2.1 Computational method
2.2 Experiment
Commercially available aluminum powder and PTFE powder were taken as the raw materials. Al and PTFE were mixed and then added into the high-energy mill at a ratio of 60![[thin space (1/6-em)]](https://www.rsc.org/images/entities/char_2009.gif) :
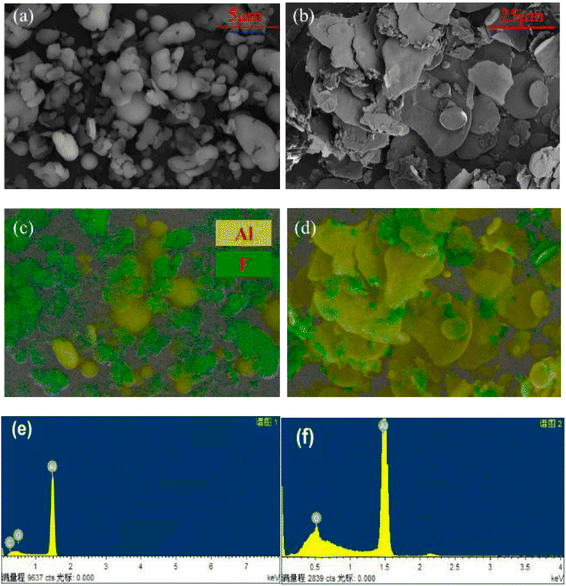
:![[thin space (1/6-em)]](https://www.rsc.org/images/entities/char_2009.gif) 40. Then 20 mL of n-hexane was added. The ball and tank body are both made of stainless steel. There are two 8 mm stainless steel balls and two 4 mm stainless steel balls in the ball tank. The ball mill is milled for 2 minutes and interrupted for 1 minute for cooling to prevent excessive temperature. The time of high-energy ball milling was set to 1 h, as the Al–PTFE particles are relatively complete, tightly contacted, and the surface is smooth after 1 hour ball milling. After filtration, the milled samples were dried in 313 K oven for later use. The morphology of Al–PTFE composites before and after balling are shown in Fig. 3. Al–PTFE composites before ball milling (S–Al–PTFE) is a physical mixture of spherical Al powder and PTFE powder. Al–PTFE mechanically activated energetic composites (F–Al–PTFE) is a sheet-like composite. The properties of two composites are shown in Table 1, and the impact and friction sensitivity were tested according to GJB772A (1997) method.
40. Then 20 mL of n-hexane was added. The ball and tank body are both made of stainless steel. There are two 8 mm stainless steel balls and two 4 mm stainless steel balls in the ball tank. The ball mill is milled for 2 minutes and interrupted for 1 minute for cooling to prevent excessive temperature. The time of high-energy ball milling was set to 1 h, as the Al–PTFE particles are relatively complete, tightly contacted, and the surface is smooth after 1 hour ball milling. After filtration, the milled samples were dried in 313 K oven for later use. The morphology of Al–PTFE composites before and after balling are shown in Fig. 3. Al–PTFE composites before ball milling (S–Al–PTFE) is a physical mixture of spherical Al powder and PTFE powder. Al–PTFE mechanically activated energetic composites (F–Al–PTFE) is a sheet-like composite. The properties of two composites are shown in Table 1, and the impact and friction sensitivity were tested according to GJB772A (1997) method.
| Sample | Ball milling (min) | Theory density (g cm−3) | Heat of combustion (J g−1) | Impact sensitivity (%) | Friction sensitivity (%) |
|---|---|---|---|---|---|
| S–Al–PTFE | 0 | 2.47 | 23![[thin space (1/6-em)]](https://www.rsc.org/images/entities/char_2009.gif) 424.8 424.8 |
12 | 20 |
| F–Al–PTFE | 60 | 2.47 | 23![[thin space (1/6-em)]](https://www.rsc.org/images/entities/char_2009.gif) 424.8 424.8 |
8 | 12 |
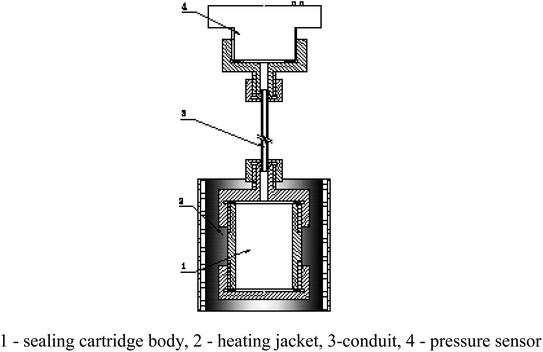
According to the reaction analysis of Al–PTFE composite materials, a 10 g level mechanical activated metal material reaction performance test system was established. The test device consists of a small sealed projectile and its matching heating sleeve. The structure of the test device is shown in Fig. 4. The melting point of aluminum is 660 °C, and the combustion of ordinary aluminum powder occurs when the temperature approaches its melting point. Therefore, the system developed in this study can be used for the temperature to reach a maximum of 700 °C in a controlled manner. In order to prevent the instability of high temperature control and line overloading caused by continuous high power, the final heating mode is supposed to be 2 °C min−1 below 400 °C and 1 °C min−1 above 400 °C.
In the course of laser propagation, energy loss results mainly from the quartz glass and the reflector in the attenuator. The average power density of the laser focus was determined through the following formulas:
| P = 4Eabs/(πd2f) | (1) |
| df = 4fλLM2/(πdb) | (2) |
| M2 = 0.25diθπ/λL | (3) |
| Eabs = ETλL(1 − RλL) | (4) |
3 Results and discussion
3.1 Analysis of PTFE pyrolysis products
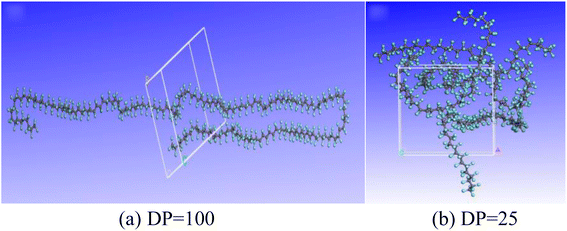
The pyrolysis products of PTFE with a polymerization degree of 100 at different temperatures were calculated, as shown in Fig. 6. It can be found out from the figure that the foremost pyrolysis products of PTFE with a polymerization degree of 100 at 2000 K include F, CF2, C, CF3, CF4 and F2, with the number of products in the order as follows: F > CF2 > C > CF3 > CF4 > F2. It is also found out that the main pyrolysis products of PTFE with a degree of polymerization of 100 at 3000 K include F, CF, CF2, C, F2 and CF3. The number of these products is in the order as follows: F > CF > CF2 > C > F2 > CF3. By comparing the effect of temperature on pyrolysis products, it can be discovered that temperature rise can significantly increase the content of F free radicals in cracking products, and that the amount of F free radicals rises from about 90 to 130, which leads to an increase in the proportion of CF free radicals in pyrolysis products.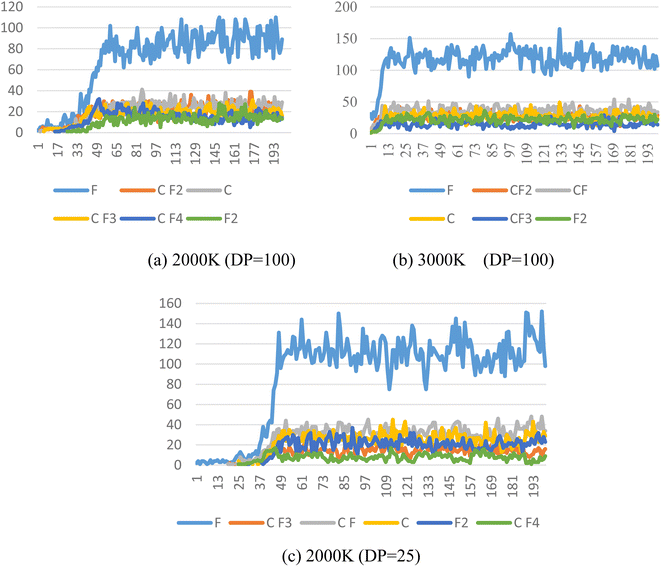 | ||
| Fig. 6 Main pyrolysis products of PTFE at different temperatures. (a) PTFE with DP of 100 at 2000 K; (b) PTFE with DP of 100 at 3000 K; (c) PTFE with DP of 25 at 2000 K. | ||
At 2000 K, the foremost pyrolysis products of PTFE with a 25 degree of polymerization include F, CF, C, F2, CF3 and CF4. Compared with the PTFE with a 100 degree of polymerization, the reduction in degree of polymerization can increase the content of F free radicals in the pyrolysis products to a significant extent, with the amount of F free radicals rising from about 90 to 120, which also causes an increase in the proportion of CF free radicals in the pyrolysis products.
In general, the foremost PTFE pyrolysis products include CF, CF2, CF3 and F, etc. Both the increase of temperature and the reduction of polymerization degree are conducive to enhancing the decomposition of PTFE cracking products, which leads to a sharp rise in the content of F and CF free radicals in the products.
3.2 Reaction mechanism of PTFE pyrolysis products with Al
In order to better understand the mechanism of reaction between PTFE decomposition products and Al, the main reaction pathways of PTFE decomposition products and Al under oxygen-free conditions were calculated, as shown in Fig. 7. Fig. 7a shows the reaction path of CF3 + Al → CF2 + AlF, Fig. 7b shows the reaction path of CF2 + Al → CF + AlF, and Fig. 6c shows the reaction path of CF + Al → C + AlF. The difficulty of chemical reaction are determined by the energy barrier of the reaction. By comparing Fig. 7a–c, it can be found out that the reaction energy barrier of CF3 + Al → CF2 + AlF is the smallest (only 2.39 kJ mol−1), followed by CF2 + Al → CF + AlF (9.29 kJ mol−1) and CF + Al → C + AlF (9.29 kJ mol−1). Therefore, the reaction path of CF3 + Al → CF2 + AlF is the easiest to achieve, followed by the sum reaction path of CF2 + Al → CF + AlF and CF + Al → C + AlF.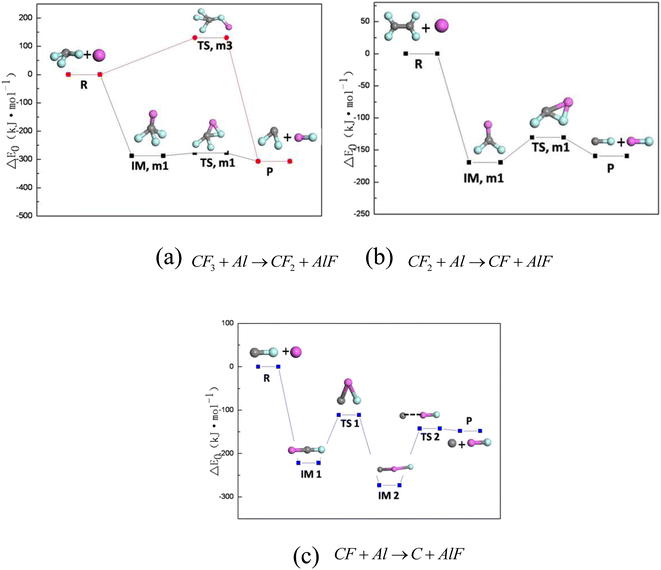 | ||
| Fig. 7 Main reaction pathways of PTFE decomposition products and Al under oxygen-free conditions. (a) CF3 + Al → CF2 + AlF; (b) CF2 + Al → CF + AlF; (c) CF + Al → C + AlF. | ||
3.3 Experimental study on heating reaction process of Al–PTFE mechanically activated energetic composites
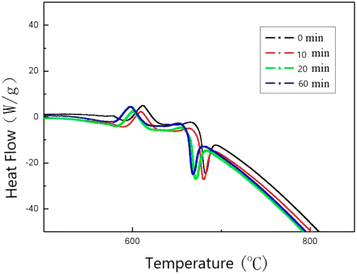
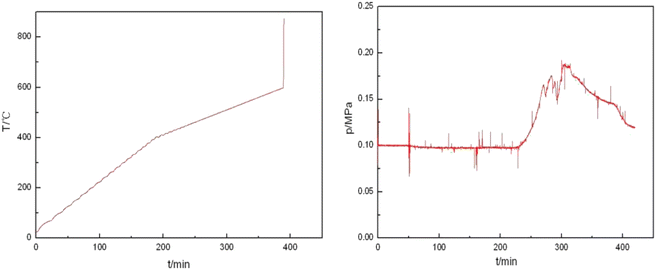
In order to investigate the effect of milligrams on the reactivity of Al–PTFE mechanically activated energetic materials, the thermal properties of Al–PTFE mechanically activated energetic materials with different ball milling times were tested using DSC. The heat flow curve is shown in Fig. 7. From the graph, it can be seen that there are three endothermic peaks on the heat flow curves of the four samples with different ball milling times: the first peak represents the endothermic melting of PTFE; the second peak represents the endothermic decomposition peak of PTFE; the third peak represents the second decomposition of PTFE. As shown in Fig. 8, high energy ball milling can significantly reduce the critical reaction temperature of Al–PTFE mechanically activated energetic materials and improve their reactivity.A test was conducted on the reaction process of 10 g level Al–PTFE mechanically activated energetic composites, as shown in Fig. 9. After the pressure of Al–PTFE mechanically activated composites begins to rise at about 420 °C, it basically levels off. At about 600 °C, the system pressure declines abruptly at basically the same time as ignition. It is thus inferred that Teflon begins decomposition to produce gaseous products at about 420 °C, which leads to a rise in system pressure. When the temperature reaches about 600 °C, the decomposition products of Teflon and aluminum powder undergo a violent exothermic reaction to produce the final product without gas. In this circumstance, the system pressure ends up showing a downward trend. The ignition of the Al–PTFE composite occurs at 598.5 °C, which is followed by a relatively violent exothermic reaction. Because of the dense oxide layer on the surface of the ordinary aluminum powder, the oxidation reaction occurs only when it is heated to the melting point of the aluminum, which is nearly 660 °C. According to the pressure time history curve, the system pressure of Al–Teflon mechanically activated material starts to rise at a certain point in time before ignition, and it basically levels off after the pressure rises. Finally, the system pressure decreases. According to the comprehensive temperature and pressure time history curve, the system pressure starts to rise at about 420 °C, followed by some fluctuations. At about 600 °C, the system pressure suddenly declines at basically the same time as ignition. Given the properties of aluminum powder and Teflon, as well as the potential reactions between the two substances, it can be inferred that Teflon begins decomposition at about 420 °C to produce gaseous products, thus causing the system pressure to increase. When the temperature reaches about 600 °C, the decomposition products of Teflon undergo a violent exothermic reaction with aluminum powder to produce a final product without gas, with the final system pressure showing a downward trend. Therefore, unlike the common solid–solid MIC systems (such as Al–Ni, Al–CuO, Al–Fe2O3), the reaction of Al–PTFE leads to the generation of gas products. As analyzed previously, these gas products may be the condensation products of those free radicals containing 1 carbon atom, tetrafluoroethylene and a small amount of tetrafluoroethylene. Due to the presence of gas products, there is a significant increase in the contact area, thus improving reactivity. This is the difference between it and other metal–metal oxides.
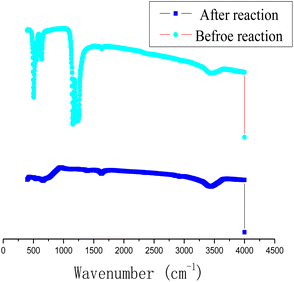
In order to study the chemical composition of the products before and after the reaction of Al with PTFE, the content of surface elements in Al–PTFE composites was determined before and after the reaction, as shown in Fig. 10. The weight percentage of surface elements of Al–PTFE composites before the reaction is C (21.11%), F (65.31%) and Al (13.58%), respectively. The weight percentage of surface elements in the reaction Al–PTFE composites is C (11.32%), O (9.44%), F (22.43%) and Al (56.80%), respectively. According to the analysis, the content of C and F in surface elements shows a sharp decline after reaction, while Al content increases significantly. Also, the chemical structure of the Al–PTFE composite before and after the reaction was examined. From the figure, it can be seen that the chemical structure of the system in the infrared curve is dominated by PTFE before the reaction, and the peak of the system is not easily observable after the reaction. The system is predominantly inorganic. Judging from the previous theoretical calculation, its main components are supposed to be AlF3, Al and Al2O3.
3.4 Laser-induced breakdown spectroscopy of mechanically activated energetic composites
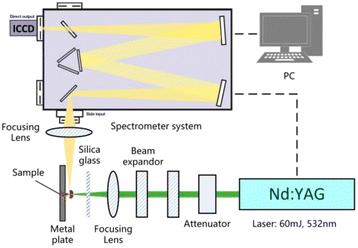
Fig. 11 shows the characteristic spectra of Al powder, S–Al–PTFE and F–Al–PTFE under the laser ablation corrected by background intensity. During measurement, the emission spectra of Al I and Al II were found strong, with the width of ICCD set to 100 ns. The AlO signal is relatively weak, with the gate width of ICCD set to 1000 ns to prevent noise interference. Fig. 11 shows the changes in plasma temperature over time based on the Boltzmann equation and Al I (309 nm and 394 nm) measurement data obtained for three samples. The relevant data can be found in NIST spectral database or the published literature.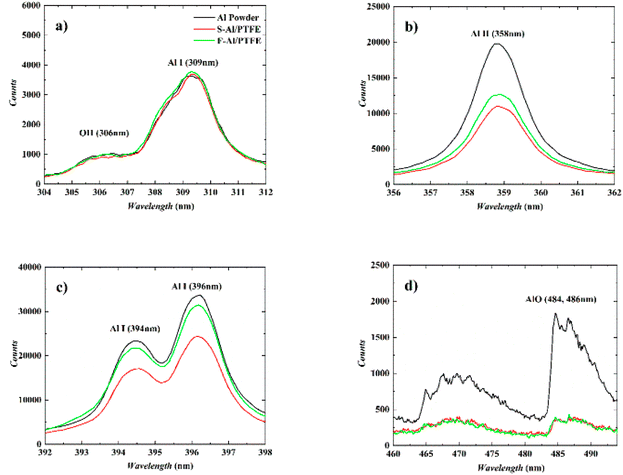 | ||
| Fig. 11 Typical emission spectra of three samples under laser ablation. (a)–(c) Time delay: 1 μs, gate width: 100 ns; (d) time delay: 10 μs, gate width: 1000 ns. | ||
As can be seen from Fig. 11, the emission peak of Al line approaches 309.4 nm, 394.5 nm and 396.2 nm, with some vibration bands of AlO in the range of about 460–494 nm. This vibration band shows several peaks, among which those at 484.4 nm and 486.7 nm are easily observable. The emission spectrum of Al is ascribed to the vaporized active metal Al produced by the oxidation shell rupture on the surface of Al particles generated by laser ablation or a large amount of active Al formed by the fracture of Al–O bond created by the laser direct ablation of Al2O3 shell. As for Al, it can be found out that Al (394 nm, 396 nm) has a relatively high emission intensity, while Al (309 nm) has a low emission intensity. Through a comparison between these three samples, it can be discovered that under the context of different time delays, the emission intensity of Al (309 nm, 394 nm, 396 nm) is in the order as follows: Al powder > F–Al–PTFE > S–Al–PTFE. This is largely attributed to the difference in laser energy absorbed by Al particles. Specifically, the Al particles in Al powder absorb almost all the laser energy irradiated on the sample surface, while the Al particles in F–Al–PTFE absorb only part of the laser energy due to the existence of PTFE. Also, the Al particles in F–Al–PTFE absorb more than those in S–Al–PTFE.
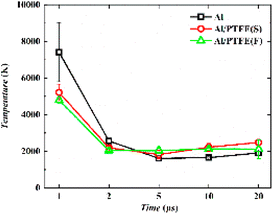
In general, the emission intensity declines with the reduction in plasma energy density. Because the experiment is conducted in an open environment, Al–PTFE composites can come into contact with O2 in the air. However, the emission intensity of AlO rises during the period of 5–20 μs. A similar phenomenon was also observed for the plasma temperature with a small increment, which indicates the occurrence of two exothermic reactions: Al + O → AlO and Al + O2 → AlO + O. Up to now, there are two explanations proposed. On the one hand, the oxide film on the surface of Al particles must undergo a lengthy melting process. Therefore, the generated active Al continues to participate in the reaction of AlO formation in the later stage of ablation when the oxide film breaks apart. On the other hand, it can be seen from Fig. 12 that, the plasma temperature of the three samples continues a decreasing trend during the period of 1–5 μs. When the decay reaches a significant extent, the pace of the forward AlO generation reaction rises sharply, and the overall AlO generation of the three samples shows an increasing trend. Thus, the signal of AlO at 5 μs is enhanced significantly. According to the first explanation, there is stronger AlO emission by F–Al–PTFE at 2 μs than S–Al–PTFE and a relatively stronger AlO emission by S–Al–PTFE at 5–40 μs. Thus, F–Al–PTFE has a lower ignition temperature and faster rate of combustion reaction. This is a contributor to F–Al–PTFE showing an advanced peak of temperature curve compared with S–Al–PTFE. Specifically, F–Al–PTFE shows a peak of temperature rise at 2 μs, while S–Al–PTFE shows a peak of temperature rise at 5 μs.
4 Conclusions
The reaction mechanism of Al–PTFE before and mechanically activation is systematically investigated. The activation energy, the gas generation during reaction, and the laser-induced breakdown spectroscopy of Al–PTFE composites are obtained. Then the following conclusions can be drawn specifically:(1) The increase of temperature and the decrease of polymerization degree play a role in enhancing the decomposition of PTFE cracking products.
(2) The difficulty of chemical reaction are determined by the energy barrier of the reaction. Compared the reaction of the pyrolysis products of PTFE with Al without O2, the reaction path of CF3 + Al → CF2 + AlF is the easiest to achieve.
(3) Different from metal–metal oxides, gaseous products can be produced during the decomposition process of Al–PTFE composites. High energy ball milling can significantly reduce the critical reaction temperature of Al–PTFE composites.
(4) Al–PTFE mechanically activated energetic composites has a lower ignition temperature and faster rate of combustion reaction in air.
Conflicts of interest
There are no conflicts to declare.References
- Y. H. Wang, L. L. Liu, L. Y. Xiao and Z. X. Wang, Thermal decomposition of HTPB/AP and HTPB/HMX mixtures with low content of oxidizer, J. Therm. Anal. Calorim., 2014, 119, 1673–1678, DOI:10.1007/s10973-014-4324-z.
- J. Tao, X. F. Wang, K. Zhang and X. S. Feng, Theoretical calculation and experimental study on the interaction mechanism between TKX-50 and AP, Def. Technol., 2020, 16, 825–833, DOI:10.1016/j.dt.2019.10.007.
- N. Yadav, P. K. Srivastava and M. Varma, Recent advances in catalytic combustion of AP-based composite solid propellants, Def. Technol., 2021, 17, 1013–1031, DOI:10.1016/j.dt.2020.06.007.
- D. S. Sundaram, V. Yang and V. E. Zarko, Combustion of nano aluminum particles (Review), Combust., Explos. Shock Waves, 2015, 51, 173–196, DOI:10.1134/s0010508215020045.
- D. S. Sundaram, P. Puri and V. Yang, A general theory of ignition and combustion of nano- and micron-sized aluminum particles, Combust. Flame, 2016, 169, 94–109, DOI:10.1016/j.combustflame.2016.04.005.
- H. Q. Nie, S. Pisharath and H. H. Hng, Combustion of fluoropolymer coated Al and Al-Mg alloy powders, Combust. Flame, 2020, 220, 394–406, DOI:10.1016/j.combustflame.2020.07.016.
- B. Zhao, S. Sun, Y. Luo and Y. Cheng, Fabrication of Polytetrafluoroethylene Coated Micron Aluminium with Enhanced Oxidation, Materials, 2020, 13, 3384, DOI:10.3390/ma13153384.
- D. T. Osborne and M. L. Pantoy, Effect of Al Particle Size on the Thermal Degradation of Al Teflon Mixtures, Combust. Sci. Technol., 2007, 179, 1467–1480, DOI:10.1080/00102200601182333.
- S. Li, Y. Wu, Q. Lin, C. Huang, S. Yang and J. Li, Measurement of the Heat of Reaction of Polytetrafluoroethylene/Aluminum Composites Based on Laser Initiation, Cent. Eur. J. Energ. Mater., 2017, 14, 534–546, DOI:10.22211/cejem/69264.
- R. J. Gill, S. Mohan and E. L. Dreizin, Sizing and burn time measurements of micron-sized metal powders, Rev. Sci. Instrum., 2009, 80, 064101, DOI:10.1063/1.3133712.
- T. Ding, W. Guo, W. Cao, H. Pei, X. Zheng and C. Liu, Experimental study of reaction properties of aluminum/polytetrafluoroethylene powder under laser ablation, AIP Adv., 2021, 11, 085010, DOI:10.1063/5.0059253.
- S. Zheng, J. Liu, Y. Wang, F. Li, L. Xiao, X. Ke, G. Hao, W. Jiang, D. Li, Y. Li and Z. Lan, Effect of aluminum morphology on thermal decomposition of ammonium perchlorate, J. Therm. Anal. Calorim., 2018, 134, 1823–1828, DOI:10.1007/s10973-018-7701-1.
- M. F. Gogulya, M. N. Makhov, A. Y. Dolgoborodov, M. A. Brazhnikov, V. I. Arkhipov and V. G. Shchetinin, Mechanical sensitivity and detonation parameters of aluminized explosives, Combust., Explos. Shock Waves, 2004, 40, 445–457, DOI:10.1023/B:CESW.0000033568.39812.2c.
- B. Feng, X. Fang, Y. C. Li and S. Z. Wu, Influence of processing techniques on mechanical properties and impact initiation of Al-PTFE reactive material, Cent. Eur. J. Energ. Mat., 2016, 13, 989–1004, DOI:10.22211/cejem/61496.
- V. Weiser, S. Kelzenberg and N. Eisenreich, Influence of the Metal Particle Size on the Ignition of Energetic Materials, Propellants, Explos., Pyrotech., 2001, 26, 284–289, DOI:10.1002/1521-4087(200112)26:6<284::AID-PREP284>3.0.CO;2-T.
- J. Wang, X. J. Jiang and L. Zhang, et al., Design and fabrication of energetic superlattice like-PTFE/Al with superior performance and application in functional micro-initiator, Nano energy, 2015, 12, 597–605 CrossRef CAS.
- S. M. Umbrajkar, M. Schoenitz and E. L. Dreizin, Control of structural refinement and composition in Al-MoO3 nanocomposites prepared by arrested reactive milling, Propellants, Explos., Pyrotech., 2006, 31(5), 382–389 CrossRef CAS.
- S. M. Umbrajkar, S. Seshadri and M. Schoenitz, et al., Aluminum-rich Al-MoO3 nanoeomposite powders prepared by arrested reactive milling, J. Propul. Power, 2008, 24(2), 192–198 CrossRef CAS.
- M. Sehoenitz, T. S. Ward and E. L. Dreizin, Fully dense nano-composite energetic powders prepared by arrested reactive milling, Proc. Combust. Inst., 2005, 30(2), 2071–2078 CrossRef.
- Y. Q. Yang, S. F. Wang and Z. Y. Sun, et al., Propagation of shock-induced chemistry in nano energetic materials: the first micrometer, J. Appl. Phys., 2004, 95, 3667–3676 CrossRef CAS.
- R. W. Conner and D. D. Dlott, Time-resolved spectroscopy of ignition and ignition of flash-heated nanoparticle energetic materials, J. Phys. Chem. C, 2012, 116, 14737–14747 CrossRef CAS.
- R. W. Conner and D. D. Dlott, Ultrafast condensed-phase emission from energetic composites of Teflon and nanoaluminum, J. Phys. Chem. A, 2010, 114, 6731–6741 CrossRef CAS PubMed.
- F. P. Bowden, M. A. Stone and G. K. Tudor, Hot spots on rubbing surfaces and the detonation of explosives by friction, Proc. R. Soc. London, Ser. A, 1947, 188, 329–332 CAS.
- J. Tao, X. F. Wang and J. H. Wang, et al., Reactivity and reaction mechanism of Al–PTFE mechanically activated energetic composites, FirePhysChem, 2021, 1(2), 123–128 CrossRef.
- L. Yang, J. Wu and D. Geng, et al., Reactive molecular dynamics simulation of the thermal decomposition mechanisms of 4,10-dinitro-2,6,8,12-tetraoxa-4,10-diazatetracyclo [5.5.0.05,9.03,11]dodecane (TEX), Combust. Flame, 2019, 202, 303–317 CrossRef CAS.
- F. Wang, L. Chen and D. Geng, et al., Thermal decomposition mechanism of CL-20 at different temperatures by ReaxFF reactive molecular dynamics simulations, J. Phys. Chem. A, 2018, 122(16), 3971–3979 CrossRef CAS PubMed.
- H. Bai, R. Gou and M. Chen, et al., ReaxFF/lg molecular dynamics study on thermal decomposition mechanism of 1-methyl-2,4,5-trinitroimidazole, Comput. Theor. Chem., 2022, 1209, 113594 CrossRef CAS.
- C. She, S. Jin and S. Chen, et al., Reactive molecular dynamics simulation of thermal decomposition for nano-FOX-7, Appl. Phys. A, 2021, 127(11), 881 CrossRef CAS.
- Material Studio 6.0, Accelrys Inc, San Diego, CA, 2004 Search PubMed.
| This journal is © The Royal Society of Chemistry 2023 |

