 Open Access Article
FTIR spectrum analysis to predict the crystalline and amorphous phases of hydroxyapatite: a comparison of vibrational motion to reflection†
Md. Sahadat Hossain a and
Samina Ahmed
 *ab
*ab
aInstitute of Glass & Ceramic Research and Testing, Bangladesh Council of Scientific and Industrial Research (BCSIR), Dhaka-1205, Bangladesh. E-mail: shanta_samina@yahoo.com
bBCSIR Laboratories Dhaka, Bangladesh Council of Scientific and Industrial Research (BCSIR), Dhaka-1205, Bangladesh
First published on 15th May 2023
Abstract
Hydroxyapatites were synthesized from calcium carbonate and ortho-phosphoric acid in amorphous and crystalline phases by varying sintering temperature from 300 to 1100 °C maintaining an increment of 200 °C. The asymmetric and symmetric stretching, and bending vibrations of phosphate and hydroxyl groups were explored in Fourier transformation infrared (FTIR) spectra. Although the FTIR spectra revealed identical peaks in the full range (400–4000 cm−1 wavenumber), the narrow spectra exerted variations by splitting peaks and intensity. The intensities of peaks at 563, 599, 630, 962, 1026, and 1087 cm−1 wavenumbers were intensified gradually with the augmentation of sintering temperature, and the relation between the relative peak intensity and sintering temperature was correlated with the aid of the good linear regression coefficient. Peak separations were also found in the case of 962 and 1087 cm−1 wavenumbers when the sintering temperature was equal to or exceeded 700 °C. The conventional X-ray diffraction (XRD) technique was also employed to explore the crystalline and amorphous phases of synthesized hydroxyapatites.
Introduction
Nearly 75% of inorganic materials and 90% of pharmaceutical active ingredients are separated using the crystallization process although the crystallization process has been utilized in inorganic materials with growing interest in organic compounds.1 The demand for amorphous materials is also increasing due to the important characteristics essential for industrial applications with the addition of emerging fields.2 Calcium phosphate is an important compound not only for biomedical applications but also for industrial applications, and the main compounds include hydroxyapatite, β-tricalcium phosphate, α-tricalcium phosphate, tetra-calcium phosphate, dicalcium phosphate, dicalcium phosphate monohydrate, triple superphosphate, etc.3–5 Hydroxyapatite (Hap) is a well-known bio-ceramic that has structural similarities with human hard tissue. In addition to its application in the human body, Hap has diverse applications such as a catalyst in the dehydrogenation of glycerol and alcohols, in protein separation, photoluminescence, as a gas sensor, electrochemical sensor, humidity sensor, in wastewater treatment by absorption or photocatalysis, etc.6–11 To characterize this Hap, the widely used instrumental techniques are X-ray diffraction (XRD), scanning electron microscopy (SEM), Fourier transform infrared (FTIR), atomic forced microscopy (AFM), transmittance electron microscopy (TEM), thermogravimetric analysis (TGA), differential scanning calorimetry (DSC), etc. along with other instrumental techniques.12–15 Among these instrumental techniques, only XRD and TEM are considered for the estimation of crystalline and amorphous materials.16,17 But, these instruments are costly and required high operating costs including extra care for sample preparation. Cooling system and high voltage along with current are other essential considerations of TEM and XRD during the analysis of samples. On the other hand, FTIR is a low-cost instrument excluding a cooling system and extra care on sample preparation when attached with attenuated total reflectance (ATR).18,19 In certain cases, Raman spectroscopy is also applied for the identification of amorphous and crystalline phases of inorganic materials.20 FTIR is a widely used technique for the identification of functional groups in organic compounds where a permanent dipole moment exists.21,22 However, the FTIR practice is not well established for the prediction or identification of crystalline and amorphous phases in the case of inorganic compounds. The applications of Infrared (IR) in inorganic compounds are augmenting day by day where dipole moment exist due to the variation of electronegativity. The phosphate and hydroxyl groups in hydroxyapatite can be identified using FTIR in specific wavenumbers.23The presence of phosphate and hydroxyl groups in Hap is drawing researchers' attention to explore more details in terms of crystallographic viewpoints. In few literature, researchers reported some peaks in the FTIR spectrum either for synthetic or natural Hap, and those peaks appeared or vanished due to the change of crystallinity.24–28 But, there was a scarcity of details analysis of the FTIR spectrum in terms of crystalline and amorphous phase (and a relation with the change of temperature) of Hap such as William Querido et al. focused on the 992 cm−1 wavenumber,24 Abdallah A. Shaltouta et al. compared the temperature effects on the basis of the ratio of phosphate and carbonate groups,26 Vuk Uskoković et al. utilized differentiation method instead of peak broadening and splitting,27 J Reyes-Gasga et al. reported FTIR analysis highlighting crystallinity index only,28 etc. There is a limitation regarding the complete analysis of the FTIR spectrum for Hap, which may lead to the exploration of crystalline and amorphous phases for other inorganic materials. In the case of Hap, the amorphous phase changes to the crystalline phases with the augmentation of temperature (justified by XRD)29 which may be found in a number of literature, but FTIR analysis in such cases with more details explanation and correlation are limited.
In this present study, the FTIR instrument was considered as a tool for the prediction of crystalline and amorphous phases of hydroxyapatite. The variation of amorphous and crystalline phases was performed using a wide range of temperature of the same raw materials. XRD instrument was also engaged as the conventional instrument to support the FTIR findings.
Materials and methods
Materials
Calcium carbonate and ortho-phosphoric acid were purchased from E-Merck Germany and used in this research without further purification. Deionized (DI) water was used for all the purposes which was prepared in the Institute of Glass and Ceramic Research and Testing Laboratory.Synthesis of amorphous and crystalline hydroxyapatite
Calcium carbonate and ortho-phosphoric acid were used as the raw source of calcium and phosphate, respectively. Suspension was prepared by mixing calcium carbonate and 100 mL of DI water, and 100 mL of ortho-phosphoric acid was prepared by dilution with water maintaining the Ca/P ratio of 1.67. The diluted phosphoric acid was added slowly (3 mL min−1) to the calcium carbonate solution following constant stirring with a magnetic stirrer. After adding the full acid, the pH of the sample was kept constant (pH ∼11) with the addition of either ammonium hydroxide or nitric acid, and the sample was kept under stirring for 6 h for the completion of the reaction and aging. The precipitated (ppt) sample was separated using a centrifuge with 4000 rpm and dried in normal conditions. The dried sample was kept in a polyethylene bag until further application. The dried sample was divided into five parts for sintering at 300, 500, 700, 900, and 1100 °C for 30 minutes.X-ray diffraction analysis
Rigaku Smart Lab XRD machine was engaged to explore the crystallographic properties of the synthesized hydroxyapatites. The instrument was operated at 40 kV and 50 mA of voltage and current, respectively and a ceramic copper X-ray source was utilized to produce characteristic spectrum (CuKα, λ = 1.54060 Å). The data were collected in the 2-theta range of 5–60° maintaining 0.01 steps. The operating temperature and water flow rate were 23 °C and 4.6–4.8 L min−1, respectively. The data were collected using Bragg–Brentano parafocusing geometry and the Kβ-rays were minimized using a Ni-Kβ filter in front of the detector. Before analyzing the Hap samples, the machine was calibrated with the aid of the standard silicon reference. The obtained data were analyzed using Smart Lab Studio II software which was embedded with the pdf+42![[thin space (1/6-em)]](https://www.rsc.org/images/entities/char_2009.gif) 021 standard ICDD database.
021 standard ICDD database.
FTIR analysis
An IR-Prestige 21 machine (Shimadzu, Japan) was engaged to explore the properties of the synthesized materials and the machine was facilitated by the attachment of attenuated total reflection (ATR). The spectrum was collected in the range of 400 to 4000 cm−1 wavenumber maintaining the spectral resolution of 4 cm−1 and the data were recorded from the average of 30 scans. Plenty of samples were used to collect data and all other variables (temperature: 25 °C, relative humidity: 60) were kept the same for all the samples.Results and discussion
FTIR analysis
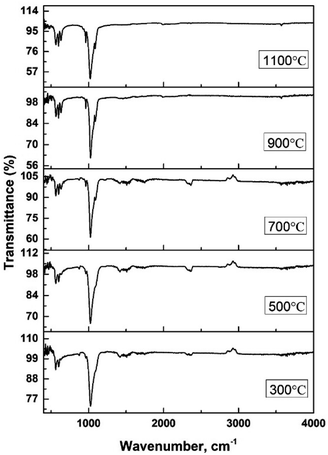
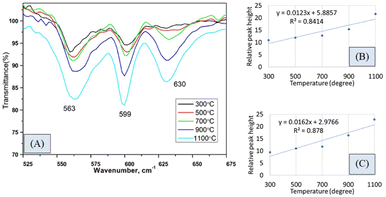
The hydroxyapatite molecules contain phosphate and hydroxyl groups in their structure which are active in the vibrational range of the Infrared spectrum (Fig. 1). The PO43− and OH1− groups generated peaks at fixed wavelengths, whether they are amorphous, crystalline, or doped products.30 Symmetric stretching, asymmetric stretching, symmetric bending, and asymmetric bending are the four fundamental vibrational modes for the phosphate groups.31 Any tetrahedral ions or molecules (like phosphate ions) are anticipated to exert four types of vibrational modes such as v1, v2, v3, and v4. Three stretching modes of vibration were noticed near 962, 1026, and 1087 cm−1 wavenumbers while bending vibration generated peaks near 465, 563, and 599 cm−1 wavenumbers. Similar types of peaks were visualized for hydroxyapatite (tetrahedron phosphate) in the published works of literature.32,33 The peaks at 1087, and 1026 cm−1 were responsible for the asymmetric stretching vibration (v3) of the phosphate group, and the peak at 962 cm−1 wavenumber was due to the symmetric stretching vibration (v1). Bending vibrations for the v4 degenerate state have appeared at 563 and 599 cm−1 wavenumbers while v2 bending vibration was noticed at 473 cm−1 wavenumber. The second FTIR active group is the hydroxyl group which can be confirmed from the small peaks near the wavenumbers of 630 and 3550 cm−1, and similar band positions were reported.34FTIR analysis is a very popular instrument for the identification of functional groups in organic compounds but sometimes inorganic samples can be identified using this instrument.35–37 For synthesized hydroxyapatite (Hap), two peaks appeared near 563 and 599 cm−1 wavenumber due to the bending vibration for all the types of Haps. But, there was a difference in the intensity of the peaks when a variation in temperature was maintained. Fig. 2(A) represents the magnified FTIR in the range of 525–675 cm−1 while Fig. 2(B) and (C) are the visual representation of straight-line equations showing the relation between the relative peak intensity (RI) and sintering temperature for 563 and 599 peaks, respectively. A minimum peak height was noticed when Hap was sintered at 300 °C temperature and the maximum was visualized for sintering at 1100 °C temperature. There was a gradual change in peak height maintaining a linearity with the sintering temperature. For a peak at 563 cm−1, linearity was noticed with a slope of 0.0123 and a linear regression coefficient of 0.84. A similar trend was found for the second peak at 599 cm−1 where the slope was 0.0162 and the regression coefficient was 0.88. For the mentioned two peaks, a similar slope (∼0.01) and regression coefficient were noticed. The temperature range can be divided into two sections such as 300–700 and 700–1100 °C. The electronic supplementary information† (ESI) Fig. S-1 illustrates the relation between RI and temperature within the range of 300–700 °C where an excellent regression coefficient (R2 = 0.995) was found with a slope of 0.0048. The second segment of temperature (700–1100) for the same peak was pictured in ESI Fig. S-2† representing regression coefficient and slope of 0.95, and 0.0218, respectively. The slope of the second segment was much higher than that of the first segment which carried good evidence that the second segment was the sensitive stage of sintering where RI varied more. The second peak (599 cm−1 wavenumber) can be divided in the same manner which are presented in ESI Fig. S-3 and S-4.† Similarly, for the first temperature stage (300–700), the slope and regression coefficient were 0.006, and 0.96, respectively while the second part (700–1100) generated a slope and regression coefficient of 0.0277, and 0.99, respectively. A relatively larger slope was also noticed for the 599 cm−1 wavenumber peak when the temperature was varied from 700 to 1100 °C temperature. It can be said from the slope of both peaks that the temperature 700–1100 °C is the relative peak intensity changing stage for Hap synthesis. When the temperature range was divided into two segments the linear regression coefficient was incredibly good (0.99 ≥ R2 ≥ 95) in the separate segment while in combined regression coefficient was slightly lower (0.88 ≥ R2 ≥ 84). The third peak in Fig. 2(A) was due to the presence of structural hydroxyl groups which was appeared near 630 cm−1 wavenumber and a similar type of peak was described in the literature.38,39 This peak was visualized after 700 °C temperature not for 300 or 500 °C temperatures. The peak intensity was also intensified with the amplification of the sintering temperature. In the full range of temperature, the slope and regression coefficient were 0.0154 and 0.91 which were very much similar to the aforementioned peaks of phosphate vibration (Fig. 3). Following a similar pattern, the temperature was divided into two segments to find out the temperature dependency of relative intensity. In the first stage (300–700 °C), the slope and regression coefficient were 0.0063, and 0.89 while the second segment (700–1100 °C) generated a relatively better slope (0.0237) and regression coefficient (0.99) (Fig. 3). It can be predicted that this peak (630 cm−1) was also influenced by the sintering temperature and 700–1100 °C is the peak intensity changing stage.
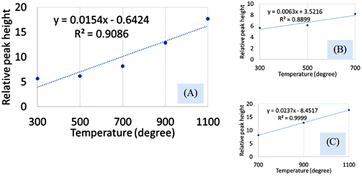 | ||
| Fig. 3 Dependency of relative peak intensity on the sintering temperature for (A) 300–1100 °C temperature, (B) 300–700 °C temperature, and (C) 700–1100 °C temperature. | ||
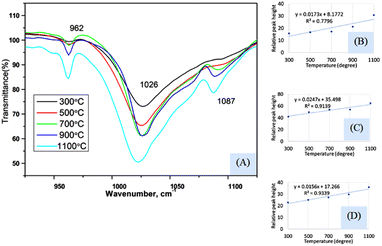
Fig. 4(A) represents the FTIR magnified spectrum in the range of 925–1125 cm−1 wavenumber where three peaks (962, 1026, and 1087 cm−1) of stretching vibration of phosphate groups have appeared. The peak originated for symmetric stretching (962 cm−1) showed a gradual change in the peak intensity when the sintering temperature was varied from 300 to 1100 °C. The relation between the sintering temperature and relative intensity was presented in Fig. 4(B) for 962 cm−1 wavenumber where the slope and regression coefficient were 0.0173, and 0.78, respectively. The slope was comparatively similar to the slope that was found for the bending vibration (explained in the previous section) but the regression coefficient was relatively lower. The dividing of temperature in two stages presented a relatively similar regression coefficient (0.96 for 300–700 °C and 0.95 for 700–1100 °C) which are visualized in ESI Fig. S-5 and S-6.† The first stage generated a lower slope (0.0038) than the second stage's slope (0.039) which carried good evidence that the second stage was the temperature dependency stage. A significant peak was visualized at 1026 cm−1 which was appeared for all the synthesized Haps but there was also a difference in case of variation of temperature. The minimum and maximum peaks were generated for 300 and 1100 cm−1 wavenumber, respectively. The regression coefficient was comparatively good (R2 = 0.91) for the experimental temperatures for full range of experimental temperatures (Fig. 4(C)). However the separation based on the temperature for this peak was not significantly different which are illustrated in ESI Fig. S-7 and S-8.† Similar slopes (0.0294 and 0.0271) were found for both stages when divided accordingly the previously mentioned way, but the regression coefficient was lower (R2 = 0.76) in the case of the second stage than that of the first stage (R2 = 0.97). Another peak at 1087 cm−1 wavenumber, originated for the asymmetric vibration of phosphate, also maintained a gradual change in relative intensity with the augmentation of temperature (Fig. 4(D)). In this case, good regression coefficient (R2 = 0.93) and a similar slope (0.0156) like the aforementioned slope of bending vibration were found. The first and second stages (visualized in ESI Fig. S-9 and S-10†) (dividing previously mentioned ways) presented slopes of 0.0107 and 0.0227, respectively while the regression coefficient were 0.99 and 0.95, respectively. In addition to this difference in peak intensity, the peak separation was also noticed when the temperature was increased which can be visualized from the narrow spectrum figure and even in full range of spectrum. There was no separate peak was visualized up to 500 °C temperature but when temperature was raised to 700 °C separate peak formation was noticed for 962 and 1087 cm−1 wavenumbers. These peaks were clearly visualized up to 1100 °C temperature but in case of relatively lower temperature these two peaks were combined with the more intense peak of 1026 cm−1 wavenumber. This type of peak separation normally occurs in case of increase of crystallinity which is generally measured in X-ray diffraction instrument.
Another peak appeared near the wavenumber of 3568 cm−1 which was the characteristic peak for the hydroxyl group. The peak intensity was also increased with the increment of sintering temperature. The relation between the sintering temperature and peak intensity is illustrated in ESI Fig. S-11–S-14† where the regression coefficient and slope flowed the same pattern as mentioned in the previous sections.
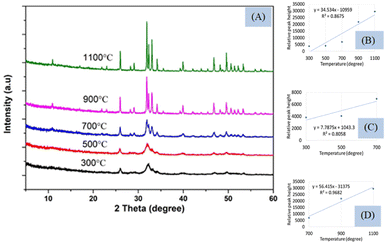
Peak separation and increment in intensity occurred when crystallinity increases and can be observed using XRD which is presented in Fig. 5(A). The peak separation started to form from the temperature 700 °C and increased up to 1100 °C. The phase change occurs in Hap when temperature is changed from 700 to 900 °C which are described in the literature from XRD and DSC.29,30 The XRD instrument are based on the reflection from the crystal planes and peaks are well separated when amorphous phase is changed to crystalline phase. In the Fig. 5, the crystal planes are separated gradually when temperature is changed from 300 °C to 1100 °C. The XRD pattern of the synthesized Hap was matched with the standard database of ICDD (card no:# 01-074-0566).
Though it is well established that the formation of crystalline materials can be predicted from the peak height and separated planes from the XRD instrument, in this case, only one plane (211) with d-spacing 2.80 (highest intense peak for Hap) was considered. The peak separation can be noticed from Fig. 5(A) and the relation between the temperature (300–1100 °C) and the peak height is illustrated in Fig. 5(B) showing regression coefficient (0.87) and slope (34.53). The full temperature range can be divided into two segments (Fig. 5(C) and (D)), as shown for FTIR, and the slope (7.79) and regression coefficient (0.80) of the first stage were relatively lower than the slope (56.42) and regression coefficient (0.97) of the second stage. The larger slope indicated the temperature dependency of crystal formation in the second segment (700–1100 °C) which was in tune with the results of FTIR. Another characteristic plane (112) cannot be visualized for 300 and 500 °C temperature while for the rest of the temperatures this peak (at d-spacing of 2.77) is well separated. Thus the reflections from the different planes are well separated in case of formation of crystals can be measured in XRD. In tune with this peaks can be separated in the FTIR instrument also which was found for 962 and 1087 cm−1 wavenumber for the phosphate group. These two peaks are normally generated by the stretching vibration of the phosphate group which cannot be separated up to 500 °C temperature these may remain as a single peak with a strong peak of 1026 cm−1 wavenumber. A similar type of complex peak formation was also found for the hydroxyl group at 630 cm−1 wavenumber up to the mentioned temperature. On the other hand, the relative peak height was augmented with the rise of sintering temperature for all the analyzed peaks in FTIR which was in tune with the concept of XRD. Thus it can be predicted that the formation of crystals also affects the vibrational motion of hydroxyapatite. In the case of XRD, the oriented atoms in the crystal help in the formation of constructive interference which results in the increment of peak intensity as well as plane separation. In a similar way, the vibrational motion also is affected by the formation of long-range order in the material phase which leads to the separation of certain peak(s). When crystals are formed by the increment of the sintering temperature, more numbers of atoms come in a similar energy state which leads to the intense peak of vibrational motion. In the case of Hap, the effects of sintering temperature were observed not only for the stretching vibration but also for the bending vibration. From the XRD pattern, it is clearly visualized that the higher temperature favors the formation of crystals which was also verified from the slope of the straight line. Similarly, for FTIR, high temperature generated larger slopes than that of the lower temperature for all the marked peaks. Another similarity was also noticed in the case of a good regression coefficient for both XRD and FTIR. Though FTIR is not designed for the identification of inorganic materials for neither amorphous nor crystalline, it can be predicted whether the synthesized Hap is amorphous or crystalline. The pattern in XRD remains the same whether the samples are crystalline or amorphous, and the reflections are found in the same d-spacing as there was no shift of planes distance. The FTIR spectra remained the same for all types of samples without a change of wavenumber as the vibrational energy remained identical for crystalline and amorphous Hap. When temperature increases, the atoms of Hap come in a more oriented form (crystalline phase) which may change the contribution of force constant as well as reduced mass to influence a very slight change in peak position.
Conclusion
A preliminary prediction of amorphous and crystalline phases from the FTIR machine was achieved from the synthesized hydroxyapatites following variation in sintering temperature. A good linear regression coefficient from the relation between relative peak intensity and sintering temperature indicated that the FTIR machine can be used to predict crystalline and amorphous Hap. Comparatively similar slope was found for all the peaks for 300–1100 °C temperature but there was a larger slope when temperature changed from 700 to 1100 °C which indicated phase change is more sensitive than 300–700 °C. The FTIR data were compared with the conventional XRD technique which also revealed similar types of data. It can be concluded from this research finding that the FTIR machine (vibrational motion) can also be utilized to predict the crystalline and amorphous phase of hydroxyapatite, and more attention to vibrational motion can explore new ways of analytical technique for amorphous and crystalline materials.Data availability
The raw/processed data required to reproduce these findings will be made available on request.Author contributions
Md. Sahadat Hossain conceived and designed the experiment, analysed the data, written the original manuscript and performed the experiment. Samina Ahmed supervised the overall work and assisted writing the manuscript.Conflicts of interest
There are no conflicts to declare related to this research.Acknowledgements
The authors are grateful to Bangladesh Council of Scientific and Industrial Research (BCSIR) authority for financial support through R&D project (ref. no. 39.02.0000.011.14.134.2021/900; Date: 30.12.2021). Md. Sahadat Hossain acknowledges the financial support from the Ministry of Science and Technology for approving R&D project (ref. no. 39.00.0000.012.20.011.22.56; date: 03.04.2023). The authors also wish to thank Strengthening Institute of Glass and Ceramics Research & Testing along with its project director Dr Shirin Akter Jahan, PSO for sophisticated instrumental support.References
- R. Soto, V. Verma, A. Lynch, B. K. Hodnett and Å. C. Rasmuson, Cryst. Growth Des., 2020, 20, 7626–7639 CrossRef CAS.
- A. Sahu, S. N. Steinmann and P. Raybaud, Cryst. Growth Des., 2020, 20, 7750–7760 CrossRef CAS.
- L. C. Chow and E. D. Eanes, Monogr. Oral Sci., 2001, 18, 148–163 CAS.
- H. Zhou, L. Yang, U. Gbureck, S. B. Bhaduri and P. Sikder, Acta Biomater., 2021, 127, 41–55 CrossRef CAS PubMed.
- H. K. Varma, S. N. Kalkura and R. Sivakumar, Ceram. Int., 1998, 24, 467–470 CrossRef CAS.
- T.-G. Kim and B. Park, Inorg. Chem., 2005, 44, 9895–9901 CrossRef PubMed.
- L. Khtaoui, M. Laghrouche, F. Fernane and A. Chaouchi, J. Mater. Sci.: Mater. Electron., 2021, 32, 8668–8686 CrossRef CAS.
- C. Zhang, Z. Cheng, P. Yang, Z. Xu, C. Peng, G. Li and J. Lin, Langmuir, 2009, 25, 13591–13598 CrossRef CAS PubMed.
- E. Iyyappan, S. J. Samuel Justin, P. Wilson and A. Palaniappan, ACS Appl. Nano Mater., 2020, 3, 7761–7773 CrossRef CAS.
- S.-D. Jiang, Q.-Z. Yao, G.-T. Zhou and S.-Q. Fu, J. Phys. Chem. C, 2012, 116, 4484–4492 CrossRef CAS.
- G. Bharath, K. Rambabu, A. Hai, H. Taher and F. Banat, ACS Sustain. Chem. Eng., 2020, 8, 7278–7289 CrossRef CAS.
- Y. Lee, Y. M. Hahm, D. H. Lee, S. Matsuya, M. Nakagawa and K. Ishikawa, Ind. Eng. Chem. Res., 2008, 47, 2618–2622 CrossRef CAS.
- Q. Bao, C. Chen, D. Wang and J. Liu, Cryst. Growth Des., 2008, 8, 219–223 CrossRef CAS.
- J. Ma and J. Qin, Cryst. Growth Des., 2015, 15, 1273–1279 CrossRef CAS.
- L.-W. Du, S. Bian, B.-D. Gou, Y. Jiang, J. Huang, Y.-X. Gao, Y.-D. Zhao, W. Wen, T.-L. Zhang and K. Wang, Cryst. Growth Des., 2013, 13, 3103–3109 CrossRef CAS.
- J. Tao, H. Pan, Y. Zeng, X. Xu and R. Tang, J. Phys. Chem. B, 2007, 111, 13410–13418 CrossRef CAS PubMed.
- B. Jin, Z. Liu, C. Shao, J. Chen, L. Liu, R. Tang and J. J. De Yoreo, Cryst. Growth Des., 2021, 21, 5126–5134 CrossRef CAS.
- M. Hossain, M. Mahmud, M. B. Mobarak and S. Ahmed, Chem. Pap., 2021, 1–13 Search PubMed.
- M. S. Hossain, M. A. A. Shaikh and S. Ahmed, Mater. Adv., 2023, 4, 240 RSC.
- G. Montes-Hernandez and F. Renard, J. Phys. Chem. C, 2020, 124, 15302–15311 CrossRef CAS.
- M. Sahadat Hossain, M. Razzak, M. B. Uddin, A. S. Chowdhury and R. A. Khan, Radiat. Eff. Defects Solids, 2020, 175, 516–528 CrossRef CAS.
- M. Sahadat Hossain, M. B. Uddin, M. Razzak, A. M. Sarwaruddin Chowdhury and R. A. Khan, Radiat. Eff. Defects Solids, 2017, 172, 904–914 CrossRef CAS.
- S. Sultana, M. S. Hossain, M. Mahmud, M. B. Mobarak, M. H. Kabir, N. Sharmin and S. Ahmed, RSC Adv., 2021, 11, 3686–3694 RSC.
- W. Querido, S. Bookbinder, M. C. Oliveira-Nunes, B. Krynska and N. Pleshko, Analyst, 2020, 145, 764–776 RSC.
- A. Ślósarczyk, Z. Paszkiewicz and C. Paluszkiewicz, J. Mol. Struct., 2005, 744, 657–661 CrossRef.
- A. A. Shaltout, M. A. Allam and M. A. Moharram, Spectrochim. Acta, Part A, 2011, 83, 56–60 CrossRef CAS PubMed.
- V. Uskoković, Vib. Spectrosc., 2020, 108, 103045 CrossRef PubMed.
- J. Reyes-Gasga, E. L. Martínez-Piñeiro, G. Rodríguez-Álvarez, G. E. Tiznado-Orozco, R. García-García and E. F. Brès, Mater. Sci. Eng., C, 2013, 33, 4568–4574 CrossRef CAS PubMed.
- M. S. Hossain, M. Mahmud, S. Sultana, M. Bin Mobarak, M. S. Islam and S. Ahmed, R. Soc. Open Sci., 2021, 8, 210684 CrossRef PubMed.
- M. S. Hossain, S. M. Tuntun, N. M. Bahadur and S. Ahmed, RSC Adv., 2022, 12, 34080–34094 RSC.
- N. Kourkoumelis and M. T. Tzaphlidou, Sci. World J., 2010, 10, 402–412 CrossRef PubMed.
- N. K. Nguyen, M. Leoni, D. Maniglio and C. Migliaresi, J. Biomater. Appl., 2013, 28, 49–61 CrossRef CAS PubMed.
- R. A. Ramli, R. Adnan, M. A. Bakar and S. M. Masudi, J. Phys. Sci., 2011, 22, 20–37 Search PubMed.
- M. Jevtic, M. Mitric, S. Skapin, B. Jancar, N. Ignjatovic and D. Uskokovic, Cryst. Growth Des., 2008, 8, 2217–2222 CrossRef CAS.
- N. Marzban, J. A. Libra, V. S. Rotter, K. S. Ro, D. Moloeznik Paniagua and S. Filonenko, ACS Omega, 2023, 8(4), 4234–4243 CrossRef CAS PubMed.
- A. Dopilka, Y. Gu, J. M. Larson, V. Zorba and R. Kostecki, ACS Appl. Mater. Interfaces, 2023, 15(5), 6755–6767 CrossRef CAS PubMed.
- M. T. Hossain, M. S. Hossain, M. B. Uddin, R. A. Khan and A. S. Chowdhury, Adv. Compos. Hybrid Mater., 2021, 4, 257–264 CrossRef CAS.
- Y. In, U. Amornkitbamrung, M.-H. Hong and H. Shin, ACS Omega, 2020, 5, 27204–27210 CrossRef CAS PubMed.
- J. Kolmas, E. Groszyk and U. Piotrowska, Nanoscale Res. Lett., 2015, 10, 278 CrossRef PubMed.
Footnote |
| † Electronic supplementary information (ESI) available. See DOI: https://doi.org/10.1039/d3ra02580b |
| This journal is © The Royal Society of Chemistry 2023 |

