 Open Access Article
Preparation and characterization of cellulose nanocrystals from corncob via ionic liquid [Bmim][HSO4] hydrolysis: effects of major process conditions on dimensions of the product†
Wanwipa Rasria,
Vu Thi Thu b,
Angelica Corpuz
 c and
Loc Thai Nguyen
 *a
*a
aDepartment of Food, Agriculture and Bioresources, Asian Institute of Technology, (AIT), 58 Moo 9, Km 42, Paholyothin Highway, Klong Luang, Pathum Thani 12120, Thailand. E-mail: locnguyen@ait.ac.th
bUniversity of Science and Technology of Hanoi (USTH), Vietnam Academy of Science and Technology (VAST), 18 Hoang Quoc Viet, Cau Giay, Hanoi, Vietnam
cDepartment of Chemical Engineering, College of Engineering and Architecture, Cagayan State University, Carig Sur, Tuguegarao City, Cagayan Valley 3500, Philippines
First published on 22nd June 2023
Abstract
In this study, cellulose nanocrystals were prepared via the hydrolysis of corncob (CC) biomass using Brønsted acid ionic liquid 1-butyl-3-methylimidazolium hydrogen sulfate [Bmim][HSO4]. The corncob was subjected to alkaline pretreatment, and was then hydrolysed by [Bmim][HSO4], which acted as both solvent and catalyst. The effects of process conditions, including mass percent of CC (1.0–10.0%), reaction temperature (46–110 °C), and reaction time (1.2–2.8 h) on the size of cellulose nanocrystals (IL-CCCNC) were investigated by response surface methodology-central composite design. The obtained IL-CCCNC was characterized by Fourier transforms infrared spectroscopy, zeta sizer, scanning electron microscopy, transmission electron microscopy, X-ray diffraction, and thermogravimetry. The results showed that the dimensions of the nanocellulose products were affected by the mass percent of CC and the reaction temperature, but were not significantly influenced by the reaction time under the studied conditions. The optimal conditions, estimated by the developed model, were a mass percent of 2.49%, reaction temperature of 100 °C, and reaction time of 1.5 h. The process successfully produced IL-CCCNC with a yield of 40.13%, average size of 166 nm, and crystallinity index (CrI) of 62.5%. The morphology, chemical fingerprints, and thermal properties of the obtained IL-CCCNC were comparable to those extracted by alkaline and acid hydrolysis. After the reaction, [Bmim][HSO4] could be recovered with a yield of 88.32%, making it a viable green catalyst for the hydrolysis of CC cellulose. The findings are of direct industrial relevance as optimal processes can be developed to produce nanocellulose crystals with desirable size and physicochemical characteristics.
1. Introduction
Nanocellulose (NC) refers to cellulosic materials having a dimension of 100 nm or less.1,2 Unlike ordinary cellulose, NC possesses many outstanding characteristics, such as high specific surface area and aspect ratio, chemical reactivity, low density, thermal expansion, and excellent mechanical properties.3–5 Due to its abundance, renewability, and biocompatibility, NC could be one of the most prominent green materials in the future.1 NC can be applied in several fields, such as nanocomposite materials, biomedical products, catalytic supports, electroactive polymers, continuous fibres and textiles, food coatings, barriers, separation membranes, biosorbent for water treatment, reinforcements in food packaging, etc.1,6–10 Nanocellulose can be produced from inexpensive agricultural residues such as palm and banana rachis, cotton seeds, sugar cane, corncob, rice straw, wheat straw, bamboo cane, and flax bast.11,12 Usually, the feedstocks are first pre-treated to remove hemicelluloses and lignin. In the next stage, the amorphous regions from pristine cellulose are eliminated to produce pure rod-like nanocellulose particles, commonly referred to as cellulose nanocrystals (CNCs), with crystallinity index as high as 54–88%, width of 4–70 nm, length of 100–6000 nm.1 Traditional processes mainly rely on alkali and bleaching pre-treatments of cellulose, followed by acid hydrolysis step. Even though these methods are inexpensive, they have negative impacts on CNC's properties and pose severe environmental issues.Sustainable alternative methods for preparing CNCs, including chemical acid hydrolysis, mechanical and oxidation treatment, enzymatic hydrolysis, deep eutectic solvents, subcritical water hydrolysis, and combined processes have been attempted to reduce the use of toxic solvents.1 Nevertheless, the prevailing shortcomings such as high cost, elevated reaction temperature, and excessive water required for the neutralization step limit their applicability.13 Recently, ionic liquids (ILs) have been investigated as green solvents and catalysts for nanocellulose preparation.14 ILs are organic salts that exist as a liquid at relatively low temperatures (≤100 °C). ILs possess many unique characteristics, such as chemical and thermal stability, low melting point, non-volatility, non-flammability, negligible vapor pressure, and high solvency power.15 ILs are eco-friendly solvents since they can be recovered up to 99.5% after evaporation of the anti-solvent. ILs can be recycled as many as five times without losing their catalytic capabilities, and without creating hazardous wastes.16,17 When used as a solvent, IL can dissolve cellulose due to the interactions between its anions and the inter- and intramolecular hydroxyl groups of cellulose. Cellulosic biomasses such as wood, empty fruit bunch, rice husk, and cotton linter have been dissolved by ILs.14,18 As a catalyst, IL cleaves the glycosidic bonds between two anhydroglucose units of cellulose, yielding nanoscale cellulose products.19 The catalytic activity of ILs can be enhanced with the incorporation of an acidic functional group into their structures. These ILs are commonly referred to as Brønsted acidic ILs. ILs have been used to isolate cellulose-rich fraction from oil palm empty fruit bunch,20 to produce regenerated cellulose fibre from raw wood pulp,21 and to prepare CNC and cellulose nanoparticles from microcrystalline cellulose or cellulosic biomass.14,17,22–25 However, few studies have applied IL as a catalyst to produce nanocellulose directly from agricultural biomass residues. It was established that as cellulose is subjected to IL hydrolysis, the process conditions such as type of biomass and ILs, reaction time, and temperature substantially affect the morphology, dimension, aspect ratio, density, mechanical properties, thermal stability, and crystallinity of the CNC or other cellulosic products.1,26 Different biomass residues require different treatment conditions due to their inherent structures and chemical compositions. In addition, the type of IL to be used is critical as its catalytic capability depends on its structure, viscosity, and acidity.15 Reaction temperature and time can influence the crystallinity of CNCs produced.14 Elevated temperature may lead to biomass degradation, whereas low temperature would require extended treatment time. Therefore, optimizing IL hydrolysis conditions must be prioritized to produce CNC with desirable characteristics and functionality.
In this study, nanocellulose was directly prepared from alkaline-pretreated corncob (CC) by IL hydrolysis for the first time. The effect of reaction conditions, including mass percent of CC loading, reaction temperature, and reaction time on the size of the nanocellulose was assessed and optimized by central composite design (CCD). The chemical structure, crystallinity index, thermal stability, and morphology of the obtained CNC were also characterized.
2. Experimental
2.1 Materials and reagents
Corncob, having a moisture content of 9.16 ± 0.11%, was kindly provided by Yongsuwat Agritrade Co., Ltd. (Nakhon Sawan, Thailand). 1-Butyl-3-methylimidazolium hydrogen sulfate [Bmim][HSO4] (95%) was purchased from Sigma Aldrich (Missouri, USA). Potassium hydroxide was acquired from Kemaus (New South Wales, Australia). Deionized water was obtained from the RCI Labscan. Dialysis tubes (13![[thin space (1/6-em)]](https://www.rsc.org/images/entities/char_2009.gif) 000 Da MWCO) were supplied by Wako Pure Chemical Industries (Osaka, JP). Sulfuric acid (98%) was procured from Merck (Darmstadt, Germany). All chemicals were of analytical grade and used without further purification.
000 Da MWCO) were supplied by Wako Pure Chemical Industries (Osaka, JP). Sulfuric acid (98%) was procured from Merck (Darmstadt, Germany). All chemicals were of analytical grade and used without further purification.
2.2 Preparation of corncob nanocellulose
The corncob was washed to remove the dirt and sun-dried for 16 h. The sample was then crushed by a grinder (Mulry function disintegrator WF-04, China) for 5 min and sifted through a 100 mesh sieve. The obtained powder was oven-dried at 60 °C for 24 h and kept in an airtight, laminated aluminium bag before use. The nanocellulose was produced following the protocols of Li et al. (2015) and Tan et al. (2015) with modifications.14,27 Briefly, dried corncob powder was soaked overnight in deionized water and then pre-treated with 2.0% KOH at 90 °C for 4 h to partially remove non-cellulosic components. The sample was finally washed with deionized water and filtered until neutrality. Preliminary analysis (Table 1) showed that the pre-treatment increased the cellulose content of CC from 35.2 to 77.4%. The hemicellulose and lignin content diminished from 46.9 to 17.5% and 16.7 to 4.8%, respectively, consistent with literature.28–30 It was evident that the pre-treatment effectively eliminated the recalcitrant components from the CC matrix, facilitating the hydrolysis of CC by IL in the subsequent steps.| Sample | Content (%) | |||
|---|---|---|---|---|
| Extractive | Hemicellulose | Lignin | Cellulose | |
| CC | 5.28 ± 2.22 | 44.90 ± 1.17 | 16.66 ± 0.30 | 33.16 ± 3.06 |
| ACC | — | 17.50 ± 1.08 | 4.80 ± 0.10 | 77.70 ± 1.26 |
| IL-CCCNC | — | 1.19 ± 1.14 | 1.61 ± 1.56 | 97.20 ± 1.02 |
After pre-treatment, CC powder was hydrolysed with ionic liquid [Bmim][HSO4]. The effects of three process parameters, including mass percent of CC loading (1.0–10.0%), reaction temperature (48–110 °C), and time (1.2–2.8 h), were investigated, with all reaction conditions being given in Table S1.† For each treatment, a predetermined amount of CC and water was mixed with 5 g [Bmim][HSO4] to achieve the desired mass percent. Water was added to initiate acid-catalyzed hydrolysis.31 Before reaction, the suspension was homogenized by ultrasonics (UP200S, Hielscher, Germany) for 15 min to enhance the dispersion of CC in [Bmim][HSO4]. The hydrolysis process was carried out in a reflux system, and the reaction was quenched by adding 60 ml of cold deionized water. The mixture was centrifuged at 10![[thin space (1/6-em)]](https://www.rsc.org/images/entities/char_2009.gif) 000 rpm for 20 min to remove unhydrolyzed corncob particles. The supernatant was dialyzed against deionized water until the pH became stable. Finally, the obtained nanocellulose was freeze-dried and kept in sealed bags for further characterization. The samples at different stages of the nanocellulose preparation process are illustrated in Fig. 1.
000 rpm for 20 min to remove unhydrolyzed corncob particles. The supernatant was dialyzed against deionized water until the pH became stable. Finally, the obtained nanocellulose was freeze-dried and kept in sealed bags for further characterization. The samples at different stages of the nanocellulose preparation process are illustrated in Fig. 1.
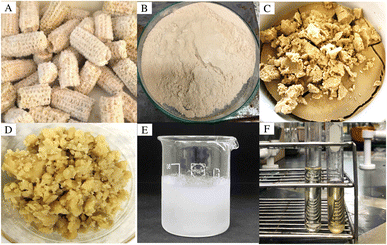 | ||
| Fig. 1 (A) Corncob, (B) ground and sieved sample, (C) water-soaked sample, (D) alkaline-pretreated sample, (E) [Bmim][HSO4] hydrolyzed corncob, (F) fresh (left) and regenerated (right) [Bmim][HSO4]. | ||
The yield of nanocellulose was determined by the gravimetric method below:32
 | (1) |
IL was recovered from the supernatant and dialysis solution using the method described by Tan et al. (2015).14 Firstly, IL solution was concentrated by a vacuum rotary evaporator. Subsequently, the remaining water was removed by freeze-drying. The yield of recovered IL was calculated by eqn (2):
 | (2) |
2.3 Measurement of particle size and zeta potential
The particle size and zeta potential of the CC nanocellulose were measured by Malvern Zetasizer Nano ZS (Malvern Instrument, UK). Nanocellulose suspension (0.05 wt%) was prepared in DI water and sonicated for 30 min before the test. The measurement was performed at 25 °C. Each sample was measured ten times.2.4 Fourier transform infrared spectroscopy (FTIR)
The spectra of raw CC, alkaline-treated CC (ACC), and CC nanocellulose (IL-CCCNC) were measured by an FTIR spectrometer (Nicolet iS50, Thermo Scientific, USA) over the range of 4000 cm−1 to 400 cm−1 at a resolution of 4 cm−1. The samples were ground, blended with KBr, and pressed into ultra-thin pallets.33 Each sample was scanned three times, and the average spectrum was collected.2.5 X-ray diffraction (XRD)
The crystallinity index (CrI) of the samples were determined by an X-ray diffractometer (D8 Advance Brucker, Germany) equipped with CuKα radiation at a power of 40 mA and accelerating voltage of 40 kV. The measurement was performed in reflection mode in the 2θ range of 10–50° with a resolution of 0.1°. The crystallinity index was calculated using the Segal method:14
 | (3) |
2.6 Scanning electron microscope (SEM) and transmission electron microscope (TEM)
The surface morphology of the samples was examined by field emission scanning electron microscopy (FE-SEM) (Hitachi S-4800, Japan) at an accelerating voltage of 15 kV. Before the test, the samples were coated with a thin layer of platinum to enhance the image quality. In addition, IL-CCCNC was also characterized by Environmental Scanning Electron Microscope (ESEM) (Thermoscientific, USA). A few drops of nanosuspension were deposited onto ultra-thin carbon film on 400 mesh copper grids and the micrographs were recorded with a dark-field scanning transmission electron microscopy (DF-STEM) detector at an accelerating voltage of 30 kV. The dimensions of the samples were determined using a transmission electron microscope (JEM-2100Plus, JEOL, Tokyo, Japan).2.7 Thermogravimetric analysis (TGA) and differential scanning calorimetry analysis (DSC)
Thermal stability of the samples was characterized by TGA using a thermogravimetric analyzer (TG 209F1, NETZSCH, Germany) from 25 °C to 600 °C at a heating rate of 10 K min−1. The measurements were performed under N2 atmosphere with a gas flow rate of 20 cm3 min−1. In addition, DSC analysis was performed with a differential scanning calorimeter (DSC 204F1 Phoenix, NETZSCH, Germany). Each sample was placed in a DSC crucible and heated from 25 °C to 400 °C under N2 atmosphere with a heating rate of 10 K min−1.2.8 Data analysis
In this study, the effects of the mass percent of corncob (1.0–10.0%), reaction temperature (48–110 °C), and time (1.2–2.8 h) on the size of IL-CCCNC were evaluated by CCD via Design-Expert Software (version 11.0, Stat-Ease Inc., MN, USA). The three variables' coded levels of parameters are provided in Table S2.† The influence of reaction conditions (Xi, Xj) on the response variable (Y) is described by the following quadratic polynomial equation:34
 | (4) |
3. Results and discussions
3.1 Effect of hydrolysis conditions on the size of obtained IL-CCCNC
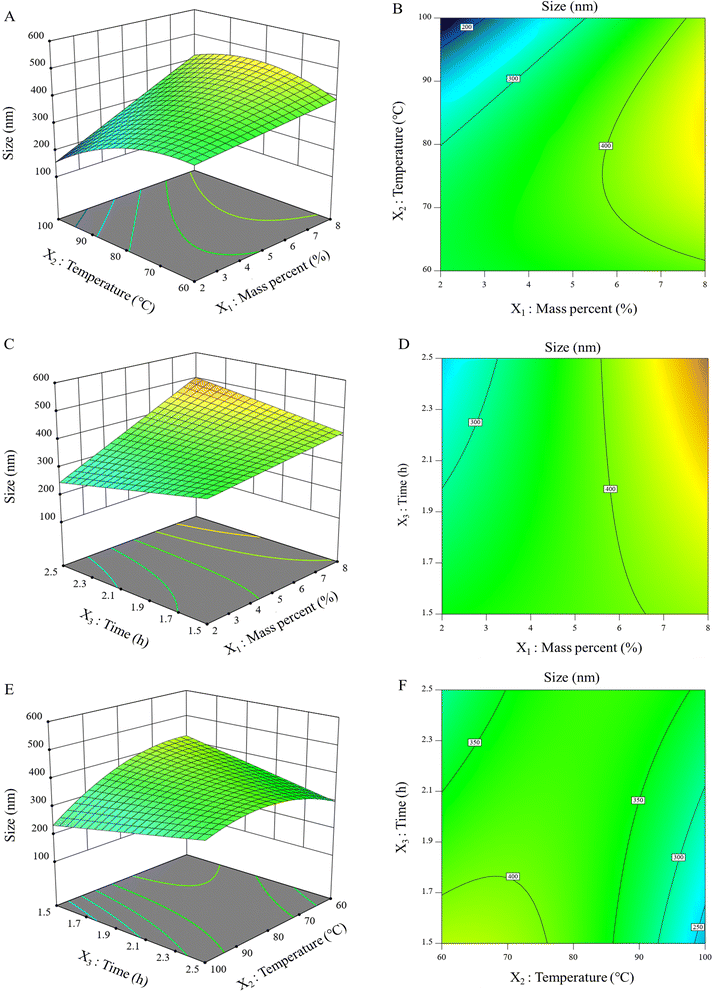
Under studied conditions, the yield of IL-CCCNC from the raw CC was about 40.13%. The size of obtained nanocellulose ranged from 166 nm to 547 nm. The IL-CCCNC suspension had a narrow polydispersity index (PDI) of 0.51 and a high zeta potential value of −36.1 mV, indicating its uniform dispersion and stability in water. The effects of the mass percent of CC loading (X1), reaction temperature (X2), and time (X3) on the size of IL-CCCNC (Y) are illustrated in Fig. 2. The regression coefficients of the models based on coded (eqn (5)) as well as the actual values (eqn (6)) are given below:| Y = 379.12 + 80.01X1 − 37.27X2 − 4.14X3 + 51.50X1X2 + 48.50X1X3 + 57.50X2X3 − 54.61X22 | (5) |
| Y = 1124.46 − 106.66X1 + 4.19X2 − 630.02X3 + 0.86X1X2 + 32.33X1X3 + 5.75X2X3 − 0.13X22 | (6) |
The R2 value of the model is 0.828, and the lack of fit is insignificant (p = 0.5998). The results indicate that the size of IL-CCCNC correlates well with process variables and can be estimated from the reaction conditions. The model suggested the optimal conditions are at 2.49 mass percent of CC, 100 °C reaction temperature, and 1.5 h reaction time, producing IL-CCCNC with an average size of 166 nm. The optimal point was validated by three independent experiments, yielding the average size of CC nanocellulose of 182 nm with a relative error of 9.63%. Eqn (6) demonstrates that the size of IL-CCCNC was significantly affected by the mass percent of CC (X1) and reaction temperature (X2). The dimension of IL-CCCNC augmented with increase in X1 but was reduced when X2 increased. The reaction time (X3) did not have any visible impact on the size of IL-CCCNC.
The interactive effects between mass percent and reaction temperature are illustrated in Fig. 2A. During hydrolysis process, [Bmim][HSO4] diffused into the space between cellulose chains. [Bmim][HSO4] was dissociated into individual [Bmim]+ cation and [HSO4]− anion. Then, the electron donor-electron acceptor (EDA) complexes were formed between the charged species of [Bmim][HSO4] and hydrogen and oxygen atoms of the cellulose molecules (Fig. S1†). The anion [HSO4]− was associated with the proton of hydroxyl bonds whereas the aromatic protons of the cation imidazolium attacked the oxygen atoms of hydroxyls. Consequently, cellulose chains were separated. Furthermore, within a cellulose chain, the carbon atoms of the β-1,4-glycosidic bonds were attacked by [HSO4]− and the oxygen atom of β-1,4-glycosidic bonds interacted with [Bmim]+ with its electron rich aromatic π system.14 The reaction resulted in the cleavage of β-1,4-glycosidic bonds within cellulose chains and reduction in the size of cellulose. In general, the size of IL-CCCNC decreased with increasing reaction temperature, but the impact was more remarkable at lower mass percent than at higher one. It was possible that hydrolysis reaction at low temperature was mainly associated with the dissolution of the cellulose matrix, and the breakage of internal glycosidic bonds was quite limited. At a higher temperature range, the reaction became more drastic, leading to significant reduction in the size of IL-CCCNC. Excessive thermal energy might lead to the remarkable disruption of intermolecular and intramolecular H-bonds as well as the glycosidic bonds of the lignocellulosic biomass, eventually releasing oligomers and other intermediate products with smaller sizes. However, elevated temperature would also break down cellulose molecules into low-molecular components like glucose, causing the loss of nanocellulose. Tan et al. (2015) noticed the decrease in the length and diameter of nanocellulose fibrils obtained from [Bmim][HSO4] hydrolysis when reaction temperature increased.14 It was hypothesized that the increasing temperature could have selectively removed the amorphous regions of cellulose, which facilitated the penetration of hydronium ions into the cellulose matrix at a higher rate. Consequently, the breakage of glycosidic bonds produced small cellulose crystallite fragments. However, another IL, [Bmim][OAc], exhibited a different trend, as the crystallite size slightly increased with increasing temperature from 70–110 °C.22
Mass percent of CC also had a profound influence on the dimension of IL-CCCNC. When the mass loading was greater than 2%, an increase in the size of IL-CCCNC was noticed. Excessive loading of CC substrate could have impeded the access of hydronium ions into the reactive sites of rigid cellulose matrix. As a result, the hydrolysis was incomplete and large-sized nanocellulose products were produced. The effect of different loading of cellulose substrate, from 5–25 wt%, on the IL hydrolysis of MCC was previously evaluated and reported by Low et al. (2020).17 MCC loading at 15 wt% was found to produce cellulose nanoparticles with the smallest crystallite size. At this substrate concentration, [HSO4]− was claimed to be optimal for the swelling and hydrolysis of cellulose to form nano-sized fibrils. High mass loading of substrate also increased viscosity of reaction mixture, which impaired the mobility of IL ions in cellulose fibres. In our study, the optimal mass percent of CC was estimated to be 2.49%, significantly lower than that of MCC. Understandably, CC still contained a certain amount of lignin (16.66 ± 0.30%) and hemicellulose (46.90 ± 1.17%), which dramatically increased the resistance of cellulose to IL hydrolysis.
From the obtained results, it was noted that the impact of mass percent and temperature on the size of IL-CCCNC does not follow predictable trends. Xiang et al. (2003) showed that cellulose hydrolysis is a complex process due to the heterogeneous nature of the reaction.35 The reaction is even more complicated when the reaction kinetics is dependent on temperature for only a specific range. Moreover, the hydrolysis of cellulose is strongly affected by the crystallinity, the state of swelling, and the disintegration of the substrate. The reaction can involve several pathways that produce soluble and insoluble oligomers, disaccharides, anhydro sugars, glucose, glucosides, etc. Therefore, it can be inferred that IL-CCCNC is the net product of all these hydrolysis and degradation processes. So far, the mechanisms and the exact pathways associated with IL-based hydrolysis of cellulose have not been completely understood. It was only known that elevated temperature could destabilize the H-bonds of cellulose and accelerate the cleavage of glycosidic bonds, resulting in increased hydrolysis of the molecules. However, high temperature can also cause significant loss of nanocellulose due to the conversion of cellulose into glucose and other by-products.
In Fig. 2B, the interactive effects of mass percent of CC and time tended to increase the dimension of IL-CCCNC. At 1.5 h, when the mass percent increased, the size of IL-CCCNC just varied from 350 to 410 nm. However, at a longer reaction time of 2.5 h, an increase in mass percent can result in nanocellulose product with significantly larger size. As discussed previously, IL-CCCNC is the net product of complex series of simultaneous hydrolysis and degradation reactions. In this case, extended reaction time and high mass percent could induce the release of large cellulose fragments or the formation of large oligomers, as reflected in the size of the products.
Unlike the other pairs of variables, the interactive effects of time and temperature (Fig. 2C) is more straightforward. At low temperature, increasing hydrolysis time decreased the size of IL-CCCNC. However, at 100 °C, as the reaction time increased from 1.5 to 2.5 h, the size of IL-CCCNC slightly increased from 230 nm to 330 nm. It was commonly known that the increasing temperature could disrupt the physical structure of cellulose,35 facilitating hydronium ion access into the cellulosic matrix, and consequently enhancing the hydrolysis process. However, as the reaction proceeds, some intermediate products form large hydrolysate complexes while others are degraded into smaller by-products. The nano-sized components obtained are net products of these processes. The underlying mechanisms of these reactions and their influence on the dimensions of hydrolyzed cellulose require further investigations.
3.2 Fourier transform infrared (FTIR)
FTIR spectra of CC, ACC, and IL-CCCNC are illustrated in Fig. 3A. Major functional groups of cellulose were identified at 890 cm−1 (β-glycosidic linkage of cellulose), 1034 cm−1 (C–O–C stretching vibration of pyranose ring), 1650 cm−1 (water absorbed in cellulose), 2900 cm−1 (C–H stretching of CH2), and 3400 cm−1 (free O–H stretching of cellulose). The results agree with those reported by Liu et al. (2016) and Tan et al. (2015) regarding CNC from [Bmim][HSO4] hydrolysis of MCC.14,33 In addition, the absorption bands around 1425, 1370, 1157, 1108, and 898 cm−1 typical of cellulose crystalline I are displayed by the raw and treated corncobs.11 Thus, the pre-treatment and hydrolysis did not affect important chemical structures of the cellulose from the raw CC. However, it was observed that in IL-CCCNC the peak at 3400 cm−1 was shifted to a lower wavenumber as compared to CC and ACC. The trend is ascribed to the weakening of the intra-chain hydrogen bond of cellulose due to IL hydrolysis.17 Moreover, the notable band 1250 cm−1 attributed to C–O stretching in the aryl-ether group of lignin and acetyl groups in hemicellulose diminished after pre-treatment and hydrolysis, indicating the capacity of the solvents to partially fractionate and remove non-cellulosic components of raw corncob.11 Furthermore, the peaks at 1732 cm−1, corresponding to C![[double bond, length as m-dash]](https://www.rsc.org/images/entities/char_e001.gif) O stretching of ester in hemicellulose groups, were no longer visible after alkaline pre-treatment and IL hydrolysis. The results coincide with chemical analysis, revealing significant removal of hemicellulose after pre-treatment and hydrolysis. The elimination of lignin and hemicellulose also facilitated the water absorption of cellulose, indicated by the peaks around 1650 cm−1 in ACC and IL-CCCNC.
O stretching of ester in hemicellulose groups, were no longer visible after alkaline pre-treatment and IL hydrolysis. The results coincide with chemical analysis, revealing significant removal of hemicellulose after pre-treatment and hydrolysis. The elimination of lignin and hemicellulose also facilitated the water absorption of cellulose, indicated by the peaks around 1650 cm−1 in ACC and IL-CCCNC.
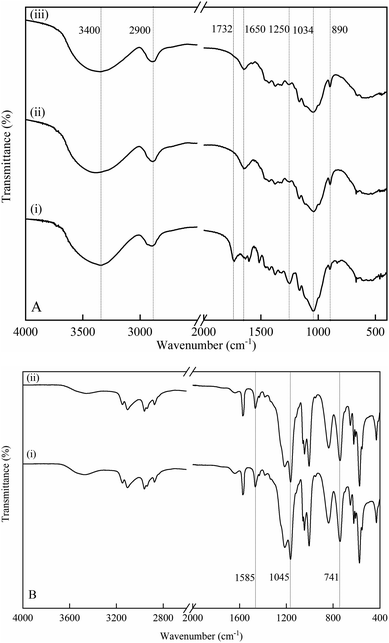 | ||
| Fig. 3 (A) Normalized FTIR spectrum of (i) CC, (ii) ACC, and (iii) IL-CCCNC. (B) Normalized FTIR spectrum of (i) pure [Bmim][HSO4] and (ii) regenerated [Bmim][HSO4]. | ||
FTIR spectroscopy also confirmed the successful recovery of [Bmim][HSO4] after reaction. As seen in Fig. 3B, the spectra of fresh and regenerated [Bmim][HSO4] are quite similar, with 91.16% matching determined by OMNIC software (Nicolet iS50, Thermo Scientific, USA). Signature peaks of [Bmim][HSO4] including 741 cm−1 (imidazole ring skeleton vibration), 1045 cm−1 ([HSO4]−), and 1585 cm−1 (C–H stretching vibration of CH2), were found in both spectra. The yield of recovered [Bmim][HSO4] was estimated to be 84.60 ± 0.61%, which is slightly lower than previous studies.14,17 This could be due to the difference in the regeneration steps used in this study compared to those reported. The recovery of [Bmim][HSO4] with its conserved chemical structure after the hydrolysis of CC enables its use as a green catalyst and solvent for nanocellulose production. The absence of these IL peaks in the spectra of IL-CCCNC also confirms the complete removal of IL from the nanocellulose suspension during dialysis.
3.3 X-ray diffraction analysis (XRD)
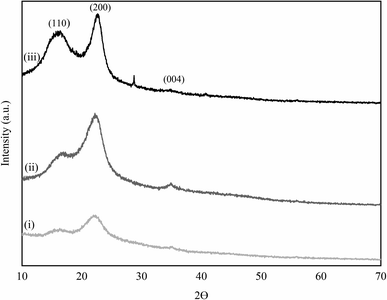
The crystallite structures of CC, ACC, and IL-CCCNC, analysed by XRD, are illustrated in Fig. 4. In all samples, the characteristic peaks of native cellulose I were found at 2θ values of 16°, 22°, and 34°, corresponding to the crystalline planes of 110, 200, and 004, respectively. The results show that the pre-treatment and IL hydrolysis used in this work did not alter the integrity of cellulose I structure, consistent with the previous results obtained by FTIR. Similar findings were reported by An et al. (2020), Harini & Chandra Mohan (2020), Liu et al. (2016), and Tan et al. (2015).14,33,36,37 It is worth noting that the diffraction peaks at 2θ = 22° in ACC and IL-CCCNC were slightly shifted to higher Bragg angles, which could be attributed to the decrease in distance between cellulose stacked sheets. Moreover, sharper peaks positioned at the 2θ value of 22° of ACC and IL-CCCNC as compared to CC suggested increased crystallinity of the obtained product. The obtained crystallinity index values of the samples are 26.3%, 39.4%, and 62.5% for CC, ACC, and IL-CCCNC, respectively, as presented in Table 2. CrI of IL-CCCNC is comparable to those of the CC nanocellulose produced by acid hydrolysis (sulfuric and formic acids), oxidative and mechanical methods which range from 49.9% to 63.8% (Table S4†).33 CrI results reconfirm that the crystallinity of CC was increased after pre-treatment and IL hydrolysis. For ACC and IL-CCCNC, enhancement of crystallinity could be attributed to the selective removal of amorphous regions within cellulose structures following alkaline treatment and [Bmim][HSO4] hydrolysis. In addition, significant reduction of lignin and hemicellulose attributable to pre-treatment, as revealed from chemical analysis (Table 1), could have improved the crystallinity of the obtained nanocellulose. Tan et al. (2015) ascribed the improvement of the crystallinity of nanocellulose after [Bmim][HSO4] treatment to the rearrangement of more ordered and crystalline structures.14 An increase in the crystallinity of IL-CCCNC can improve its thermal stability, mechanical, and barrier properties, which are essential for cellulose applications.| Sample | Crystallinity index (%) |
|---|---|
| CC | 26.3 |
| ACC | 39.4 |
| IL-CCCNC | 62.5 |
3.4 Scanning electron microscopy (SEM)
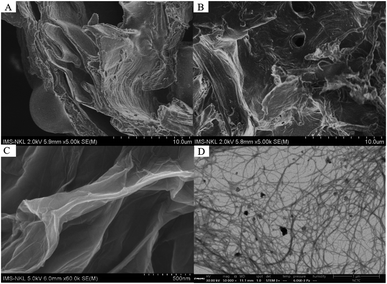
Fig. 5 illustrates the surface morphology of CC, ACC, and IL-CCCNC captured by SEM. The rough, irregular surface of CC (Fig. 5A) could be due to the presence of complex matrices composed of wax, pectin, hemicellulose, and lignin.11,20 The fibrillar, sheet-like structures could have resulted from the materials' arrangement of cellulose fibrils. Significant changes in surface morphology of CC were observed after alkaline treatment as shown in Fig. 5B. The surface became more uniform as lignin, hemicellulose, and other non-cellulosic constituents were removed. Defibrillation may have occurred in the process similar to the phenomenon observed by Kawee-ai et al. (2016).38 This structural modification could facilitate the access of IL to the cellulose matrix in the subsequent hydrolysis step. IL-CCCNC is characterized by smooth, thin, sheet-like structures. During IL hydrolysis, the amorphous regions are dissolved, and the glycosidic bonds of cellulose are cleaved.19 Cellulose fibrils are broken down and removed from compact stacks of cellulose, resulting in nanocellulose chains with a smaller diameter and shorter length.22 As IL-CCCNC was freeze-dried into the powder form, hydrogen bonds between adjacent nanocellulose molecules induced self-aggregation of cellulose nanofibers,33 forming the 2D sheet-like structures as seen in Fig. 5C. The structure of IL-CCCNC as a network of nanofibrils was also clearly observed under ESEM (Fig. 5D).3.5 Transmission electron microscope (TEM)
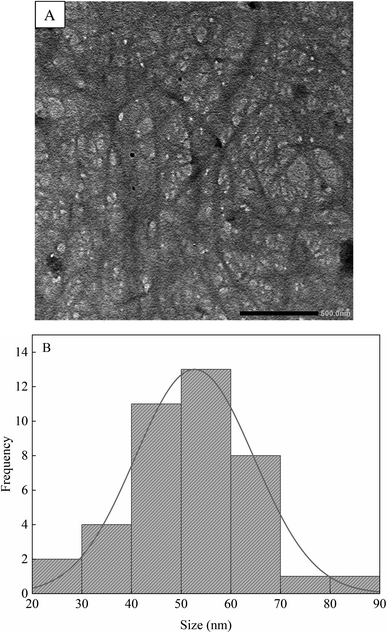
The structure of IL-CCCNC was further elucidated by TEM as presented in Fig. 6A. IL-CCCNC is found to form web-like nanofibrous, intertwined networks attributed to agglomerated cellulose fibrils or the natural structure of the plant cell wall.33 During [Bmim][HSO4] hydrolysis, the amorphous regions of cellulose are transversely cleaved, whereas the crystallite domains are unaffected.14 The process successfully reduces the CC cellulose fibrils to the nanoscale. The average diameter of IL-CCCNC was estimated to be about 52 nm (Fig. 6B), which is relatively close to the ones produced by sulfuric acid hydrolysis.28,33 The source of biomass can affect the size and shape of the nanocellulose products markedly. CNC extracted from the leaves of African baobab by [Bmim][HSO4] has the needle-shaped forms with size varying between 80–100 nm.25 In another study, nanocellulose produced by [Bmim][HSO4] hydrolysis of cotton linter has rod-like shape with diameter of 50–100 nm and length of 500–800 nm.23 In this study, measuring the length of individual fibres was difficult due to the formation of intertwined fibrous networks. However, the dimensions could be predicted as several micrometres in length. Therefore, the generated IL-CCCNC possessed high aspect ratio. Compared to the hydrodynamic size determined by the zeta sizer (Table S1†), the size of cellulose nanofibers estimated by TEM is closer to the actual size of the materials.3.6 Thermogravimetric analysis
Fig. 7A and B demonstrate the thermal stability of CC, ACC, and IL-CCCNC analyzed by TGA and DTG, respectively. All samples exhibited an initial weight loss at the temperature of about 100 °C, corresponding to water evaporation.14,33 Water is bound to cellulose due to the hydroxyl groups of anhydroglucose in the cellulose structure, which makes the material highly hydrophilic. The presence of water was confirmed by intermolecular hydrogen bonding at 1650 cm−1 in FTIR spectra. As the temperature increased, the decomposition range of CC, ACC, and IL-CCCNC were from 200–375 °C (Tmax = 333 °C; % weight loss = 6.80), 250–370 °C (Tmax = 347 °C; % weight loss = 4.48), and 210–355 °C (Tmax = 334 °C; % weight loss = 4.93), respectively (Table 3). The pyrolysis of CC and ACC was characterized by two degradation peaks (Fig. 7B), at 289 °C and 333 °C for CC, and 304 °C and 347 °C for ACC, respectively. The patterns of thermograms are typical of cellulosic biomass residues.11 Normally, cellulosic residues are decomposed into two phases. The first corresponds to the degradation of hemicellulose and possibly part of lignin. The Tmax of hemicellulose is about 280 °C, which is quite close to the Tmax of the first phase. Lignin was degraded from 200–600 °C and could be subjected to pyrolysis in this range of temperature.11,20 In the second phase, the decomposition of CC and ACC occurs at about 333 °C and 347 °C, close to the values reported by Araújo et al. (2019).11 As the pre-treatment and hydrolysis removed a significant amount of lignin and hemicellulose from CC, the degradation of IL-CCCNC was predominantly associated with cellulose pyrolysis. Fig. 7B reveals two decomposition peaks of IL-CCCNC at 265 °C and 334 °C. Low et al. (2020) ascribed the minor peak to the highly sulfated amorphous regions and the major one to the thermal degradation of cellulosic materials.17 Araújo et al. (2019) found that [Bmim][Cl], in combination with alkaline or liquid hot water, can convert the native cellulose (cellulose crystalline I) to an amorphous structure, which hampers its thermal stability.11 Low et al. (2020) reported similar findings, where MCC was found to be more thermally stable than nanocellulose.17 In this study, [Bmim][HSO4] hydrolysis seemed to slightly reduce the thermal stability of CC nanocellulose as compared to the original cellulosic biomass. The obtained nanocellulose (Table S4†) has a comparable thermal stability as those isolated by acid hydrolysis (Tmax = 267 °C),28 alkaline treatment (Tmax = 338 °C),39 and enzymatic hydrolysis (Tmax = 337 °C).40 The product can be used in manufacturing processes at temperatures above 200 °C, such as in the thermal processing of biodegradable plastics.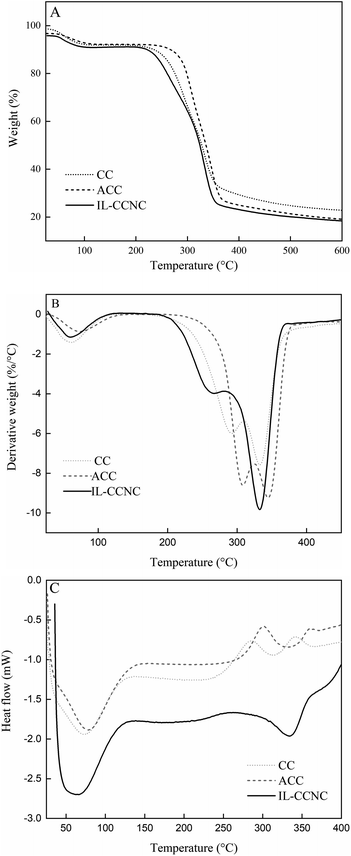 | ||
| Fig. 7 (A) TGA curves of CC, ACC and IL-CCCNC. (B) DTG curves of CC, ACC and IL-CCCNC. (C) DSC curves of CC, ACC and IL-CCCNC. | ||
| Sample | Tonset (°C) | Phase I | Phase II | ||
|---|---|---|---|---|---|
| Tmax (°C) | WL (%) | Tmax (°C) | WL (%) | ||
| CC | 188.0 | 289.1 | 6.80 | 332.6 | 69.09 |
| ACC | 233.0 | 304.1 | 4.48 | 347.1 | 73.16 |
| IL-CCCNC | 186.0 | 265.0 | 4.93 | 334.4 | 72.52 |
DSC analysis further demonstrated the effects of alkaline pre-treatment and IL hydrolysis on the thermal properties of CC cellulose. In Fig. 7C, the first endothermic peaks (66.0–77.6 °C) represent water evaporation from the matrix. At higher temperatures, the decomposition of CC and ACC went through different phases. As previously illustrated by TGA and DTG, the degradation of CC and ACC is complicated by the presence of different constituents (lignin, hemicellulose, cellulose) with different thermal stability. IL-CCCNC exhibited only one broad endothermic peak at 335 °C, resulting from the depolymerization of cellulose. DSC confirms the ability of IL hydrolysis to remove the lignin and hemicellulose from the matrix and to produce a relatively pure nanocellulose from CC.
4. Conclusions
Cellulose nanocrystals were successfully prepared from CC biomass via [Bmim][HSO4] hydrolysis. The IL-CCCNC has physicochemical properties comparable to those prepared by traditional alkaline and acid hydrolysis. The effects of process conditions on the size of hydrolysed products were evaluated. The reaction temperature and mass percent of CC significantly impacted the dimension of IL-CCCNC. Increasing temperature augmented the cleavage of hydrogen and glycosidic bonds of cellulose, yielding smaller nanocellulose particles. However, the biomass might be degraded into glucose and other by-products at high temperatures, resulting in the loss of cellulose. In this study, as the CC substrate still contained a certain amount of hemicellulose and lignin, an increase in mass percent remarkably influenced the size of nanocellulose. It is possible that excessive mass percent would increase the viscosity of the solution and impair the hydrolysis process. Therefore, appropriate mass percent should be considered to produce nanocellulose in the desirable range of dimensions. At the optimal conditions (2.49% mass percent, 100 °C, and 1.5 h), about 40.13% (dry mass) of IL-CCCNC is obtained from CC, with dimension of 166 nm. The solvent and catalyst [Bmim][HSO4] can be facilely recovered and reused after treatment. Industrial manufacturers can adopt the process to develop large-scale production of nanocellulose from lignocellulosic biomass via ionic liquid-mediated hydrolysis.Author contributions
Wanwipa Rasri: conceptualized; conducted experimental work and data analysis; drafted original manuscript. Vu Thi Thu: characterized properties of materials. Angelica Corpuz: analyzed and interpreted results; edited the manuscript. Loc Thai Nguyen: conceptualized; supervised the project; edited the manuscript.Conflicts of interest
There are no conflicts to declare.Acknowledgements
The authors gratefully acknowledge the financial support for the research by the Asian Institute of Technology (AIT).References
- D. Trache, A. F. Tarchoun, M. Derradji, T. S. Hamidon, N. Masruchin, N. Brosse and M. H. Hussin, Nanocellulose: From Fundamentals to Advanced Applications, Front. Chem., 2020, 8, 1–33 CrossRef PubMed.
- X. Yang, F. Han, C. Xu, S. Jiang, L. Huang, L. Liu and Z. Xia, Ind. Crops Prod., 2017, 109, 241–247 CrossRef CAS.
- M. K. M. Haafiz, A. Hassan, Z. Zakaria and I. M. Inuwa, Carbohydr. Polym., 2014, 103, 119–125 CrossRef CAS PubMed.
- H. M. Ng, L. T. Sin, T. T. Tee, S. T. Bee, D. Hui, C. Y. Low and A. R. Rahmat, Composites, Part B, 2015, 75, 176–200 CrossRef CAS.
- R. J. Moon, A. Martini, J. Nairn, J. Simonsen and J. Youngblood, Cellulose nanomaterials review: structure, properties and nanocomposites, Chem. Soc. Rev., 2011, 40, 3941–3994 RSC.
- K. Missoum, M. N. Belgacem and J. Bras, Materials, 2013, 6, 1745–1766 CrossRef PubMed.
- A. Pandey, A. Kalamdhad and Y. C. Sharma, Environ. Nanotechnol., Monit. Manage., 2023, 20, 100791 CAS.
- F. Zhang, R. Shen, N. Li, X. Yang and D. Lin, Carbohydr. Polym., 2023, 304, 120497 CrossRef CAS PubMed.
- Y. Sun, H. Zhang, Q. Li, B. Vardhanabhuti and C. Wan, RSC Adv., 2022, 12, 30030–30040 RSC.
- M. N. F. Norrrahim, N. A. M. Kasim, V. F. Knight, M. S. M. Misenan, N. Janudin, N. A. A. Shah, N. Kasim, W. Y. W. Yusoff, S. A. M. Noor, S. H. Jamal, K. K. Ong and W. M. Z. W. Yunus, RSC Adv., 2021, 11, 7347–7368 RSC.
- D. Araújo, M. Vilarinho and A. Machado, Ind. Crops Prod., 2019, 141, 111785, DOI:10.1016/j.indcrop.2019.111785.
- R. Kamel, N. A. El-Wakil, A. Dufresne and N. A. Elkasabgy, Int. J. Biol. Macromol., 2020, 163, 1579–1590 CrossRef CAS PubMed.
- S. Mateo, S. Peinado, F. Morillas-Gutiérrez, M. D. La Rubia and A. J. Moya, Processes, 2021, 9, 1594 CrossRef CAS.
- X. Y. Tan, S. B. A. Hamid and C. W. Lai, Biomass Bioenergy, 2015, 81, 584–591 CrossRef CAS.
- X. Y. Tan, Doctor dissertation, University of Malaya, 2016.
- M. G. Paredes, M. A. Mariño, R. A. Tapia, D. R. MacFarlane, K. Matuszek, D. Ruiz, M. Isaacs and P. Pavez, J. Mol. Liq., 2022, 367, 120422 CrossRef CAS.
- F. W. Low, N. A. Samsudin, Y. Yusoff, X. Y. Tan, C. W. Lai, N. Amin and S. K. Tiong, Thermochim. Acta, 2020, 684, 178484 CrossRef CAS.
- H. Wang, G. Gurau and R. D. Rogers, Chem. Soc. Rev., 2012, 41, 1519–1537 RSC.
- G. A. S. Haron, H. Mahmood, M. H. B. Noh and M. Moniruzzaman, J. Mol. Liq., 2022, 368, 120591 CrossRef.
- S. S. Mohtar, T. N. Z. T. M. Busu, A. M. M. Noor, N. Shaari and H. Mat, Carbohydr. Polym., 2017, 166, 291–299 CrossRef CAS PubMed.
- L. Sun, J. Y. Chen, W. Jiang and V. Lynch, Carbohydr. Polym., 2015, 118, 150–155 CrossRef CAS PubMed.
- N. A. Samsudin, F. W. Low, Y. Yusoff, M. Shakeri, X. Y. Tan, C. W. Lai, N. Asim, C. S. Oon, K. S. Newaz, S. K. Tiong and N. Amin, J. Mol. Liq., 2020, 308, 113030 CrossRef CAS.
- J. Huang, S. Hou and R. Chen, BioResources, 2019, 14, 7805–7820 CAS.
- H. S. Onkarappa, G. K. Prakash, G. H. Pujar, C. R. Rajith Kumar, M. S. Latha and V. S. Betageri, Int. J. Biol. Macromol., 2020, 160, 1021–1028 CrossRef CAS PubMed.
- Z. Z. Chowdhury, R. R. R. Chandran, A. Jahan, K. Khalid, M. M. Rahman, M. Al-Amin, O. Akbarzadeh, I. A. Badruddin, T. M. Y. Khan, S. Kamangar, N. A. Hamizi, Y. A. Wahab, R. Johan and G. A. Adebisi, Symmetry, 2019, 11, 1–20 CrossRef.
- A. M. d. C. Lopes, K. G. João, A. R. C. Morais, E. Bogel-Łukasik and R. Bogel-Łukasik, Sustainable Chem. Processes, 2013, 1, 3, DOI:10.1186/2043-7129-1-3.
- L. Li, C. Chen, R. Zhang, Y. He, W. Wang and G. Liu, Energy Fuels, 2015, 29, 5841–5846 CrossRef CAS.
- H. A. Silvério, W. P. F. Neto, N. O. Dantas and D. Pasquini, Ind. Crops Prod., 2013, 44, 427–436 CrossRef.
- G. Yan, Y. Zhou, L. Zhao, W. Wang, Y. Yang, X. Zhao, Y. Chen and X. Yao, Ind. Crops Prod., 2022, 183, 115005 CrossRef CAS.
- D. Araújo, M. C. R. Castro, A. Figueiredo, M. Vilarinho and A. Machado, J. Cleaner Prod., 2020, 260, 120865 CrossRef.
- J. Mao, B. Heck, G. Reiter and M. P. Laborie, Carbohydr. Polym., 2015, 117, 443–451 CrossRef CAS PubMed.
- J. Fan and Y. Li, Carbohydr. Polym., 2012, 88, 1184–1188 CrossRef CAS.
- C. Liu, B. Li, H. Du, D. Lv, Y. Zhang, G. Yu, X. Mu and H. Peng, Carbohydr. Polym., 2016, 151, 716–724 CrossRef CAS PubMed.
- R. Zare-Dorabei, M. S. Darbandsari, A. Moghimi, M. S. Tehrani and S. Nazerdeylami, RSC Adv., 2016, 6, 108477–108487 RSC.
- Q. Xiang, J. S. Kim and Y. Y. Lee, Appl. Biochem. Biotechnol., Part A, 2003, 106, 337–352 CrossRef PubMed.
- V. N. An, H. Thuc, C. Nhan, T. D. Tap, T. T. T. Van, P. V. Viet and L. V. Hieu, J. Polym. Environ., 2020, 28, 1465–1474 CrossRef.
- K. Harini and C. C. Mohan, Int. J. Biol. Macromol., 2020, 163, 1375–1383 CrossRef CAS PubMed.
- A. Kawee-ai, A. Srisuwun, N. Tantiwa, W. Nontaman, P. Boonchuay, A. Kuntiya, T. Chaiyaso and P. Seesuriyachan, Ultrason. Sonochem., 2016, 31, 184–192 CrossRef CAS PubMed.
- X. Luo and X. Wang, BioResources, 2017, 12, 5826–5837 CAS.
- B. Alonso-Lerma, L. Barandiaran, L. Ugarte, I. Larraza, A. Reifs, R. Olmos-Juste, N. Barruetabeña, I. Amenabar, R. Hillenbrand, A. Eceiza and R. Perez-Jimenez, Commun. Mater., 2020, 1, 57 CrossRef.
Footnote |
| † Electronic supplementary information (ESI) available. See DOI: https://doi.org/10.1039/d3ra02715e |
| This journal is © The Royal Society of Chemistry 2023 |

