 Open Access Article
Lead isotope analysis for provenancing ancient materials: a comparison of approaches†
Sarah De Ceuster a,
Dimitra Machairab and
Patrick Degryse
 *ab
*ab
aKU Leuven, Earth and Environmental Sciences, Celestijnenlaan 200E, 3001 Leuven, Belgium. E-mail: patrick.degryse@kuleuven.be
bLeiden University, Faculty of Archaeology, Einsteinweg 2, 2333 CC Leiden, The Netherlands
First published on 28th June 2023
Abstract
Lead isotope analysis has been used to determine the provenance of metals such as lead, silver and bronze for many decades. Nevertheless, different approaches to interpret lead isotopic ratios have been proposed. In this study, three methods to couple the lead isotopic signature of archaeological artefacts to their possible mineral resources will be compared: the conventional assessment of biplots, a clustering method combined with calculating model ages (as applied by F. Albarède et al., J. Archaeol. Sci., 2020, 121, 105194), and relative probability calculations using kernel density estimates (as proposed by De Ceuster and Degryse, Archaeometry, 2020, 62(1), 107–116). The three different approaches will be applied to a dataset of lead isotopic analyses of 99 Roman Republican silver coins previously analyzed, pointing to a primary origin of the silver in the mining regions of Spain, NW-Europe and the Aegean, but showing signs of mixing and/or recycling. The interpretations made through the different approaches are compared, indicating the strengths and weaknesses for each one. This study argues that, although the conventional biplot method gives valid visual information, it is no longer feasible due to ever growing datasets. Calculating the relative probabilities via kernel density estimation provides a more transparent and statistically correct approach that generates an overview of plausible provenance candidates per artefact. The geological perspective introduced in the cluster and model age method by F. Albarède et al., J. Archaeol. Sci., 2020, 121, 105194 broadens the analytical spectrum with geologically informed parameters and improved visualization. However, the results when applying their method as a stand-alone approach are of low resolution and may lose archaeological relevance. Their approach regarding clustering should be revised.
Introduction
Every element in the periodic system of the elements has been used at some time to compare the composition of mineral raw materials to that of archaeological artefacts, or to assign compositional groupings to archaeological objects. These ancient artefacts are direct proof of how human technology evolved, and the study of all stages involved in producing man-made materials (cf. chaîne opératoire studies, e.g. Gosden3) gives insight into the choices humans made during the life cycle of objects. The better we understand the different contexts in which people produced and used materials, from the acquisition of resources, over their transformation into objects and their use, to finally their recycling or abandonment, the more likely we are to understand the underlying socio-cultural practices of everyday life. A prime purpose in the analysis of archaeological materials has always been the study of the provenance and trade/exchange of objects and resources.After the introduction of lead isotope analysis (LIA) to provenancing in archaeological science (e.g. Brill and Wampler4), the method gained increasing prominence when Gale and Stos-Gale5 studied the provenance of Late Bronze Age (LBA) copper alloys. Traditionally, bivariate plots are used to assess the data, visually matching lead isotopic compositions of artefacts and ore deposits. Much debate has always been associated with the interpretation of LIA (e.g. Pollard6). It has been pointed out that most geographically and/or geologically distinct regions show overlap in their lead isotope ratios and that the lead isotope signature in a single region can be very broad. Furthermore, lead isotope ratios of an ore body or mining region are rarely normally distributed. Baxter et al.7,8 argued that assuming normality of lead isotope data leads to false graphical presentations, though the usual biplot approach was defended by Scaife et al.9 for provenancing purposes, again the cause of much debate.
Efforts to deal with the limitations of LIA are frequently made. The use of kernel density estimates (KDEs) was proposed to address the non-parametric distribution. Choosing the optimal parameters would be challenging, though, and the need for larger sample sizes for the ore sources was conveyed.7,8 De Ceuster & Degryse2 demonstrated kernel density estimation (KDE) as a method for provenancing purposes. The parameters chosen for calculating the KDEs were provisionally defined, but need further evaluation. Clearly, the main advantages of this method are that it tackles the assumption of normality and that it provides a mathematical, statistical basis for further calculations.
Another criticism of the use of LIA in archaeology has been the tendency to use isotope ratios as simple numbers that characterize an ore source, while these ratios evolve according to laws of radioactive decay and geochemistry.10 Albarède et al.1 use hierarchical cluster analysis to group samples, then examine the geochemical parameters per group, to assign each group to a Pb model age, thus trying to identify a potential ore source. They tested their method on a data set of 99 Roman Republican silver coins.11–13
This paper makes an in-depth comparison of three common methods used in assessing lead isotope data for archaeological provenancing purposes: the conventional bivariate plots, the cluster and model age method advocated by Albarède et al.1 and the KDE method proposed by De Ceuster and Degryse.2 Each method will be applied on the data set of 99 silver coins as used in Albarède et al.11 The paper also aims to define for each approach the advantages and disadvantages and to determine to what extent these methods contrast or complement one another.
Methodology
The ore database used in this study to compare artefacts to ores and mining regions was compiled from the literature. The database used by De Ceuster and Degryse2 was supplemented with additional data, now counting 200 mining regions and a total of 3640 lead ore samples.14 For each ore sample the three fundamental ratios measured in laboratory studies (208Pb/204Pb, 207Pb/204Pb and 206Pb/204Pb) are given. Only mining regions with a minimum of 20 ore samples were used for further calculations.As conventional biplots the 207Pb/204Pb vs. 206Pb/204Pb and the 207Pb/204Pb vs. 208Pb/204Pb ratios were displayed. These were then visually assessed per coin and per mining region. Often, in literature, confidence ellipses are added to these scatterplots as “ore fields”, assuming normality instead of the non-parametric distribution that is given,6–8 to then appraise which artefacts fall inside the ellipses on both plots. This assessment was performed here by checking if the measured values would lie within each confidence interval.
For the cluster and model age method, the same process was followed as proposed by Albarède et al.1 Before clustering the artefacts, their isotopic ratio data was whitened, i.e. decorrelated and standardized. In this paper, the ZCA transformation matrix was chosen in order to keep the whitened data as close as possible to the original measurements. For the hierarchical clustering Ward's linkage algorithm was applied with Euclidean distances. The resulting groups were then displayed in scatterplots, thus representing the relations between the geological parameters model age (Tm), κ (Th/U) and μ (U/Pb), and between different lead isotope ratios. These plots are then visually assessed.
For the KDE approach, the method advocated by De Ceuster and Degryse2 (Appendix 1†) was further developed.
The kernel density is estimated per region and per ratio in the following way. The estimator for a probability density function f(x) can be motivated as follows:
![[f with combining circumflex]](https://www.rsc.org/images/entities/i_char_0066_0302.gif) (x):
(x):where
 and
and  . Therefore:
is the theoretically optimal choice for h.15 Hence, the basic issue of finding an efficient bandwidth estimator boils down to finding a good estimate of R(f′′), the integrated squared second derivative of the density to be estimated. A popular bandwidth estimator with “reliably good performance for smooth densities in simulations”16 was proposed by Sheather and Jones.16 They included a bias term in their estimate of R(f′′) that had previously been omitted. The resulting bandwidth was applied to the KDEs in this paper. The second parameter that needs to be chosen is the kernel. The density estimator inherits its continuity and differentiability properties, so it was chosen in that respect as a positive and differentiable probability density. The theoretically optimal kernel, obtained by minimizing the AMISE where h is substituted by hAMISE, is the Epanechnikov kernel,17 but when applied,
![[f with combining circumflex]](https://www.rsc.org/images/entities/i_char_0066_0302.gif) (x) would not be infinitely differentiable. A commonly used continuous and differentiable kernel, which was also applied by De Ceuster and Degryse,2 is the Gaussian kernel. Its theoretical performance compared to the optimal Epanechnikov kernel is 95.1%, so very little efficiency is lost.
(x) would not be infinitely differentiable. A commonly used continuous and differentiable kernel, which was also applied by De Ceuster and Degryse,2 is the Gaussian kernel. Its theoretical performance compared to the optimal Epanechnikov kernel is 95.1%, so very little efficiency is lost.
For every coin in the assemblage (cf. Albarède et al.11) the measured lead isotope ratios are used to calculate the relative probability that this coin originates from each mining region. These results are then illustrated with a bar chart per region and per ratio for each coin, and assessed visually. Although this is a multidimensional setting, the choice was made to visually assess the calculated results per ratio, because adding dimensions enlarges the error in the estimated density function, particularly in this case of small sample sizes. This phenomenon is referred to in the literature as the curse of dimensionality.15
All calculations and plots are generated using RStudio, a free and open-source integrated development environment for R, a programming language for statistical computing and graphics. The R code used in this paper can be consulted in the Appendix 2.†
Results
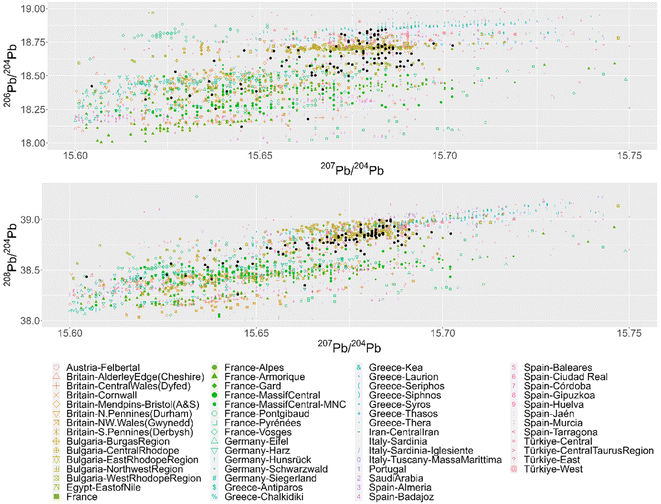
The three approaches were applied to a dataset of 99 Roman Republican silver coins.11–13 When these coins are plotted together with the mining regions in conventional bivariate plots (Fig. 1) it becomes clear that it is impossible to visually determine the provenance per coin, due to the size of the ore dataset and the high number of artefacts to analyze. The number of mining regions can be slightly reduced by deleting all regions that were never part of the Roman Empire and all regions of which the ore samples do not overlap with the coins on the biplots. The latter is less laborious using separate scatterplots per region (Appendix 3†). This excludes regions such as Central Iran, Saudi Arabia, Felbertal in Austria, Egypt – east of the Nile, the Pyrenees in France, Antiparos, Thera (Santorini) and Massa Marittima in Italy. The resulting graphs, however, are still equally complex to interpret. The conventional biplots per coin and per mining region (Appendix 4†), facilitate the visual assessment of the coincidence of the coin data point and the ore data points, resulting in the first column of the table in Appendix 5,† showing each mining region that gives a match per coin. Each coin is consistent with several regions, due to the overlap between the different regions and the broad distribution of some regions, with no indication which ones are more or less probable. Besides, examining these 11.088 plots is a very time-consuming task, subject to the visual decision of the researcher. For the confidence 95 ellipses (2σ) there are 34 coins that fall into the confidence intervals of all 3 ratios of the same mining region (Fig. 2). There is one coin with 3 possible mining regions, the other coins have one. For the confidence 99.7 ellipses (3σ) there are 84 coins with at least one matching mining region for this method. These results are listed in the table in Appendix 5.†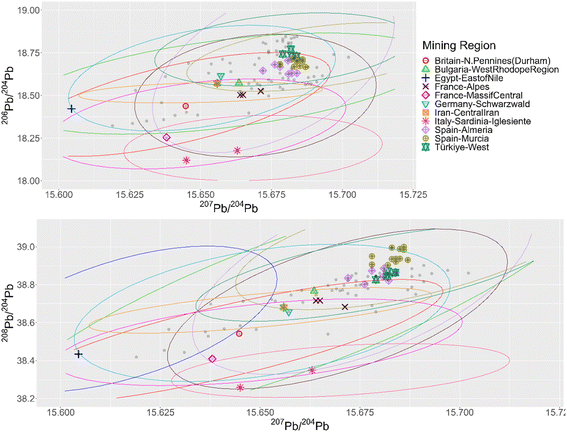 | ||
| Fig. 2 The confidence 95 ellipses of the mining regions that give a ‘match’ and the scatterplots of the coins (grey dots). The coins with a match are highlighted. | ||
Albarède et al.1 state that the practice of employing LIA to link every metal artefact separately with their ore source does not exploit all possibilities of the LIA dataset of the artefacts. In their paper they apply their method twice, once with 12 groups for which they argue it is too many and once with four groups for which they argue it is not enough. The groups are created for description purposes. The hierarchical cluster analysis, using Euclidean distances in the Ward linkage algorithm, of the coins dataset after whitening with the ZCA method results in six significant clusters. In a next step better ways to visualize these clusters are proposed. In the top left scatterplot of Fig. 3 a ‘mixing triangle’ can be identified where the vertices – clusters 2, 4, and 1 and 5 – represent the unmixed groups and the other clusters are probably the result of mixing and/or recycling. Lead isotope fractionation can be disregarded in ancient metallurgical processes,18 meaning the isotopic signature of the ore used is passed unchanged to metal coins. Care has to be taken, however, when ores are mixed (e.g. the separate addition of another metal such as lead), giving a mixed isotopic signature, or when different batches of silver are recycled together. Model ages, and μ and κ are added as valuable extra dimensions to the dataset (Fig. 3). Group 2 corresponds to young model ages associated with the Baetic orogeny. The vertex represented by group 4, with Mesozoic ages, probably relates to the hydrothermal activity that led to Pb–Zn deposits throughout Western Europe (e.g. Muchez et al.19 and Burisch et al.20). Groups 1 and 5 have Paleozoic model ages pointing to the Hercynian orogeny. Groups 3 and 6 plot within the ‘mixing triangle’ and might therefor represent mixed and/or recycled raw materials, which can be the result of a geological or an anthropological process. These groups and allocations can be consulted in the table in Appendix 5.† Albarède et al.1 conclude their case study by confirming the attained groups with histograms of the minting ages per group and suggesting that the Cenozoic source of silver mined throughout the Second Punic War was replaced by Mesozoic sources. Although this can be useful complementary information, this does not answer the provenance questions asked nor does it meet the desired archaeologically relevant resolution. A map of Pb model ages in Europe and the Mediterranean region compiled by Blichert-Toft et al.,21 using mainly lead ores, demonstrates that all model ages appearing in this dataset of coins occur on several locations throughout the area that was once the Roman Empire and beyond, though their abundance varies regionally. The conclusion thereby does not allocate possible ore sources, nor does it shed a light on human behavior, or the processes of production, consumption and possible exchange and/or trade.
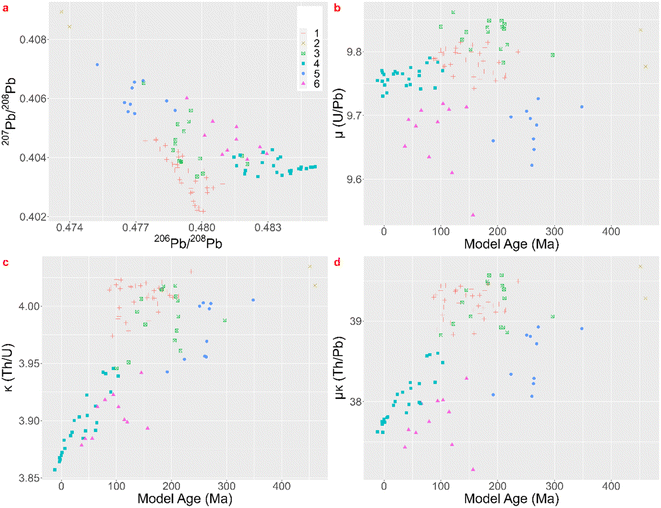 | ||
| Fig. 3 Lead isotope ratios and parameters Tm, μ and κ cfr. Albarède et al. 2020.1 | ||
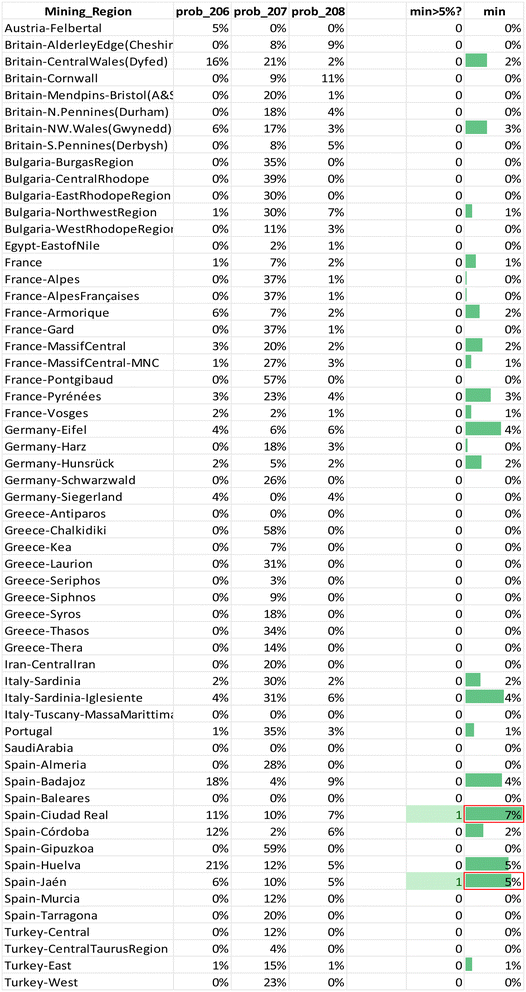
KDEs are a valid alternative to tackle the problem of non-parametric datasets. Per coin a bar chart is generated that shows the relative probability that the raw materials for that coin originate from a specific region per isotopic ratio. The regions where all three ratios are highest are potential source regions for the ores. These charts were visually divided in groups with a similar signature and further confirmed through inspection of the calculated probability tables (Appendix 6†). The regions for which the minimum probability is 5% for each ratio were highlighted together with the two highest minima (example Table 1). The names or descriptions of the groups are the regions with the highest relative probabilities, they are probable ore sources, not immediate answers. The first group of coins is consistent with a Spanish origin. One coin, sample R118, scores high on several Spanish regions in the southern half of Spain. Furthermore, there are two subgroups: one that points at an origin on the Balearic Islands for 10 samples, and a second one in Gipuzkoa in northern Spain for 9 samples with relatively high probabilities and another 7 samples with lower probabilities. The second group of 14 coins reveals a Northwestern European origin, though for most samples it is difficult to distinguish between the different regions in France, Britain and Germany. Three coins match with several of these Northwestern European regions. One coin, sample MS056, seems to find its origin in France: most likely in Armorica though the Pyrenees are also a likely candidate. The 10 other coins in this group show a high relative probability to have a Portuguese origin besides their high Northwestern European values. The third group of 19 coins indicates a Greek source. Seven coins match with multiple Greek regions: Chalkidiki, Laurion and Thasos. One coin, 22-Denarius-44-5, points to an origin in Chalkidiki, a second subgroup contains 6 coins that have a high relative probability for Chalkidiki and Thasos. The third subgroup for Greece includes 5 coins that seem to originate from the mines of Laurion. The fourth group consists of 4 Bulgarian subgroups: 3 coins imply a provenance in the Burgas region, 2 in the Central Rhodope region, one in the East Rhodope region and 2 in the West Rhodope region. A fifth group holds 13 coins that have a very similar signature and thus, very likely, have the same provenance. Their bar charts show higher relative probabilities for Bulgaria, Siphnos, Almeria in Spain and Türkiye. The sixth group contains 18 coins that have no clear signature. Two coins with very comparable signatures appear to originate in Iran, though they also have higher relative probabilities for France. These may be the result of the existence of the Silk Road, trading with the Parthian Empire. Five coins show quite low relative probabilities for Bulgaria and France, and 6 coins show equally low relative probabilities for Bulgaria and Türkiye. The last subgroup holds 5 coins, again with very similar bar charts that point to no specific region, they have a very low match almost everywhere. The reason these low probabilities occur might be the absence of the actual mining region in the database, or mixing and/or recycling.
Theoretically, every mining region with even the smallest relative probabilities for each ratio is a possible ore source, but a minimum probability of 5% was chosen for significance. For each coin the regions for which the minimum probability is 5% for each ratio were listed in the table in Appendix 5† as “matches”. Notice that this is often a subset of the visual biplot results. The reason why there are several matching regions is of course the overlap between them. The region with the highest probability for the 3 ratios was listed in the next column, though this is not necessarily the ore source. In the Greek group (3), for example, each coin – except for 22-Denarius-44-5 – matches with a combination of Chalkidiki, Thasos, Laurion and western Türkiye. The highest probabilities suggest a Greek provenance. The overlap plots for Greece (Fig. 4) show that it is impossible to differentiate between Chalkidiki and Thasos, which results in group 3b. Both ore sources have high probabilities for these coins and it is impossible to differentiate between them. However, to distinguish Laurion from them in group 3, it is interesting to inspect the orange 206Pb/204Pb probability bars on the bar charts, because that density plots next to the ones for Chalkidiki and Thasos (Fig. 4). This means that samples MS002 and MS006 can be added to group 3c, for which the ores were probably mined in Laurion. The utility of these overlap plots is further demonstrated for the Bulgarian group 4. As can be deduced from the overlap plot for the Bulgarian group (Fig. 5) the difference between Burgas and the others is easier made than between the eastern and central Rhodope region. One should also stay aware that any of these Bulgarian ores has a small chance to originate in the western Rhodope region, because of the broad variance of the ratios for this region. The samples in group 5 may not be easily allocated to a specific region, due to the overlap between the KDEs of the Bulgarian regions, the Turkish regions, Siphnos, and Almeria in Spain (Fig. 6). However, the 3-Victoriatus-44-1 and the R82 coins have a high probability to have their source in Siphnos, because of the high relative probability for 207Pb/204Pb.
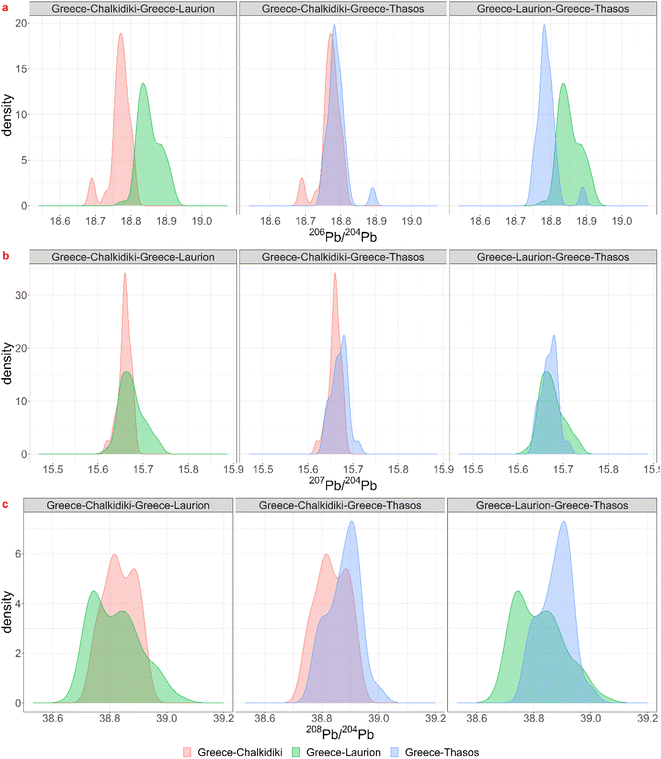 | ||
| Fig. 4 Visualization of the overlap between the lead isotopic KDEs for the three isotopic ratios for Chalkidiki, Thasos and Laurion in Greece. | ||
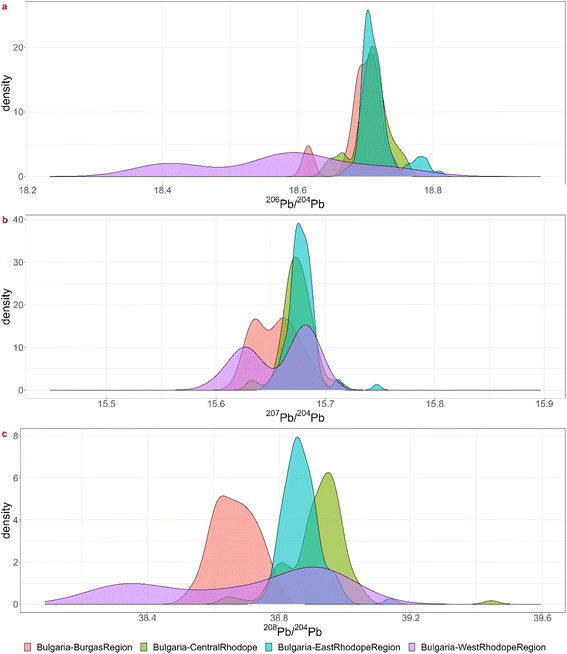 | ||
| Fig. 5 Visualization of the overlap between the lead isotopic KDEs for the three isotopic ratios for the Bulgarian mining regions. | ||
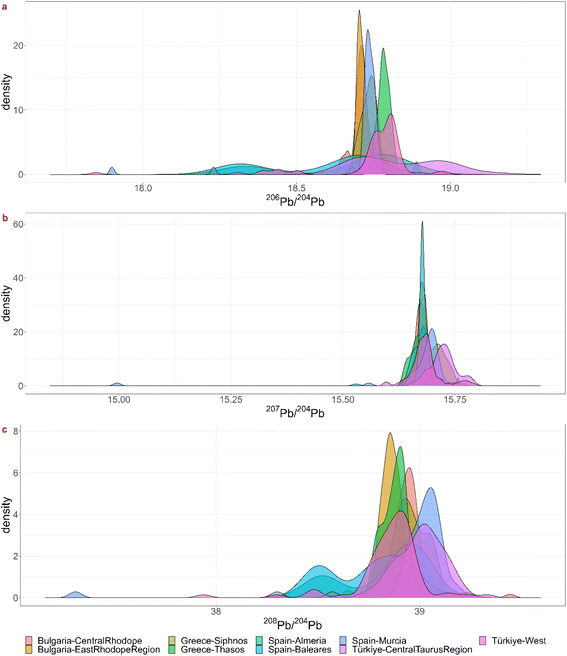 | ||
| Fig. 6 Visualization of the overlap between the lead isotopic KDEs for the three isotopic ratios for KDE group 5. | ||
Discussion
While the visual assessment of the conventional biplots yields results that are consistent with those of the KDE method, there are some obvious drawbacks to the former method. It is very time-consuming and subject to the expertise of the researcher. The resulting, often long list of possible ore sources per coin, without any information regarding their probability, is another clear disadvantage. The use of confidence ellipses, on the other hand, by presupposing normality, provides results that often differ from the visual inspection. There are, for example, almost no matches with Greek sources. While some allocations using confidence ellipses do correspond with the visual inspection, due to their distribution approaching the normal distribution, there are very few cases where the allocation matches the KDE method. Therefore, the assumption of normality is incorrect and the use of confidence ellipses should be abandoned.Albarède et al.1 advocate the use of all geological information contained in the samples analyzed and propose better visualization methods. Their results, however, have low resolution, linking the coins to an orogenic event, which makes their stand-alone usefulness questionable. The KDE-approach offers a higher-resolution image of the dataset, rendering ‘ore fields’ that match the isotopic ratios. The KDE overlap plots greatly contribute to the interpretation, though one should be mindful that low probability still is probability. However, since datasets grow it might not stay effective to assess every sample separately and to group them visually. A clustering method as suggested by Albarède et al.1 might be preferable to describe a dataset more efficiently, though Ward's linkage algorithm with Euclidean distances might not be the most suitable, even after whitening. To compare both methods further, the groups formed after visual inspection of the KDEs were represented as suggested by Albarède et al.,1 displaying a ‘mixing triangle’ and geological parameters Tm, μ and κ (Fig. 7). When compared to the same plots with the clusters formed cfr. Albarède et al.1 (Fig. 3), it is clear the groups formed by the cluster analysis of Albarède et al.1 are different from the ones composed through visually examining the KDE bar charts. Group Albarède-1 largely coincides with the Northwestern European KDE-group and group Albarède-2 partly corresponds with the Greek KDE-group. The other groups are dissimilar. Although this dataset contains 99 coins, which is a large dataset to assess manually and visually, it only provides a very small sample when taking the represented time span and geographic area into account. It is not unreasonable to assume that several of these coins do not belong to a cluster, but this is not supported by the applied clustering algorithm. A density based clustering method might then give a better outcome.
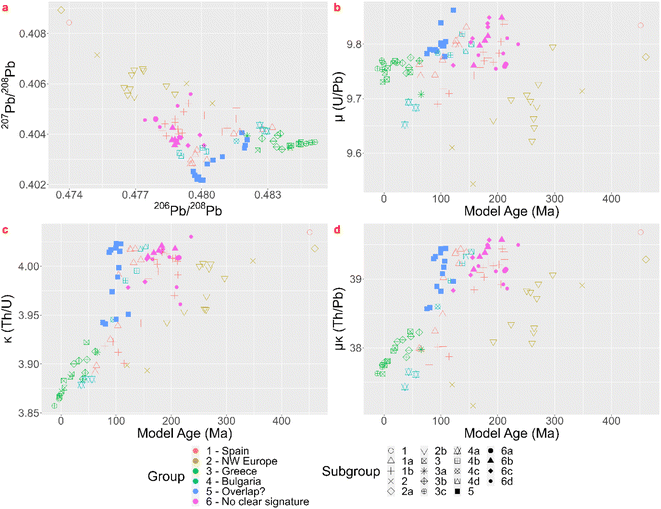 | ||
| Fig. 7 Lead isotope ratios and parameters Tm, μ and κ, visualized cfr. Albarède et al. (2020)1 with groups cfr. KDE method. | ||
Besides the comparison it might be interesting to explore whether the geological information promoted by Albarède et al.1 can be used to further discriminate between the results of the KDE approach or to confirm them. The ‘mixing triangle’ (Fig. 7a) implies that groups KDE-6b, 6c and 6d and the subset of group KDE-1b that plots together with group KDE-6, might be the result of mixing and/or recycling. This conclusion is supported by the KDE giving no matches for most of these coins. The other subset of KDE-1b has lower μ and κ values (μκ ≈ 38) and has younger model ages (Tm ≈ 100 Ma), so, combining the KDE bar charts, the ‘mixing triangle’, and maps of Pb model ages, μ and μκ in Europe and the Mediterranean region,20 Gipuzkoa region is a valuable candidate for their provenance. Group KDE-1a splits into 2 groups, a larger one with higher κ values and slightly older Tm, and 4 samples with lower κ values and younger Tm (Fig. 7c). Both groups might not originate on the Balearic Islands, because μκ ≥ 38. The larger group plots together with group KDE-4b-4c-4d and their KDE bar charts also show elevated relative probabilities for the Bulgarian Rhodope regions. Looking at the overlap between their lead isotopic KDEs (Fig. 8) it might be impossible to differentiate between both the Balearic Islands and the Rhodope regions, though the Tm and μκ support a Bulgarian origin. Group KDE-2b could be subdivided in a group with lower μκ and Tm and one with slightly higher μκ and Tm. However, both might originate in Portugal, France, Britain or Germany. In addition, this group isn't necessarily homogenous. In group KDE-2, 10-Denarius-53-2 and MS042 show low μκ and Mesozoic model ages, confirming the results of the KDEs. The third sample, 19-Denarius-112-2a, shows Paleozoic Tm and elevated μκ, and it has a high relative probability to find its origin in Germany (Siegerland) or in Britain (Northern Pennines or Alderley Edge). Looking at a map showing the geographic distribution of μκ,20 a British origin is more probable. For groups KDE-3-3b-3c the young model ages and 9.7 < μ < 9.8 are consistent with the Greek origins in Chalkidiki, Thasos and Laurion for those samples. In group KDE-4, subgroup KDE-4a has the lowest μκ values and young model ages, consistent with the Burgas region, the other subgroups have relatively high μκ values and Mesozoic Tm, supporting their origin in the Rhodope Mountains. The coins in group KDE-5 (Tm ≈ 100 Ma, μ > 9.77) seem to fall apart in several subgroups: one that forms the vertex in the ‘mixing triangle’ and has κ > 4, one with 3 samples measuring 3.97 < κ < 4, and 4 samples with κ ≈ 3.95, of which 2 samples with slightly older model ages and higher μ values. The high μ values and young model ages for most of the group KDE-5 coins seem to be present in the Central Taurus region in Türkiye, in western Türkiye, in southern Greece and in southern Spain.20 So, for this group it is not possible to narrow down the options obtained by the KDE method.
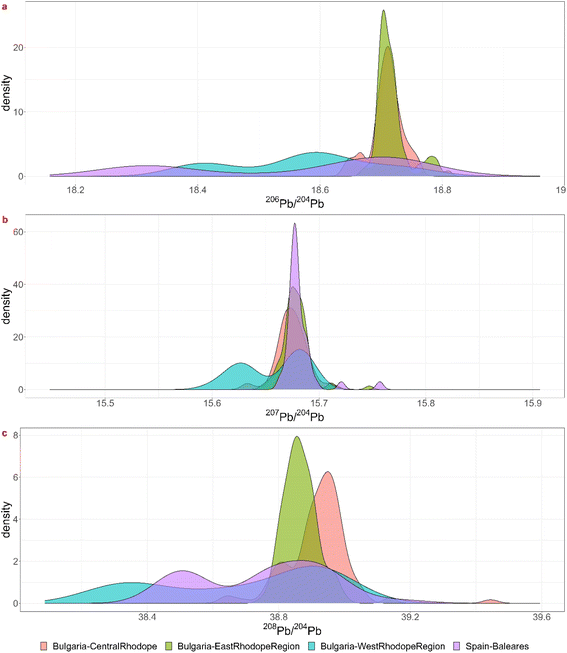 | ||
| Fig. 8 Visualization of the overlap between the lead isotopic KDEs for the three isotopic ratios for the Bulgarian Rhodope regions and the Balearic Islands. | ||
By combining the KDE approach, inspection of the overlap plots and the extra geological parameters advocated by Albarède et al.,1 extra information concerning the provenance can be derived from this dataset of coins. These results were also added to the table in Appendix 5.†
Conclusion
In this paper the possibilities and pitfalls of three methods used in assessing lead isotope data for archaeological provenancing purposes were discussed. The use of conventional bivariate plots of LI data is no longer feasible due to ever growing datasets. The use of confidence ellipses is mathematically incorrect. The geological perspective introduced in the cluster and model age method by Albarède et al.1 contributes substantially in terms of broadening the analytical spectrum with geologically informed parameters and improved visualization. However, the results for provenance determination when applying their method as a stand-alone approach are of low resolution and may lack archaeological relevance. Their approach regarding clustering should be revised. The KDE approach introduced by De Ceuster and Degryse2 offers a non-parametric solution for the illegible scatterplots due to growing datasets. It generates an overview of plausible provenance candidates per artefact. Moreover, joined with the overlap KDEs the bar charts gain interpretability and resolution. Still, overlap and broad variances complicate the allocation of samples to a specific region. Furthermore, one should beware of (false) positive allocations to the highest relative probability, as all mining regions that have a relative probability for the 3 ratios are possible ore sources. These results, however, when complemented with the geological parameters furthered by the cluster and model age approach, and visualized as advised by them, yield extra insights into the provenance of the samples under investigation. Of course, in any next stage of interpretation, the archaeological evidence should always be considered to further improve the resolution of the results obtained, like Albarède et al.1 complemented their results with minting dates. As mentioned before, the dataset studied here is relatively small to significantly reach any conclusions about coinage and material flow. Larger datasets are necessary and conjoined with this, a statistically valid method of clustering artefact assemblages. Internally meaningful assemblages, compiled to answer specific archaeological questions, could also considerably increase the significance of the results.Author contributions
Sarah De Ceuster: conceptualization, methodology, software, formal analysis, investigation, data curation, writing – original draft, writing – review & editing, visualization. Dimitra Machaira: formal analysis, investigation. Patrick Degryse: conceptualization, writing – review & editing, supervision, project administration, funding acquisition.Conflicts of interest
There are no conflicts to declare.References
- F. Albarède, J. Blichert-Toft, L. Gentelli, J. Milot, M. Vaxevanopoulos, S. Klein, K. Westner, T. Birch, D. Davis and F. de Callataÿ, A miner's perspective on Pb isotope provenances in the Western and Central Mediterranean, J. Archaeol. Sci., 2020, 121, 105194 CrossRef
.
- S. De Ceuster and P. Degryse, A ‘match–no match’ numerical and graphical kernel density approach to interpreting lead isotope signatures of ancient artefacts, Archaeometry, 2020, 62(1), 107–116 CrossRef CAS
.
- C. Gosden, Social Being and Time, Blackwell, 1994 Search PubMed
.
- R. H. Brill and J. M. Wampler, Isotope studies of ancient lead, Am. J. Archaeol., 1967, 71(1), 63–77 CrossRef CAS
.
- N. H. Gale and Z. A. Stos-Gale, Bronze age copper sources in the Mediterranean: a new approach, Science, 1982, 216(4541), 11–19 CrossRef CAS PubMed
.
- A. M. Pollard, What a long strange trip it's been: lead isotopes in archaeology, in From Mine to Microscope, ed. A. J. Shortland, et al., Oxbow Books, Oxford, 2009, pp. 181–189 Search PubMed
.
- M. J. Baxter, C. C. Beardah and R. V. S. Wright, Some archaeological applications of kernel density estimates, J. Archaeol. Sci., 1997, 24, 347–354 CrossRef
.
- M. J. Baxter, C. C. Beardah and S. Westwood, Sample size and related issues in the analysis of lead isotope data, J. Archaeol. Sci., 2000, 27, 973–980 CrossRef
.
- B. Scaife, P. Budd, J. G. McDonnell, A. M. Pollard and R. G. Thomas, A reappraisal of statistical techniques used in lead isotope analysis, in Archaeometry, 94, Proceedings of the 29th International Symposium on Archaeometry, ed. S. Demerci, A. M. Ozer and G. D. Summers, Tubitak, Ankara, 1996, pp. 301–307 Search PubMed
.
- F. Albarède, A. M. Desaulty and J. Blichert-Torft, A geological perspective on the use of Pb isotopes in archaeometry, Archaeometry, 2012, 54, 853–867 CrossRef
.
- F. Albarède, J. Blichert-Toft, M. Rivoal and P. Telouk, A glimpse into the Roman finances of the Second Punic War through silver isotopes, Geochem. Perspect. Lett., 2016, 2(2), 127–137, DOI:10.7185/geochemlet.1613
.
- A. M. Desaulty, P. Telouk, E. Albalat and F. Albarède, Isotopic Ag-Cu-Pb record of silver circulation through 16th-18th century Spain, Proc. Natl. Acad. Sci. U. S. A., 2011, 108, 9002–9007, DOI:10.1073/pnas.1018210108
.
- K. J. Westner, T. Birch, F. Kemmers, S. Klein, H. E. Höfer and H.-M. Seitz, Rome's Rise to Power: Geochemical Analysis of Silver Coinage from the Western Mediterranean (Fourth to Second Centuries BCE), Archaeometry, 2020, 62(3), 577–592, DOI:10.1111/arcm.12547
.
- S. De Ceuster and P. Degryse, Dataset of Lead Isotope Ratios of Lead Ores, KU Leuven RDR, 2023, V1, DOI:10.48804/D4DPLJ.
- M. P. Wand and M. C. Jones, Kernel Smoothing, Chapman and Hall, London, 1995 Search PubMed
.
- S. J. Sheather and M. C. Jones, A reliable data-based bandwidth selection method for kernel density estimation, J. R. Stat. Soc. Series B Stat. Methodol., 1991, 53, 683–690 Search PubMed
.
- V. A. Epanechnikov, Nonparametric estimation of a multidimensional probability density, Theory Probab. Its Appl., 1969, 13, 153–158 CrossRef
.
- J. Cui and X. Wu, An experimental investigation on lead isotopic fractionation during metallurgical processes, Archaeometry, 2011, 53(1), 205–214 CrossRef CAS
.
- P. Muchez, W. Heijlen, D. Banks, D. Blundell, M. Boni and F. Grandia, Extensional tectonics and the timing and formation of basin-hosted deposits in Europe, Ore Geol. Rev., 2005, 27, 241–267 CrossRef
.
- M. Burisch, G. Markl and J. Gutzmer, Breakup with benefits – hydrothermal mineral systems related to the disintegration of a supercontinent, Earth Planet. Sci. Lett., 2022, 250, 117373 CrossRef
.
- J. Blichert-Toft, H. Delile, C.-T. Lee, Z. Stos-Gale, K. Billstrom, T. Andersen, H. Hannu and F. Albarède, Large-scale tectonic cycles in Europe revealed by distinct Pb isotope provinces, Geochem., Geophys., Geosyst., 2016, 17, 3854–3864, DOI:10.1002/2016GC006524
.
Footnote |
| † Electronic supplementary information (ESI) available. See DOI: https://doi.org/10.1039/d3ra02763e |
| This journal is © The Royal Society of Chemistry 2023 |


