 Open Access Article
Thermoelectric properties of X3N2O2 (X = Hf, Zr) MXene monolayers: a first-principles study
Xinxin Yana,
Wei Cao *b and
Haohuan Li
 *a
*a
aDepartment of Orthopedics, Renmin Hospital, Wuhan University, Wuhan 430060, China. E-mail: lihaohuan@whu.edu.cn
bThe Institute of Technological Sciences, Wuhan University, Wuhan 430072, China. E-mail: wei_cao@whu.edu.cn
First published on 16th June 2023
Abstract
MXene monolayers have received increasing attention due to their unique properties, particularly their high conductivity, which shows great potential in thermoelectric materials. In this paper, we present a theoretical study of the thermoelectric properties of X3N2O2 (X = Hf, Zr) MXene monolayers, taking electron–phonon coupling into consideration. Owing to their similar geometrical structures, electronic band structures, and phonon dispersions, X3N2O2 MXene monolayers exhibit homogeneous electron and phonon transport properties. The conduction band shows multi-valley characteristics which leads to better n-type electron transport properties than p-type ones. The maximum values of the n-type power factor can reach 32 μW cm−1 K−2 for the Hf3N2O2 monolayer and 23 μW cm−1 K−2 for the Zr3N2O2 monolayer. In terms of phonon transport, the lattice thermal conductivity for the Zr3N2O2 monolayer is higher than that for the Hf3N2O2 monolayer, due to larger phonon group velocity. Our results show that the Hf3N2O2 monolayer is more suitable for thermoelectric materials than the Zr3N2O2 monolayer, with optimal n-type thermoelectric figure of merit (ZT) values of 0.36 and 0.15 at 700 K, respectively. These findings may be useful for the development of wearable thermoelectric devices and sensor applications based on X3N2O2 MXene monolayers.
1 Introduction
Two-dimensional (2D) materials are extensively researched due to their unique properties, such as high surface area,1 high conductivity,2 and tunable band gaps,3 which differ from their bulk counterparts. These properties make them promising materials for a wide range of applications, including electronics,4 energy storage,5 catalysis,6 and sensors.7 Furthermore, 2D materials can be easily integrated with other materials, making them a versatile platform for developing new technologies. Researchers continue to explore the potential of 2D materials and their applications, leading to exciting new discoveries and advancements in various fields. MXenes are a family of 2D transition metal carbides, nitrides, and carbonitrides. They were first discovered in 2011.8 The general formula for MXenes is Mn+1XnTx, where M is a transition metal, X is carbon or nitrogen, and T is a surface termination such as O, OH, F, and/or Cl.9 The structure of an MXene monolayer consists of layers of transition metal atoms stacked on top of each other, with the X and T atoms occupying the interstitial sites between them. The transition metal atoms are connected by covalent bonds, while the X and T atoms are connected to the transition metal atoms by ionic bonds. The MXene monolayer can be viewed as a sandwich structure, where the transition metal atoms form the bread and the X and T atoms form the filling. The sandwich structure can be peeled off layer by layer to produce MXene flakes, which have a thickness of a few nanometers.10 MXene monolayers usually possess high electrical conductivity,11 efficient absorption of electromagnetic waves,12 and tunable mechanical properties.13 Modifying the functionalized surfaces can be an effective way to modulate the properties of MXene monolayers.14 These unique properties make MXenes promising materials for a variety of applications.15–17Thermoelectric materials are a special type of material that can convert temperature differences into electrical energy and vice versa.18 The efficiency of a thermoelectric material is measured by its thermoelectric figure of merit, ZT.19 The higher the ZT value of a material, the more efficient it is in converting temperature differences into electrical energy. The thermoelectric figure of merit, ZT, is defined by the equation: ZT = S2σT/(κl + κe), where S is the Seebeck coefficient, σ is the electrical conductivity, T is the absolute temperature, and κl and κe are the lattice and electronic thermal conductivity, respectively. As mentioned previously, the high conductivity of MXenes makes them promising applications for thermoelectric materials. There have already been many studies on the thermoelectric properties of MXenes. For example, Kumar et al.20 investigated the electronic and thermal properties of different functionalizations in the Sc2C MXenes. They found that Sc2C(OH)2 possesses high electrical conductivity and relatively low lattice thermal conductivity, indicating it is a candidate for intermediate-temperature thermoelectric. Meanwhile, the role of functionalized surfaces on thermoelectric properties in M2C and M2N MXenes was also studied.21 The results showed that Mo2C can gain a large Seebeck coefficient. Flexible film electrodes have been designed using a ternary composite of Ti3C2Tx MXene.22 Recently, Rana et al. investigated the narrow bandgap Janus monolayer MoWCO2.23 The thermoelectric figure of merit was 0.33 (p-type) and 0.08 (n-type) at 700 K. Experimental work was also carried out, and the power factor (PF) of Mo2TiC2Tx film can reach 309 μW cm−1 K−2 at 800 K.24
However, the thermoelectric properties of the X3N2O2 MXene monolayer have not been studied yet. In this paper, we calculate these properties for X3N2O2 (X = Hf, Zr) using first principles and Boltzmann transport theory, including electron–phonon coupling. Our work provides a full understanding of the electron–phonon coupling on MXene monolayers with high accuracy, and can be expanded to the study of more thermoelectric materials.
2 Computational methods
All first-principles calculations were performed using density functional theory (DFT), as implemented in the Quantum ESPRESSO (QE) code.25,26 The exchange-correlated interactions were described using the generalized gradient approximation of the Perdew–Burke–Ernzerhof (GGA-PBE).27 The corresponding pseudopotential files were obtained from the Standard solid-state pseudopotentials (SSSP) libraries.28 The wave function was expanded using a plane-wave cutoff energy of 80 Ry. The Brillouin zone was sampled using an 11 × 11 × 1 k-point mesh according to the Monkhorst–Pack scheme.29 A vacuum slab of 15 Å was applied along the c-direction. The energy and force convergence thresholds were set to 10−10 Ry and 10−4 Ry, respectively, in order to fully relax the structure.Electrical transport coefficients were calculated using Boltzmann transport theory as implemented in the BoltzTraP code.30 Under the electron–phonon averaged (EPA) approximation,31 the carrier relaxation time (τe) was evaluated using the following equation:
 | (1) |
Here, ε is the energy of the carriers, μ is the chemical potential, Ω is the volume of the primitive unit cell, ℏ is the reduced Planck's constant, gs is the spin degeneracy, ν is the phonon mode index, gν2 is the averaged electron–phonon matrix, ![[small omega, Greek, macron]](https://www.rsc.org/images/entities/i_char_e0da.gif) × ν is the averaged phonon mode energy, n(
× ν is the averaged phonon mode energy, n(![[small omega, Greek, macron]](https://www.rsc.org/images/entities/i_char_e0da.gif) × ν, T) is the Bose–Einstein distribution function, f(ε +
× ν, T) is the Bose–Einstein distribution function, f(ε + ![[small omega, Greek, macron]](https://www.rsc.org/images/entities/i_char_e0da.gif) ν, μ, T) is the Fermi–Dirac distribution function, and ρ is the density of states per unit energy and unit volume. Details about this method can be found in the ref. 31.
ν, μ, T) is the Fermi–Dirac distribution function, and ρ is the density of states per unit energy and unit volume. Details about this method can be found in the ref. 31.
The value of κl is obtained by solving phonon Boltzmann transport theory, as implemented in the ShengBTE code.32 The second-order harmonic interatomic force constants (IFCs) were calculated by density functional perturbation theory (DFPT) using a supercell of 5 × 5 × 1. The third-order anharmonic IFCs were calculated using the finite displacement method with the same supercell. To obtain a convergent κl, a cutoff distance of up to the 9th nearest atomic neighbors was used. The q-point grid was set to 60 × 60 × 1, and the smearing parameter was set to 1.0.
3 Results and discussion
The geometrical structures of Hf3N2O2 and Zr3N2O2 monolayers are illustrated in Fig. 1(a) and (b), respectively. These monolayers possess a hexagonal crystal structure with a space group of P6/mmm. This space group has a six-fold rotational symmetry axis and mirror planes that intersect at the c-axis of the crystal. The optimized lattice constants of Hf3N2O2 and Zr3N2O2 monolayers are 3.210 Å and 3.245 Å, respectively. Their lattice constants are close, indicating that their bond strengths are similar.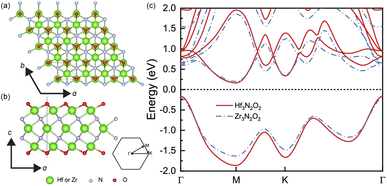 | ||
| Fig. 1 The crystal structure of Hf3N2O2 and Zr3N2O2 monolayer on the (a) top view and (b) side view. (c) The band structure of Hf3N2O2 and Zr3N2O2 monolayer. | ||
Fig. 1(c) shows a comparison of the band structures of Hf3N2O2 and Zr3N2O2 monolayers. The bands are similar, with the conduction band minimum (CBM) at the M point and the valence band maximum (VBM) at the K point. The band gap of Hf3N2O2 and Zr3N2O2 monolayers is 0.328 eV and 0.394 eV, respectively. The band gap of Hf3N2O2 is smaller than that of Zr3N2O2. Moreover, the conduction band has multiple valleys, while the valence band is relatively simple. The multiple valleys in the band result in a high density of states (DOS) and a high S value.
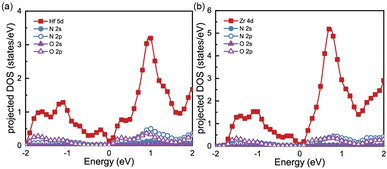
To gain a better understanding of the electronic properties of monolayers Hf3N2O2 and Zr3N2O2, we show their projected density of states (pDOS) in Fig. 2(a) and (b), respectively. This paper ignores the projected DOS for other orbitals due to their ultralow values. The pDOS of Hf3N2O2 is similar to that of Zr3N2O2, with the former mainly contributed by the Hf 5d electrons and the latter mainly contributed by the Zr 4d electrons. Furthermore, the DOS of Zr3N2O2 is higher than that of Hf3N2O2. The multiple valleys in the conduction band can be attributed to the Hf 5d or Zr 4d electrons.
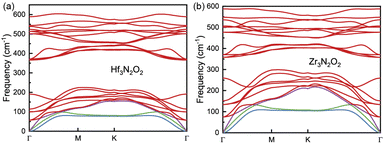
The phonon dispersion curves of Hf3N2O2 and Zr3N2O2 monolayers are shown in Fig. 3(a) and (b), respectively. It can be seen that the phonon dispersion curves of both monolayers are generally similar. Both Hf3N2O2 and Zr3N2O2 monolayers are dynamically stable due to the absence of imaginary modes. There is a clear band gap around 300 cm−1, with Hf3N2O2 monolayer exhibiting a wider gap than the Zr3N2O2 monolayer. The low frequency part (< 300 cm−1) of Hf3N2O2 monolayer is lower than that of Zr3N2O2 monolayer. The slopes of the acoustic modes (marked by another color) for Zr3N2O2 monolayer are larger than those of Hf3N2O2 monolayer. This suggests that Zr3N2O2 monolayer would exhibit larger phonon group velocity (vg), which will be further confirmed.
To analyze the thermoelectric transport properties, we first illustrate the absolute values of Seebeck coefficient (|S|) in Fig. 4(a) and (b). S can be attribute to the steep slope of the DOS,33 i.e., ∂n(ε)/∂ε. Owing the DOS peak in conduction caused by Hf 5d or Zr 4d electrons, the absolute values of n-type S are much higher than p-type ones. We fit the steep slope of the DOS between 0.2–0.7 eV, which corresponds to a moderate n-type carrier concentration. The fitted steep slopes of the DOS are 6.55 and 10.47 for Hf3N2O2 and Zr3N2O2, respectively. These values are consistent with the n-type |S| (62 and 138 μV K−1 for Hf3N2O2 and Zr3N2O2, respectively) at 300 K. At a moderate concentration (10−14 cm−2), n-type |S| can reach 200 μV K−1 at 700 K, while p-type |S| is only 30 μV K−1. The high n-type S implies that Zr3N2O2 monolayers are potential n-type thermoelectric materials. Additionally, the absolute values of p-type S are higher than those of n-type S.
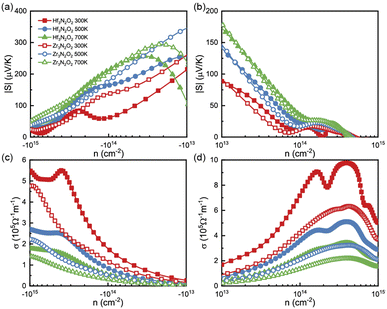 | ||
| Fig. 4 The (a), (b) |S| and (c), (d) σ as a function of carrier concentration for Hf3N2O2 and Zr3N2O2 monolayer. | ||
Since σ and κe are dependent on electronic relaxation time (τe), we need to analyze τe first. Fig. 5(a) and (b) show τe as a function of energy at various temperatures. Unlike the constant relaxation time approximation method and deformation potential theory, τe calculated by EPA depends firmly on the carrier density, which is more accurate. As energy approaches the Fermi level, τe increases. All X3N2O2 monolayers have much higher τe for holes than for electrons. We attribute this phenomenon to the more dispersive valence band than the conduction band. There are many conduction band valleys near the Fermi level, which scatter charge carriers more easily and lead to a lower τe for electrons. As temperature increases, charge carrier scattering becomes stronger and a lower τe is observed at higher temperatures.
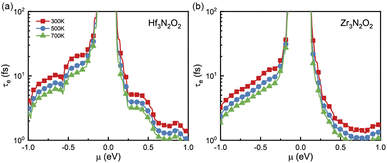 | ||
| Fig. 5 The electronic relaxation time (τe) of (a) Hf3N2O2 and (b) Zr3N2O2 monolayers as a function of the energy. | ||
Fig. 4(c) and (d) plot σ as a function of energy at different temperatures, based on τe. Contrary to S, the σ of n-type doping are much lower than that of their p-type doping. For a moderate concentration (10−14 cm−2), p-type σ for Hf3N2O2 monolayer can exceed 7 × 10⁵ Ω−1 m−1 at room temperature. As expected, σ increases for increasing higher carrier concentration. As temperature increases, σ decreases due to stronger carrier scattering, which is the same as τ. According to the Wiedemann–Franz law, κe is proportional to σ: κe = LσT, where L is the Lorenz number.34 Therefore, there is no need to analyze κe separately.
By combining the results of S and σ, we can determine the power factor (PF) of monolayers of X3N2O2, as shown in Fig. 6(a) and (b). The PF of the Hf3N2O2 monolayer is higher than that of the Zr3N2O2 monolayer. Additionally, the p-type PF is much lower than the n-type PF, indicating that X3N2O2 monolayers are more suited for n-type thermoelectric materials. Interestingly, the PF of the Zr3N2O2 monolayer reaches its maximum value at 300 K (23 μW cm−1 K−2) and decreases with temperature, while the PF of the Hf3N2O2 monolayer is weakly temperature-dependent. The n-type maximum PF values for Hf3N2O2 can reach 32 μW cm−1 K−2 at 500 K. For both materials, the maximum p-type PF values are half that of n-type.
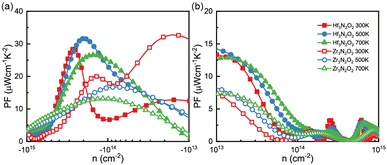 | ||
| Fig. 6 The (a) n-type nad (b) p-type power factor (PF) values as a function of carrier concentration for Hf3N2O2 and Zr3N2O2 monolayer. | ||
The phononic transport properties of X3N2O2 monolayers, including κl, Gruneisen parameter, phonon group velocity, and phonon relaxation time, are shown in Fig. 7(a)–(d). At room temperature, κl for Hf3N2O2 and Zr3N2O2 monolayer is 14.5 and 16 W mK−1, respectively. As with other crystalline materials, κl decreases as temperature increases, following a 1/T dependence. Higher temperature causes intrinsic enhancement in phonon–phonon scattering. With temperature increasing to 700 K, κl for Hf3N2O2 and Zr3N2O2 monolayer decreases to 5.55 and 6.18 W mK−1 which is relatively acceptable for thermoelectric applications.
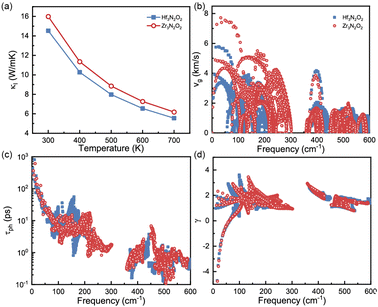 | ||
| Fig. 7 (a) κl, (b) phonon group velocity, (c) phonon lifetime, and (d) Gruneisen parameter for Hf3N2O2 and Zr3N2O2 monolayer. | ||
It can be noticed that κl for Hf3N2O2 monolayer is always lower than that of Zr3N2O2 monolayer. κl is determined mainly by phonon group velocity (vg) and phonon relaxation time (τph), as κl ∝ vgτph. The vg for Zr3N2O2 monolayer is higher than that of Hf3N2O2 monolayer for low frequency part (<300 cm−1) as shown in Fig. 7(b). The vg at Γ point can reach 8 km s−1 for Zr3N2O2 monolayer, while the corresponding vg of Hf3N2O2 monolayer is 6 km s−1. For high frequency part (>300 cm−1), vg for X3N2O2 monolayers are similar. This can be confirmed by the phonon dispersion curves in Fig. 3, as vg = ∂ωλ,q/∂q. Different from vg, τph for X3N2O2 monolayers are close, as plotted in Fig. 7(c). Especially for low frequency (<50 cm−1), τph for X3N2O2 monolayers are nearly the same. We further analyze the Gruneisen parameter (γ). γ reflects the anharmonic scattering strength35 which is given by γ = −(V/ωλ,q)∂ωλ,q/∂V. Larger |γ| means stronger anharmonicity and phonon–phonon scattering. Obviously, γ for X3N2O2 monolayers are basically the same, as shown in Fig. 7(d). The difference in vg caused by phonon dispersions is the main reason for lower κl of Hf3N2O2 monolayer than Zr3N2O2 monolayer, while τph and anharmonic scattering strength for X3N2O2 monolayers are similar.
Combining with calculated PF and κl, we calculated the ZT values as a function of n as plotted in Fig. 8(a) and (b). X3N2O2 monolayers exhibit higher n-type ZT values than p-type ones. Additionally, the ZT values of Hf3N2O2 monolayer are higher than those of Zr3N2O2 monolayer. For n-type Hf3N2O2 monolayer, ZT values present an behavior of monotonically increasing with temperature and optimal n gradually move to the low concentration. More specifically, maximum ZT values can reach 0.36 at 700 K. For p-type Hf3N2O2 monolayer, ZT values are relatively low and the optimal n is around 1020 cm−3. The maximum ZT value for n-type Zr3N2O2 monolayer is 0.15 at 700 K. Although all X3N2O2 monolayers exhibit high power factors (PF), their final ZT values are relatively low due to their high κl. Future work should focus on reducing κl to improve the ZT values. For example, alloying with other elements to reduce the phonon group velocity and/or increasing the phonon scattering strength by introducing defects or nanostructures.
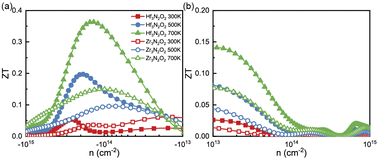 | ||
| Fig. 8 The (a) n-type and (b) p-type ZT values as a function of carrier concentration for Hf3N2O2 and Zr3N2O2 monolayer. | ||
4 Conclusions
In this paper, we studied the thermoelectric properties of the X3N2O2 (X = Hf, Zr) MXene monolayers using first-principles calculations and Boltzmann transport theory. To obtain accurate electrical transport properties, we took electron–phonon coupling into consideration. We found that Hf3N2O2 and Zr3N2O2 monolayers have similar structures, band structures, and phonon dispersions. The narrow band gap (0.3 eV) ensures high electrical conductivity. The Hf3N2O2 monolayer exhibits a better power factor and lower lattice thermal conductivity than the Zr3N2O2 monolayer. The maximum ZT value achieved for n-type Hf3N2O2 monolayer at 700 K is 0.36.Author contributions
X. Y. and W. C. conceived the study. W. C. performed the calculations and analyzed the data. X. Y. and H. L. wrote, reviewed, and edited the manuscript. All authors have read and agreed to the published version of the manuscript.Conflicts of interest
There are no conflicts to declare.Acknowledgements
This research was funded by the Fundamental Research Funds for the Central Universities: 2042022kf1078 and the Knowledge Innovation Program of Wuhan-Basic Research (No. 2022020801010473).References
- C. Anichini, W. Czepa, D. Pakulski, A. Aliprandi, A. Ciesielski and P. Samorì, Chem. Soc. Rev., 2018, 47, 4860–4908 RSC.
- F. Wu, H. Tian, Y. Shen, Z.-Q. Zhu, Y. Liu, T. Hirtz, R. Wu, G. Gou, Y. Qiao, Y. Yang, C.-Y. Xing, G. Zhang and T.-L. Ren, Adv. Mater. Interfaces, 2022, 9, 2200409 CrossRef CAS.
- X. Bao, Q. Ou, Z.-Q. Xu, Y. Zhang, Q. Bao and H. Zhang, Adv. Mater. Technol., 2018, 3, 1800072 CrossRef.
- Y. Pang, Z. Yang, Y. Yang and T.-L. Ren, Small, 2020, 16, 1901124 CrossRef CAS PubMed.
- L. Lin, J. Chen, D. Liu, X. Li, G. G. Wallace and S. Zhang, Adv. Energy Mater., 2020, 10, 2002621 CrossRef CAS.
- F. R. Fan, R. Wang, H. Zhang and W. Wu, Chem. Soc. Rev., 2021, 50, 10983–11031 RSC.
- L. Zhang, K. Khan, J. Zou, H. Zhang and Y. Li, Adv. Mater. Interfaces, 2019, 6, 1901329 CrossRef.
- M. Naguib, M. Kurtoglu, V. Presser, J. Lu, J. Niu, M. Heon, L. Hultman, Y. Gogotsi and M. W. Barsoum, Adv. Mater., 2011, 23, 4248–4253 CrossRef CAS PubMed.
- B. Anasori, M. R. Lukatskaya and Y. Gogotsi, Nat. Rev. Mater., 2017, 2, 16098 CrossRef CAS.
- Y. Gogotsi and B. Anasori, ACS Nano, 2019, 13, 8491–8494 CrossRef CAS PubMed.
- D. H. Ho, Y. Y. Choi, S. B. Jo, J.-M. Myoung and J. H. Cho, Adv. Mater., 2021, 33, 2005846 CrossRef CAS PubMed.
- C. Cui, R. Guo, E. Ren, H. Xiao, M. Zhou, X. Lai, Q. Qin, S. Jiang and W. Qin, Chem. Eng. J., 2021, 405, 126626 CrossRef CAS.
- B. C. Wyatt, A. Rosenkranz and B. Anasori, Adv. Mater., 2021, 33, 2007973 CrossRef CAS PubMed.
- X.-H. Zha, K. Luo, Q. Li, Q. Huang, J. He, X. Wen and S. Du, Europhys. Lett., 2015, 111, 26007 CrossRef.
- Y. Liu, J. Yu, D. Guo, Z. Li and Y. Su, J. Alloys Compd., 2020, 815, 152403 CrossRef CAS.
- M. Seredych, C. E. Shuck, D. Pinto, M. Alhabeb, E. Precetti, G. Deysher, B. Anasori, N. Kurra and Y. Gogotsi, Chem. Mater., 2019, 31, 3324–3332 CrossRef CAS.
- M. Zohair, K. Moyer, J. Eaves-Rathert, C. Meng, J. Waugh and C. L. Pint, ACS Nano, 2020, 14, 2308–2315 CrossRef CAS PubMed.
- N. Jia, J. Cao, X. Y. Tan, J. Dong, H. Liu, C. K. I. Tan, J. Xu, Q. Yan, X. J. Loh and A. Suwardi, Mater. Today Phys., 2021, 21, 100519 CrossRef CAS.
- G. J. Snyder and E. S. Toberer, Nat. Mater., 2008, 7, 105–114 CrossRef CAS PubMed.
- S. Kumar and U. Schwingenschlögl, Phys. Rev. B, 2016, 94, 035405 CrossRef.
- M. Khazaei, M. Arai, T. Sasaki, M. Estili and Y. Sakka, Phys. Chem. Chem. Phys., 2014, 16, 7841–7849 RSC.
- S. Wei, J. Ma, D. Wu, B. Chen, C. Du, L. Liang, Y. Huang, Z. Li, F. Rao, G. Chen and Z. Liu, Adv. Funct. Mater., 2023, 33, 2209806 CrossRef CAS.
- G. Rana, R. Gupta and C. Bera, Appl. Phys. Lett., 2023, 122, 063902 CrossRef CAS.
- H. Kim, B. Anasori, Y. Gogotsi and H. N. Alshareef, Chem. Mater., 2017, 29, 6472–6479 CrossRef CAS.
- P. Giannozzi, S. Baroni, N. Bonini, M. Calandra, R. Car, C. Cavazzoni, D. Ceresoli, G. L. Chiarotti, M. Cococcioni, I. Dabo, A. D. Corso, S. de Gironcoli, S. Fabris, G. Fratesi, R. Gebauer, U. Gerstmann, C. Gougoussis, A. Kokalj, M. Lazzeri, L. Martin-Samos, N. Marzari, F. Mauri, R. Mazzarello, S. Paolini, A. Pasquarello, L. Paulatto, C. Sbraccia, S. Scandolo, G. Sclauzero, A. P. Seitsonen, A. Smogunov, P. Umari and R. M. Wentzcovitch, J. Phys.: Condens. Matter, 2009, 21, 395502 CrossRef PubMed.
- P. Giannozzi, O. Andreussi, T. Brumme, O. Bunau, M. B. Nardelli, M. Calandra, R. Car, C. Cavazzoni, D. Ceresoli, M. Cococcioni, N. Colonna, I. Carnimeo, A. D. Corso, S. de Gironcoli, P. Delugas, R. A. DiStasio, A. Ferretti, A. Floris, G. Fratesi, G. Fugallo, R. Gebauer, U. Gerstmann, F. Giustino, T. Gorni, J. Jia, M. Kawamura, H.-Y. Ko, A. Kokalj, E. Küçükbenli, M. Lazzeri, M. Marsili, N. Marzari, F. Mauri, N. L. Nguyen, H.-V. Nguyen, A. O. de-la Roza, L. Paulatto, S. Poncé, D. Rocca, R. Sabatini, B. Santra, M. Schlipf, A. P. Seitsonen, A. Smogunov, I. Timrov, T. Thonhauser, P. Umari, N. Vast, X. Wu and S. Baroni, J. Phys.: Condens. Matter, 2017, 29, 465901 CrossRef CAS PubMed.
- J. P. Perdew, K. Burke and M. Ernzerhof, Phys. Rev. Lett., 1996, 77, 3865–3868 CrossRef CAS PubMed.
- G. Prandini, A. Marrazzo, I. E. Castelli, N. Mounet and N. Marzari, npj Comput. Mater., 2018, 4, 72 CrossRef.
- H. J. Monkhorst and J. D. Pack, Phys. Rev. B, 1976, 13, 5188–5192 CrossRef.
- G. K. Madsen and D. J. Singh, Comput. Phys. Commun., 2006, 175, 67–71 CrossRef CAS.
- G. Samsonidze and B. Kozinsky, Adv. Energy Mater., 2018, 8, 1800246 CrossRef.
- W. Li, J. Carrete, N. A. Katcho and N. Mingo, Comput. Phys. Commun., 2014, 185, 1747–1758 CrossRef CAS.
- J. Mao, Z. Liu and Z. Ren, npj Quantum Mater., 2016, 1, 16028 CrossRef.
- R. Venkatasubramanian, E. Siivola, T. Colpitts and B. O'Quinn, Nature, 2001, 413, 597–602 CrossRef CAS PubMed.
- D. A. Broido, A. Ward and N. Mingo, Phys. Rev. B, 2005, 72, 014308 CrossRef.
| This journal is © The Royal Society of Chemistry 2023 |

