 Open Access Article
Potential of non-thermal discharge plasmas for activated sludge settling: effects and underlying mechanisms
Yun Chena,
Siqi Liua,
Zhiyin Rencd,
Qi Wangcd,
Ying Zhangb,
Yajie Zuocd,
Jian Zhoucd,
Hongtao Jiae and
Tiecheng Wang *cd
*cd
aNingxia Houde Environmental Protection Technology Co., Ltd, Yinchuan 750000, China
bCollege of Information Science and Technology, Nanjing Forestry University, Nanjing 210037, China
cCollege of Natural Resources and Environment, Northwest A&F University, Yangling, Shaanxi Province 712100, PR China. E-mail: wangtiecheng2008@126.com
dKey Laboratory of Plant Nutrition and the Agri-environment in Northwest China, Ministry of Agriculture, Yangling, Shaanxi 712100, PR China
eCollege of Resources and Environment, Xinjiang Agricultural University, Urumqi 830052, China
First published on 4th July 2023
Abstract
With increase in the construction of urban sewage treatment plants, the output of sludge also surges. Therefore, it is highly important to explore effective ways to reduce the production of sludge. In this study, non-thermal discharge plasmas were proposed to crack the excess sludge. High sludge settling performance was obtained, and the settling velocity (SV30) dramatically decreased from the initial value of 96% to 36% after 60 min of treatment at 20 kV, accompanied by 28.6%, 47.5%, and 76.7% decreases in mixed liquor suspended solids (MLSS), sludge volume index (SVI), and sludge viscosity, respectively. Acidic conditions improved the sludge settling performance. The presence of Cl− and NO3− slightly promoted the SV30, but CO32− has adverse effects. ·OH and O2˙− in the non-thermal discharge plasma system contributed to the sludge cracking, especially for ·OH. These reactive oxygen species destroyed the sludge floc structure; as a result, the total organic carbon and dissolved chemical oxygen demand obviously increased, the average particle size of the sludge decreased, and the number of coliform bacteria was also reduced. Furthermore, the microbial community abundance and diversity both decreased in the sludge after the plasma treatment.
1. Introduction
The activated sludge process is one of the most widely used biological wastewater treatment technologies in the world. It has the advantages of low investment, high efficiency, and mature application.1–3 With increasing construction of urban sewage treatment plants, the output of sludge also surges. It was reported that the annual sewage treatment capacity reached 52.5 billion m3 in 2019, and the excess sludge production was also up to 263 million m3.3 The excess sludge is a bacterial micellar plume composed of microorganisms, insoluble organic matter, inorganic suspended substances, and colloidal substances in wastewater, which contains a large amount of water (more than 90%)1,3 and has poor chemical stability.4 In addition, there are a large number of toxic and harmful substances in the excess sludge, such as parasite eggs, viruses, pathogens, heavy metal ions, and refractory organic pollutants. These harmful substances can cause serious risks to human health and ecological environment through various ways. It is currently a hot topic to effectively treat and dispose the excess sludge in the international environmental field.Adjusting its production process reasonably and realizing sludge reduction from the source is considered to be an effective way to solve the problem of excess sludge. In recent years, some sludge reduction technologies based on uncoupling metabolism, biological predation, and the enhancement of microbial recessive growth have been proposed.5–8 Among them, the sludge reduction technology that enhances microbial recessive growth has attracted wide attention. It utilizes various cytolytic technologies to kill bacteria quickly and decompose them into a matrix that can be in turn used by other bacteria to finally realize sludge reduction.7,8 The commonly used cytolytic techniques mainly include physical methods such as heating and ultrasonic strengthening,9,10 chemical methods such as ozonation, chlorination, and acid–base adjustment11–13 and biological treatment.14 The process of cytolysis via heating easily worsens the flocculation of bacteria and produces a lot of foam. The cost of ultrasonic treatment is relatively high, and the sludge reduction performance is usually not satisfied. Chloroform and other harmful byproducts will be produced in the process of chlorination of excess sludge. Ozonation can effectively achieve sludge reduction, but the residual ozone affects the microbial activities in the subsequent biochemical treatment of wastewater. The reaction of ozone with bromine ions in the wastewater will also produce dangerous bromate. Acid–base adjustment cytolysis corrodes the equipment and increases the operation cost due to the addition of a large number of acid and base reagents. The use of microorganisms with specific functions can enhance sludge cytolysis, but it is difficult to screen, acclimate, and improve the specific bacteria. Therefore, it is of great practical significance to explore other efficient methods for sludge reduction.
Discharge plasmas use an advanced oxidation technology integrating photochemistry and electrochemical oxidation, which has been widely concerned in the field of water sterilization and disinfection.15–17 Under the action of an applied electric field, high-energy electrons generated by the high electric field bombard gas molecules to produce a large number of reactive oxygen species (such as 1O2 and ·OH), which can break the cell wall of bacteria and cause death. Kang et al.18 inactivated Salmonella typhimurium by the discharge plasma and found that the reactive oxygen species attacks played a decisive role. Ching et al.19 and Gupta et al.20 used the discharge plasma to treat Escherichia coli in water, and found that ultraviolet light participated in the generation of the reactive oxygen species and thus contributed to the inactivation of Escherichia coli. These previous studies mainly focused on the inactivation of bacteria in water by the discharge plasma, but paid little attention to the sludge lysis. In addition, it was reported that the discharge plasma can decompose protein fibers into small molecules in aqueous solutions.21 Organic matter that is difficult to biodegrade in water can also be oxidized into biodegradable small molecules by the discharge plasma to improve subsequent bioavailability.22,23 In our recent study, we have found that the discharge plasma can lead to release of cell-bound water in the excess sludge, and thus improve the dehydration performance.24 However, the effects of the discharge plasma on sludge settling performance and its potential mechanisms remain unclear.
Based on this, the discharge plasma was proposed to crack and reduce the excess sludge. First, the effects of the discharge plasma treatment on the settling performance were assessed under different operating conditions including voltage, sludge mixture pH, and coexisting inorganic ions. Then, changes in the properties of the sludge supernatant and sludge solid phase during the discharge plasma treatment were characterized. Subsequently, the roles of the reactive oxygen species in sludge settling were evaluated. Finally, the changes in the microbial community in sludge and coliform numbers were also monitored. It is expected to provide an alternative option for sludge reduction.
2. Experimental section
2.1 Sludge sampling and reagents
The sludge used in the experiment was sampled from the sludge reflux pump unit of a sewage treatment plant in Yangling, Shaanxi Province, China. The sewage treatment plant adopts the A2/O process to treat approximately 40![[thin space (1/6-em)]](https://www.rsc.org/images/entities/char_2009.gif) 000 m3 of sewage per day. After collection, the sludge was stored at 4 °C. Before use, the sludge mixture was mixed thoroughly and returned to normal temperature. The pH of the original sludge used in the experiment was 6.9–7.1, the mixed liquor suspended solids (MLSS) was 5630 mg L−1, the settling velocity (SV30) was 96%, and the dissolved chemical oxygen demand (SCOD) was 46.8 mg L−1. Guaranteed reagents isopropanol (IPA) and p-benzoquinone (BQ) were bought from Shanghai Maclin Biochemical Technology Co., LTD. Magnetic bead method soil genomic DNA extraction kit was bought from Shanghai Shengong Biological Engineering Co., LTD.
000 m3 of sewage per day. After collection, the sludge was stored at 4 °C. Before use, the sludge mixture was mixed thoroughly and returned to normal temperature. The pH of the original sludge used in the experiment was 6.9–7.1, the mixed liquor suspended solids (MLSS) was 5630 mg L−1, the settling velocity (SV30) was 96%, and the dissolved chemical oxygen demand (SCOD) was 46.8 mg L−1. Guaranteed reagents isopropanol (IPA) and p-benzoquinone (BQ) were bought from Shanghai Maclin Biochemical Technology Co., LTD. Magnetic bead method soil genomic DNA extraction kit was bought from Shanghai Shengong Biological Engineering Co., LTD.
2.2 Discharge plasma system for sludge cracking
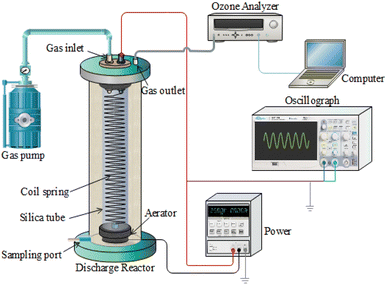
The experimental setup of the discharge plasma system for sludge treatment is shown in Fig. 1, which is similar to our previous study.17 The sludge cracking experimental setup included a high-voltage discharge system and a sludge cracking vessel. The power supply used in this study was a high-voltage AC purchased from Dalian University of Technology, China. The voltage range was 0–30 kV and the frequency was 50 Hz. A stainless steel spring was used as the high-voltage discharge electrode (diameter 1 cm, pitch 0.8 cm, and length 10 cm), which was inset closely in a quartz glass tube (diameter 1 cm, wall thickness 1 mm, and length 15 cm). The ground electrode consisted of the sludge mixture and a conductive wire. From the upper end of the quartz glass tube, dried air passing through a silica column was pumped. When a high voltage was applied, the high-voltage electric field ionized the air to produce various reactive oxygen species. These reactive oxygen species would enter the sludge mixture through an aerator at the lower end of the quartz glass tube. The sludge cracking vessel was a quartz glass tube (inner diameter 4 cm, wall thickness 2 mm, and length 25 cm). Then, 200 mL of sludge mixture was treated in each experiment. The ventilation rate was stabilized at 60 L h−1. After treatment, all the sludge mixture was taken out to measure various indexes. All tests and measurement were paralleled three times.2.3 Analytical methods
The SV30 of sludge was measured as follows. After the discharge plasma treatment, 100 mL of sludge mixture was sampled and placed in the measuring cylinder. After settling for 30 min, the volume of precipitated sludge divided by the total volume of the sludge mixture was the SV30.25 The MLSS was measured by a constant weight method.25 The sludge volume index (SVI) was calculated by the ratio of SV30/MLSS. The sludge mixture was centrifuged in a centrifuge at a speed of 5000 rpm for 15 min, and the supernatant was filtered through a 0.45 μm filter membrane. SCOD in the obtained filtrate was measured by a potassium dichromate oxidation method.11,12 The sludge viscosity was determined using a miniature digital display viscometer (NDJ-8S, Shanghai Youyi Instrument Co., LTD.). A field emission scanning electron microscope (SEM, S-4800, Hitachi) was used to observe the surface morphology of the sludge. The particle size of the sludge was analyzed using a laser particle size analyzer (APA2000, Malvern). The total organic carbon (TOC) of the sludge was monitored using a total organic carbon analyzer (TOC MultiN/CUV, Germany).A Miseq sequencing platform (Shanghai Sangong Bioengineering Co., LTD) was used to conduct 16S rRNA high-throughput sequencing for microorganisms in the sludge and water phase. The E.Z.N.A™ Mag-Bind Soil DNA Kit was used to extract DNA from 0.5 g fresh sludge samples following the manufacturer's instruction. According to the selected sequencing region, highly specific primers with Barcode were used for two-round PCR amplification of the target sequence, and the PCR products were purified for library construction and quality inspection. Ion S5™XL was used for computer sequencing. Three bioparallel tests were performed for each treatment condition. V3–V4 regions were selected for amplification with primers 341F: CCTACGGGNGGCWGCAG and 805R: GACTACHVGGGTATCTAATCC. All the clean reads obtained from the second-generation sequencing were clustered into Operational Taxonomic Units (OTUs) with 97% consistency, and the representative sequences of each OTU were screened out and compared with the RDP database for species annotation. The coverage index was used to analyze the depth of sequencing, and the Chao index and ACE index were used to analyze the abundance of microbial flora. The diversity of microbial flora was analyzed by the Shannon index and Simpson index. The R language was used to analyze the differences in the composition of different microbial communities.
3. Results and discussion
3.1 Effects of discharge voltage on sludge settling
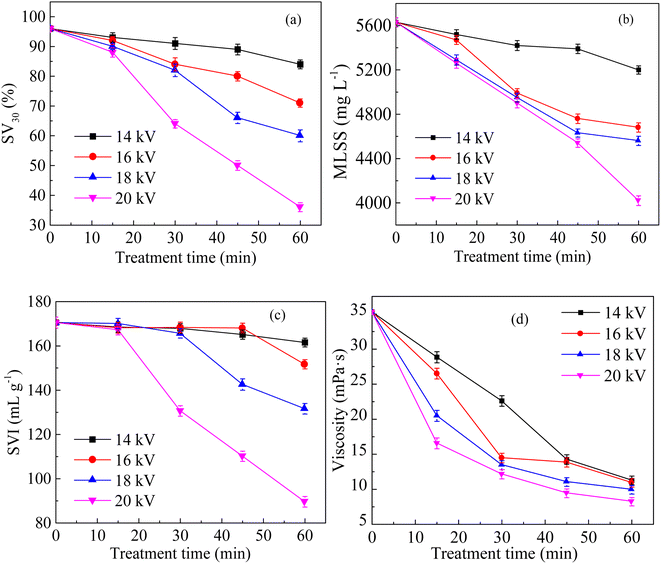
Fig. 2a shows the variation in SV30 with treatment time at different discharge voltages. Under the same treatment time, the SV30 value decreased significantly with the increase in discharge voltage. When the voltage increased from 14 kV to 20 kV, the SV30 value decreased from 84% to 36% after 60 min of treatment. Fig. 2b shows the variation in MLSS with treatment time at different discharge voltages. MLSS decreased with the increase in discharge voltage. When the discharge voltage was 14 kV, the MLSS concentration decreased to 5200 mg L−1 after 60 min of treatment, and the reduction rate was 7.6%. When the voltage was 20 kV, the MLSS concentration decreased to 4020 mg L−1 after 60 min of treatment, and the reduction rate was 28.6%. Fig. 2c shows the changes in SVI with the processing time at different voltages. After the discharge plasma treatment, the SVI decreased gradually. When the voltage was 14 kV, the SVI was 161.54 mL g−1 after 60 min of treatment, and the reduction rate was only 3.79%. When the voltage was 20 kV, the reduction rate of the SVI was 47.48%. It is generally believed that low viscosity means weak water retention ability.26 Fig. 2d shows the changes in sludge viscosity with the treatment time at different voltages. The viscosity of sludge decreased with the increase in voltage. When the voltage was 14 kV, the sludge viscosity was 11.27 mPa s after 60 min of treatment, whereas it decreased to 8.23 mPa s at 20 kV. These phenomena were similar to the conclusions of previous studies.27 With the increase in discharge voltage and the extension of discharge treatment time, a large number of strong oxidizing reactive oxygen species were generated, which destroyed the structure of the sludge floc.28 Along with the cracking of the sludge floc, a large number of organic matter and water were released from the sludge floc and microbial cells into the aqueous phase, resulting in a reduction in MLSS and an increase in floc density, which improved the settling performance of sludge.293.2 Effects of sludge mixture pH on sludge settling
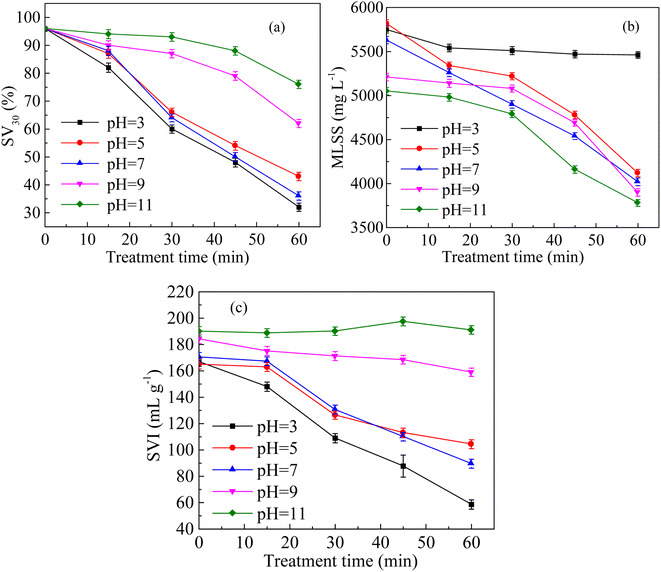
The solution pH affects the solubility of organic molecules including proteins and polysaccharides,30 as well as the cytolysis.31 Fig. 3a shows the changes in SV30 with the treatment time under different pH conditions. The acidic condition improved the sludge settling performance. The SV30 value was 32% after 60 min of treatment at a sludge pH of 3, and it was 76% at pH 11. Fig. 3b shows the variation in MLSS with the treatment time under different pH conditions. The MLSS was 5460 mg L−1 after 60 min of discharge treatment under the condition of pH 3, and the decrease rate was only 5.04%. At pH 11, the MLSS decreased to 3780 mg L−1 after 60 min of treatment, with a decrease rate of 32.86%. The acidity and alkalinity affected the osmotic pressure and extracellular polymeric substance decomposition in cells. Protein would condense under acidic conditions, increasing the MLSS concentration.13 Fig. 3c shows the changes in SVI with the treatment time under different pH conditions. Acidic conditions significantly improved the SVI. When the pH was 3, the SVI decreased from the original value 166.96 to 58.61 mL g−1 after 60 min of treatment, and the sludge settling performance was significantly improved. However, the SVI was almost unchanged after 60 min of treatment at pH 11.3.3 Effects of coexisting ions on sludge settling
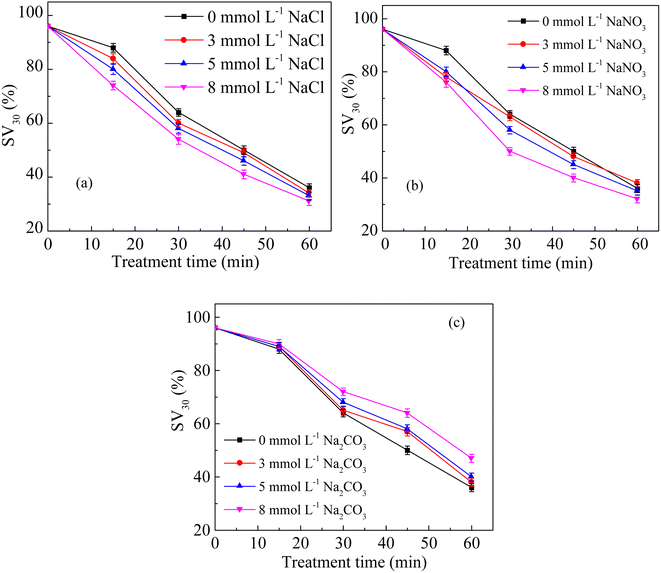
Fig. 4a shows the changes in SV30 with the treatment time at different Cl− concentrations. The higher concentration of Cl− increased the sludge settling performance. When the concentration of Cl− increased from 0 to 8 mmol L−1 in the sludge, the SV30 decreased from 36% to 31% after 60 min of treatment. The presence of Cl− enhanced the degradation rate of pollutants.32 Cl− could react with ·OH to form Cl· and OH−, and Cl· further induced the formation of hypochlorous acid, which reacted with hydrogen peroxide to form singlet oxygen.33 The singlet oxygen had a strong oxidation ability, which could oxidize sludge cells to crack them and improve the settling performance.11,12 Fig. 4b shows the changes in SV30 with the treatment time at different NO3− concentrations. Similar to the effect of Cl−, SV30 was also slightly improved with the increase in NO3− concentration. When the concentration of NO3− increased from 0 to 8 mmol L−1, SV30 decreased from 64% to 50% after 30 min of treatment. Nitrate could react with ·O to produce ·OH and ; the oxidation potential of
  was 2.30–2.60 V, promoting the inactivation of bacteria.34,35
 | (1) |
Fig. 4c shows the changes in SV30 with the treatment time at different CO32− concentrations. The addition of CO32− inhibited the sludge settling performance. When the concentration of CO32− increased from 0 to 8 mmol L−1, SV30 increased from 36% to 47% after 60 min of treatment discharge. Previous studies have reported that CO32− could react with ·OH and consume it, and the reaction rate constant was about 4.0 × 10⁸ M−1 s−1.36 These reactions produced less active radical CO3˙−.37 Rommozzi et al.34 also found that the presence of CO32− had a negative effect on the removal of E. coli by photo-Fenton oxidation.
| CO32− + ·OH + H+ → H2O + CO3˙− k = 4.0 × 10⁸ M−1 s−1 | (2) |
3.4 Changes in the properties of sludge supernatant and sludge solid phase
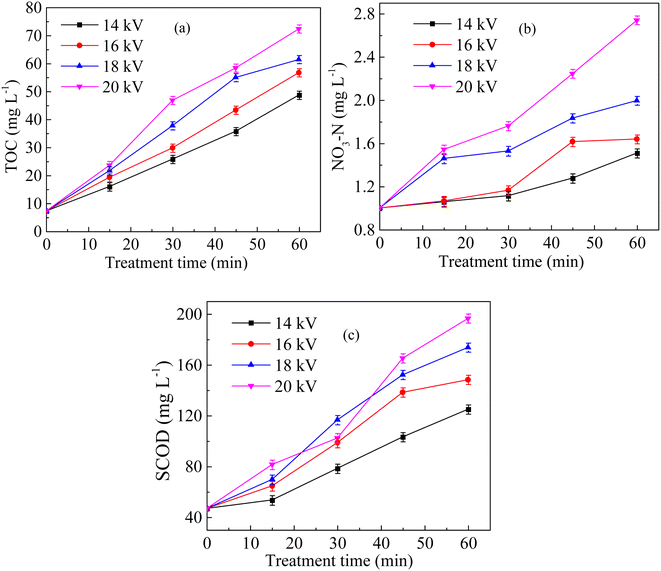
Fig. 5a shows the changes in TOC of sludge supernatant with the discharge treatment time at different voltages. The TOC of the sludge supernatant increased with the discharge voltage. The TOC was 48.71 mg L−1 after 60 min of treatment when the voltage was 14 kV, and the increase rate was 47.01%. At 20 kV, TOC rapidly increased to 72.4 mg L−1 after 60 min of treatment, and the increase rate reached 67.39%. As shown in Fig. 5b, the concentration of NO3−–N increased with the voltage, and it was 2.74 mg L−1 after 60 min of treatment at 20 kV. Fig. 5c shows the variation in SCOD with the treatment time at different voltages. The SCOD of the sludge supernatant increased with the treatment time and voltage. When the voltage increased from 14 to 20 kV, SCOD increased from 125 to 196.67 mg L−1 after 60 min of the discharge treatment. The sludge floc contained proteins, glycans, nucleic acids, etc. Under the action of the discharge plasma, the sludge floc would be destroyed, and the extracellular polymer substances and intracellular organic matter would be released into the liquid phase, increasing the TOC and SCOD.28,29 Similar phenomena have also been observed previously, where the sludge floc was destructed by the ozonation and electrochemical-Fenton oxidation, leading to the promotion of sludge disintegration.38,39Fig. 6 shows the SEM image of the sludge after 60 min of discharge treatment at various voltages. The raw sludge before treatment was mainly composed of filamentous bacteria with complete and dense structures. After the discharge plasma treatment, the surface structure of the sludge changed greatly, the sludge structure tended to be loose, the sludge floc was disintegrated and cracks appeared, and some small particles were formed. The strong oxidizing reactive oxygen species produced in the discharge plasma system destroyed the microbial cells and the massive floc structure of the sludge, promoting the release of organic matter and water inside the floc from the mud phase to the liquid phase.40 The reactive oxygen species also destroyed extracellular polymeric substances wrapped in the floc surface, resulting in a rough floc surface.27
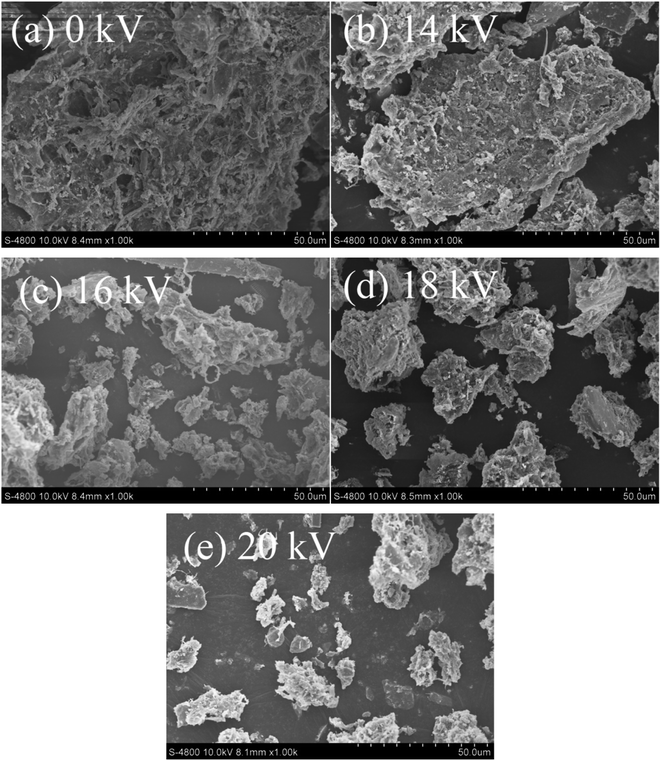 | ||
| Fig. 6 SEM images of sludge after plasma treatment at different voltages ((a) 0 kV; (b) 14 kV; (c) 16 kV; (d) 18 kV; (e) 20 kV). | ||
Fig. 7 shows the particle size distribution of sludge after the plasma treatment at different voltages. The particle size of the raw sludge was basically 20–500 μm, with an average particle size of 140.608 μm. The particle size decreased with the increase in discharge voltage. When the voltage was 14 kV, the large particle sludge began to disintegrate into small particles, and the average particle size of the sludge was 130.903 μm. When the voltage was 20 kV, the average particle size of the sludge further decreased to 89.169 μm. These results were consistent with the SEM results.
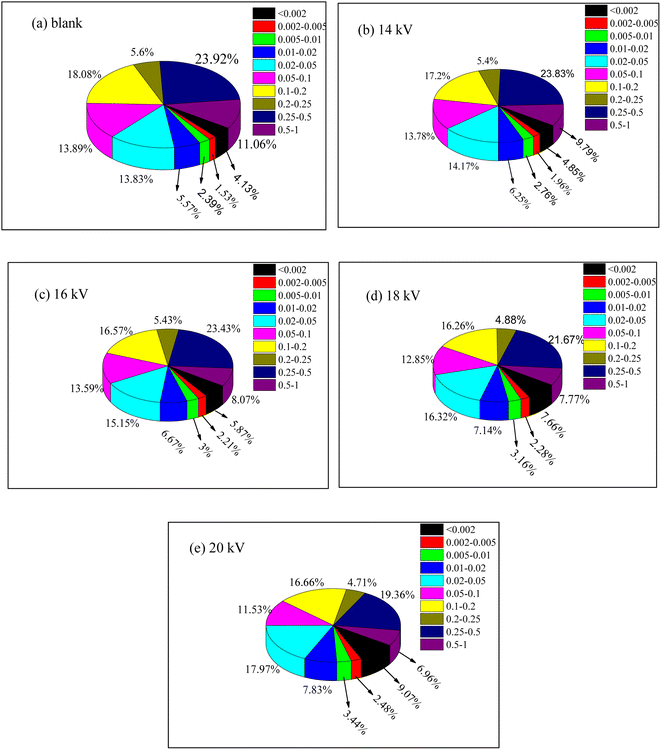 | ||
| Fig. 7 Effects of discharge voltage on particle size distribution of sludge (the unit of particle size: nm. (a) 0 kV; (b) 14 kV; (c) 16 kV; (d) 18 kV; (e) 20 kV). | ||
3.5 Underlying mechanisms for sludge settling
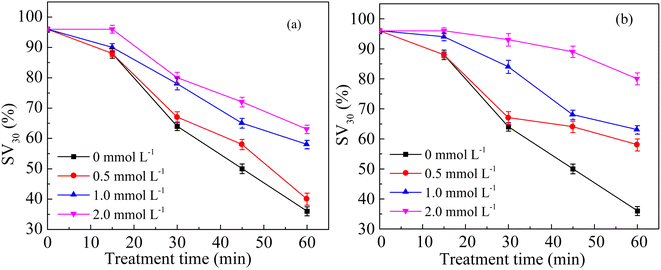
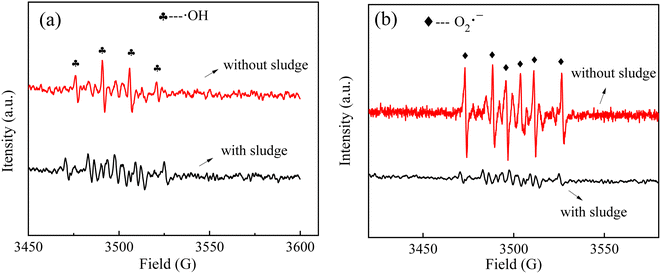
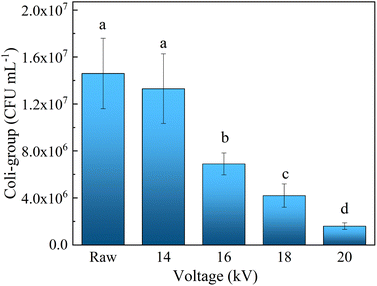
To explore the contributions of different kinds of reactive oxygen species in the sludge cracking process, IPA and BQ were chosen as trapping agents of ·OH and O2˙−, respectively.15–17 Fig. 8a and b show the effects of different concentrations of BQ and IPA on the sludge settling performance using SV30 as an index, respectively. After adding trapping agents to the discharge plasma system, the sludge settling performance deteriorated to a certain extent. When the IPA concentration in the sludge mixture system was 0.5 and 2.0 mmol L−1, the SV30 value increased to 58% and 80%, respectively, after 60 min of discharge treatment. Similarly, when the concentration of BQ increased to 0.5 and 2.0 mmol L−1, SV30 also increased to 40% and 63%, respectively. This is because when the concentration of the trapping agent increased, the content of free radicals involved in sludge cracking in the system was reduced, resulting in the deterioration of sludge settling performance. Thus, ·OH and O2˙− both played important roles in the sludge cracking process. At the same time, it could be found that the inhibition effect of IPA on SV30 was higher than that of BQ when the same concentration of trapping agent was added, indicating that the contribution of ·OH in the system was more obvious than that of O2˙− in the sludge cracking. The contributions of ·OH and O2˙− were also confirmed by the changes in the EPR signals (Fig. 9); the intensities of these radicals were dramatically reduced when the sludge was added, as compared with those in the pure water.The coliform group is the microbial population with the highest abundance in activated sludge, so the changes in coliform abundance can also indirectly characterize the situation of cell lysis. In this study, the plate counting method was used to measure the number of E. coli. Fig. 10 shows the influence of discharge voltage on the number of coliform bacteria after 60 min treatment. At 14 kV, the number of coliform bacteria in the sludge mixture decreased from the initial value of 1.46 × 10⁷ to 1.33 × 10⁷ CFU mL−1, and the removal rate was only 8.90%. When the discharge voltage was 16, 18, and 20 kV, the number of E. coli in the sludge mixture was reduced to 6.90 × 10⁶, 4.20 × 10⁶, and 1.6 × 10⁶ CFU mL−1, respectively; the corresponding removal rates were 52.7%, 71.2%, and 89.1%, respectively. These results further indicated that the discharge plasma could effectively destroy the sludge cells.
In this study, after filtering the original data obtained by sequencing, the total effective sequences in the sludge phase and liquid phase at different voltages ranged from 32![[thin space (1/6-em)]](https://www.rsc.org/images/entities/char_2009.gif) 161 to 47
161 to 47![[thin space (1/6-em)]](https://www.rsc.org/images/entities/char_2009.gif) 069. After clustering analysis of the effective sequences, the coverage index was selected to characterize the sequencing depth, the Chao index and ACE index were selected to represent the community abundance of samples, and the Shannon index and Simpson index represent the community diversity of samples.41 The specific values of each index are listed in Table 1. In the sludge-phase and liquid-phase samples, the coverage index could reach 0.98–0.99, indicating the validity of the sequencing results. The changes in the Chao index and ACE index were similar. At a low voltage, the changes in the Chao index and ACE index in the sludge phase were not particularly obvious. At 20 kV, the Chao index and ACE index significantly decreased by 8.49% and 6.61%, respectively, which indicated that the microbial flora abundance in the sludge phase was almost not affected under a low-oxidation condition, but decreased under a high-oxidation condition. In the liquid phase, both the Chao index and ACE index decreased after the discharge treatment; at 20 kV, they decreased by 35.85% and 28.08%, respectively, suggesting that the microbial flora in the liquid phase was more susceptible to the discharge plasma. In the sludge phase, the Shannon index and Simpson index were both slightly changed under 14–18 kV conditions, indicating that the low oxidation intensity had few effects on the microbial diversity. However, at 20 kV, the Shannon index decreased significantly, and the Simpson index also increased significantly, indicating that the high oxidation intensity could significantly reduce the diversity of the microbial community in the sludge phase. With the increase in the discharge voltage, the variation in the Shannon index and Simpson index in the liquid phase was more obvious than that in the sludge phase, which also indicated that the discharge plasma could significantly reduce the diversity of the bacterial community in the liquid phase. Therefore, compared with the sludge phase, the microbial flora in the liquid phase was more easily affected by the discharge plasma.
069. After clustering analysis of the effective sequences, the coverage index was selected to characterize the sequencing depth, the Chao index and ACE index were selected to represent the community abundance of samples, and the Shannon index and Simpson index represent the community diversity of samples.41 The specific values of each index are listed in Table 1. In the sludge-phase and liquid-phase samples, the coverage index could reach 0.98–0.99, indicating the validity of the sequencing results. The changes in the Chao index and ACE index were similar. At a low voltage, the changes in the Chao index and ACE index in the sludge phase were not particularly obvious. At 20 kV, the Chao index and ACE index significantly decreased by 8.49% and 6.61%, respectively, which indicated that the microbial flora abundance in the sludge phase was almost not affected under a low-oxidation condition, but decreased under a high-oxidation condition. In the liquid phase, both the Chao index and ACE index decreased after the discharge treatment; at 20 kV, they decreased by 35.85% and 28.08%, respectively, suggesting that the microbial flora in the liquid phase was more susceptible to the discharge plasma. In the sludge phase, the Shannon index and Simpson index were both slightly changed under 14–18 kV conditions, indicating that the low oxidation intensity had few effects on the microbial diversity. However, at 20 kV, the Shannon index decreased significantly, and the Simpson index also increased significantly, indicating that the high oxidation intensity could significantly reduce the diversity of the microbial community in the sludge phase. With the increase in the discharge voltage, the variation in the Shannon index and Simpson index in the liquid phase was more obvious than that in the sludge phase, which also indicated that the discharge plasma could significantly reduce the diversity of the bacterial community in the liquid phase. Therefore, compared with the sludge phase, the microbial flora in the liquid phase was more easily affected by the discharge plasma.
| Samples | Sequence number | Coverage | Chao | ACE | Shannon | Simpson |
|---|---|---|---|---|---|---|
| a S represents the sludge phase, and L represents the liquid phase. | ||||||
| S-0 kV | 32161 | 0.98 | 2598.80 | 2595.47 | 6.13 | 0.0064 |
| S-14 kV | 32761 | 0.98 | 2622.60 | 2603.14 | 6.09 | 0.0077 |
| S-16 kV | 34041 | 0.98 | 2641.53 | 2634.48 | 6.04 | 0.0085 |
| S-18 kV | 35601 | 0.98 | 2665.59 | 2653.13 | 6.06 | 0.0084 |
| S-20 kV | 36814 | 0.98 | 2439.29 | 2477.78 | 5.74 | 0.0133 |
| L-0 kV | 39645 | 0.99 | 2627.29 | 2623.98 | 5.10 | 0.1019 |
| L-14 kV | 47069 | 0.99 | 2625.75 | 2609.02 | 4.72 | 0.1116 |
| L-16 kV | 46782 | 0.99 | 2234.79 | 2276.10 | 3.43 | 0.2496 |
| L-18 kV | 44496 | 0.99 | 2021.86 | 2139.62 | 3.48 | 0.2324 |
| L-20 kV | 46880 | 0.99 | 1685.32 | 1887.16 | 2.28 | 0.4407 |
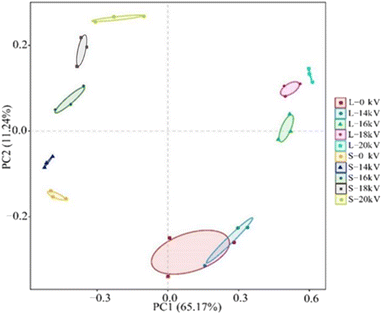
Principal component analysis of the microbial community structure can intuitively exhibit the difference in microbial community structures among different samples. Fig. 11 shows the results of principal component analysis at the OTU level. The large distance between the sludge-phase sample and the liquid-phase sample indicated that the microbial community compositions between these two phases were different. In both the sludge phase and liquid phase, a close distance between 14 kV and 0 kV samples could be observed, indicating that the discharge plasma system at a low voltage had no obvious influence on the microbial community, whereas significant effects on the microbial community structure were observed after the voltage increased. In addition, the effect of discharge plasma treatment on the microbial community structure in the liquid phase was more obvious.
Fig. 12 shows the Venn diagram and Upset diagram of the sludge-phase and liquid-phase samples at the OTU level. As shown in Fig. 12a, the number of OTUs shared by the sludge-phase sample after the discharge plasma treatment and the initial sludge was 61 (14 kV), 29 (16 kV), 29 (18 kV), and 13 (20 kV), respectively. The number of unique OTUs in the treated sludge-phase samples decreased from the initial value of 99 to 87 (14 kV), 73 (16 kV), 85 (18 kV), and 81 (20 kV), respectively. In addition, in Fig. 12b, the number of OTUs shared by the liquid-phase sample after the discharge plasma treatment and the original sample was 307 (14 kV), 18 (16 kV), 18 (18 kV), and 10 (20 kV), respectively. The number of unique OTUs in the liquid phase gradually decreased from the initial value of 342 to 154 (14 kV), 43 (16 kV), 45 (18 kV), and 21 (20 kV). These results further suggested that the discharge plasma treatment could effectively reduce the microbial abundance of sludge samples, and the microbial community in the liquid phase was more sensitive to the discharge plasma treatment.
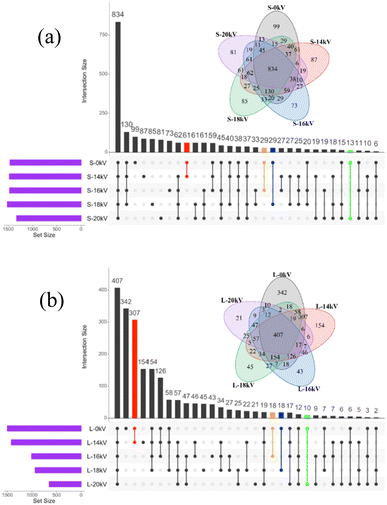 | ||
| Fig. 12 Venn and Upset plot of the microorganism in the sludge solid phase (a) and liquid phase (b) based on the OTU level at different voltages. | ||
In addition, a comparison of sludge reduction and settling by different methods was made, as listed in Table 2. Although the plasma had a higher cost than that of ozone and H2O2 treatment, it showed higher performance in sludge reduction and settling.11,39,42,43 The plasma treatment had a lower cost than that of sonication and ferrate, and it had comparable performance in sludge reduction and settling.29,44
| Methods | Conditions | Time | SVI reduction rate (%) | MLSS reduction rate (%) | Cost estimation ($ per t TS) | Ref. |
|---|---|---|---|---|---|---|
| Fe3+ | 50 mg Fe/g TS | 24 h | 46.4 | 55.4 | 2638 | Ref. 29 |
| O3 | 30–50 mg O3/g TS | — | 16.5–33.3 | 12.8–25.9 | 51–84 | Ref. 11, 39 and 42 |
| H2O2 | 1 g H2O2/g TS | — | — | 19 | 208 | 43 |
| Sonication | 25 kHz, 50.5 W g−1 TS | 30 min | — | 24 | 1800 | 44 |
| Plasma | 9.19 W g−1 TS | 60 min | 47.5 | 28.6 | 656 | This study |
4. Conclusions
The potential of the non-thermal discharge plasma for activated sludge settling was evaluated in this study. The discharge plasma at appropriate voltages could obviously promote the sludge settling, as indexed by SV30, MLSS, and SVI. Better sludge settling performance was obtained after the discharge plasma treatment under acidic conditions. Appropriate dosages of Cl− and NO3− in the sludge benefited the settling performance, probably due to the conversion and formation of other species such as Cl· and . Differently, the addition of CO32− inhibited the sludge settling performance due to its consumption for ·OH. Radical quenching tests demonstrated that ·OH and O2˙− dominated the sludge cracking process. Under the action of the discharge plasma, the sludge floc was destroyed and intracellular organic matter was released, leading to increases in TOC and SCOD in liquid phase and a decrease in the particle size of sludge. Simultaneously, the number of coliform bacteria and the abundance and diversity of the microbial community in the sludge also decreased by the discharge plasma treatment. In future experiments, the treated sludge can be further returned to assess its impacts on the sludge reduction during the operation of the sewage treatment plant.
Conflicts of interest
The authors declare that they have no known competing financial interests or personal relationships that could have appeared to influence the work reported in this paper.Acknowledgements
The authors thank the National Natural Science Foundation of China (21976143).References
- K. Zhou, Y. C. Yang, B. Liu, G. P. Tian, Z. H. Jiang and B. Bian, Sep. Purif. Technol., 2023, 305, 122412 CrossRef CAS.
- Z. C. Yang, S. L. Liu, Y. Q. Tang, Y. P. Zhou and L. Xiao, J. Hazard. Mater., 2023, 445, 130438 CrossRef CAS PubMed.
- H. M. Chang, Y. Zhao, S. L. Zhao, A. Damgaard and T. H. Christensen, Waste Manage., 2022, 146, 106–118 CrossRef CAS PubMed.
- M. Zubrowska-Sudol and J. Walczak, Water Res., 2015, 76, 10–18 CrossRef CAS PubMed.
- G. U. Semblante, F. I. Hai, H. H. Ngo, W. S. Guo, S. J. You, W. E. Price and L. D. Nghiem, Bioresour. Technol., 2014, 155, 395–409 CrossRef CAS PubMed.
- F. Quan, A. F. Yu, L. B. Chu, H. Z. Chen and X. H. Xing, Biochem. Eng. J., 2012, 67, 45–51 CrossRef CAS.
- Y. W. Wang, Q. C. Xiao, J. B. Liu, H. Yan and Y. S. Wei, Bioresour. Technol., 2015, 190, 140–147 CrossRef CAS PubMed.
- P. Foladori, V. F. Velho, R. H. R. Costa, L. Bruni, A. Quaranta and G. Andreottola, Water Res., 2015, 74, 132–142 CrossRef CAS PubMed.
- P. Foladori, S. Tamburini and L. Bruni, Water Res., 2010, 44, 4888–4899 CrossRef CAS PubMed.
- J. Zhang, Y. L. Dong, S. Y. Wang, X. Y. Liu, L. Y. Lv, G. M. Zhang and Z. J. Ren, Sep. Purif. Technol., 2023, 308, 122892 CrossRef CAS.
- A. Chiavola, C. Salvati, S. Bongirolami, C. Di Marcantonio and M. R. Boni, J. Water Process. Eng., 2021, 42, 102114 CrossRef.
- Y. Y. Li, Y. Y. Hu, G. H. Wang, W. C. Lan, J. T. Lin, Q. Bi, H. S. Shen and S. K. Liang, Chem. Eng. J., 2014, 255, 365–371 CrossRef CAS.
- B. Y. Xiao, C. Liu, J. X. Liu and X. S. Guo, Bioresour. Technol., 2015, 196, 109–115 CrossRef CAS PubMed.
- N. H. M. Yasin, V. Sanchez-Torres and T. Maeda, Bioresour. Technol., 2014, 174, 134–141 CrossRef PubMed.
- H. Li, R. Y. Song, Y. Y. Wang, R. W. Zhong, Y. Zhang, J. Zhou, T. C. Wang, H. Z. Jia and L. Y. Zhu, Water Res., 2021, 204, 117630 CrossRef CAS PubMed.
- R. G. Wang, T. C. Wang, G. Z. Qu, Y. Zhang, X. T. Guo, H. Z. Jia and L. Y. Zhu, Water Res., 2021, 196, 117027 CrossRef CAS PubMed.
- R. W. Zhong, H. Li, Y. Y. Wang, Y. Zhang, J. Zhou and T. C. Wang, Chem. Eng. J., 2023, 454, 140274 CrossRef CAS.
- T. M. Kang, D. Yim, K. H. Baek, Y. E. Lee, H. J. Kim and C. Jo, J. Appl. Microbiol., 2022, 133, 3007–3019 CrossRef CAS PubMed.
- W. K. Ching, A. J. Colussi, H. J. Sun, K. H. Nealson and M. R. Hoffmann, Environ. Sci. Technol., 2001, 35, 4139–4144 CrossRef CAS PubMed.
- S. B. Gupta and H. Bluhm, IEEE Trans. Plasma Sci., 2008, 36, 1621–1632 CAS.
- E. Takai, G. Ohashi, T. Yoshida, K. M. Sorgjerd, T. Zako, M. Maeda, K. Kitano and K. Shiraki, Appl. Phys. Lett., 2014, 104, 023701 CrossRef.
- M. Magureanu, N. B. Mandache and V. I. Parvulescu, Water Res., 2015, 81, 124–136 CrossRef CAS PubMed.
- J. H. Zeng, B. Yang, X. P. Wang, Z. J. Li, X. W. Zhang and L. C. Lei, Chem. Eng. J., 2015, 267, 282–288 CrossRef CAS.
- T. F. Li, Y. H. Fan, H. Li, Z. Y. Ren, L. Q. Kou, X. T. Guo, H. Z. Jia, T. C. Wang and L. Y. Zhu, Sci. Total Environ., 2021, 774, 145127–145135 CrossRef CAS PubMed.
- APHA, AWWA and WEF, Standard methods for the examination of water and wastewater, 21 st ed., American Public Health Association (APHA), Washington, DC, USA, 2005 Search PubMed.
- B. R. Wu, M. Zhou, X. H. Dai and X. L. Chai, Water Res., 2018, 142, 480–489 CrossRef CAS PubMed.
- Y. S. Chen, H. P. Chen, J. Li and L. Xiao, Water Res., 2019, 152, 181–190 CrossRef CAS PubMed.
- W. Chen, X. H. Gao, H. Xu, Y. Cai and J. F. Cui, Chemosphere, 2017, 170, 196–206 CrossRef CAS PubMed.
- Y. P. Zhang, R. Q. Hu, J. Y. Tian and T. T. Li, Bioresour. Technol., 2018, 267, 126–132 CrossRef CAS PubMed.
- H. Y. Wu, J. Y. Gao, D. H. Yang, Q. Zhou and W. Liu, Chem. Eng. J., 2010, 160, 1–7 CrossRef CAS.
- J. T. Zou, J. Y. Pan, H. T. He, S. Y. Wu, N. D. Xiao, Y. J. Ni and J. Li, Bioresour. Technol., 2018, 260, 30–37 CrossRef CAS PubMed.
- X. Y. Wang, M. H. Zhou and X. L. Jin, Electrochim. Acta, 2012, 83, 501–512 CrossRef CAS.
- L. Wang, J. Hazard. Mater., 2009, 171, 577–581 CrossRef CAS PubMed.
- E. Rommozzi, S. Giannakis, R. Giovannetti, D. Vione and C. Pulgarin, Appl. Catal., B, 2020, 270, 118877–118893 CrossRef CAS.
- Y. J. Xiao, L. F. Zhang, J. Q. Yue, R. D. Webster and T. T. Lim, Water Res., 2015, 75, 259–269 CrossRef CAS PubMed.
- Z. Xu, C. Shan, B. Xie, Y. Liu and B. Pan, Appl. Catal., B, 2017, 200, 439–447 CrossRef CAS.
- D. Rubio, E. Nebot, J. F. Casanueva and C. Pulgarin, Water Res., 2013, 47, 6367–6379 CrossRef CAS PubMed.
- H. Masihi and G. Badalians Gholikandi, Water Res., 2018, 144, 373–382 CrossRef CAS PubMed.
- L. Chu, S. Yan, X.-H. Xing, X. Sun and B. Jurcik, Water Res., 2009, 43, 1811–1822 CrossRef CAS PubMed.
- G. Y. Zhen, J. H. Wang, X. Q. Lu, L. H. Su, X. F. Zhu, T. Zhou and Y. C. Zhao, Chemosphere, 2019, 221, 141–153 CrossRef CAS PubMed.
- J. Zhang, Z. Ai, C. Liang, G. Wang and S. Xue, Geoderma, 2017, 308, 112–119 CrossRef CAS.
- X. Sun, B. Liu, L. Zhang, K. Aketagawa, B. Xue, Y. Ren, J. Bai, Y. Zhan, S. Chen and B. Dong, Sci. Total Environ., 2022, 807, 150773 CrossRef CAS PubMed.
- C. Eskicioglu, A. Prorot, J. Marin, R. L. Droste and K. J. Kennedy, Water Res., 2008, 42, 4674–4682 CrossRef CAS PubMed.
- P. Zhang, G. Zhang and W. Wang, Bioresour. Technol., 2007, 98, 207–210 CrossRef CAS PubMed.
| This journal is © The Royal Society of Chemistry 2023 |

