DOI:
10.1039/D3RA03042C
(Paper)
RSC Adv., 2023,
13, 20651-20662
Chemical VOC sensing mechanism of sol–gel ZnO pellets and linear discriminant analysis for instantaneous selectivity
Received
7th May 2023
, Accepted 5th July 2023
First published on 10th July 2023
Abstract
This work reports on the integration of ZnO pellets for use as a virtual sensor array (VSA) of volatile organic compounds (VOCs). ZnO pellets consist of nano-powder prepared using a sol–gel technique. The microstructure of the obtained samples was characterized by XRD and TEM methods. The response to VOCs at different concentrations was measured over a range of operating temperatures (250–450 °C) using DC electrical characterization. The ZnO based sensor showed a good response towards ethanol, methanol, isopropanol, acetone and toluene vapors. We note that the highest sensitivity (0.26 ppm−1) is obtained with ethanol while the lowest one (0.041 ppm−1) corresponds to methanol. Consequently, the limit of detection (LOD) estimated analytically reached 0.3 ppm for ethanol and 2.0 ppm for methanol at an operating temperature of 450 °C. The sensing mechanism of the ZnO semiconductor was developed on the basis of the reaction between the reducing VOCs with the chemisorbed oxygen. We verify through the Barsan model that mainly O− ions in the layer react with VOC vapor. Furthermore, dynamic response was investigated to construct mathematical features with distinctly different values for each vapor. Basic linear discrimination analysis (LDA) shows a good job of separating two groups by combining features. In the same way we have shown an original reason embodying the distinction between more than two volatile compounds. With relevant features and VSA formalism, the sensor is clearly selective towards individual VOCs.
1 Introduction
Detecting and identifying volatile organic compounds (VOCs) is challenging because they tend to evaporate very easily at room temperature. They form an extended family of gases, most of which are considered pollutants, toxic, or carcinogenic. Their volatile nature allows them to spread rapidly through the atmosphere, hence the need to detect them to protect against them. Several VOC detection techniques are available. Metal oxide semiconductor (MOS) sensors like ZnO,1,2 WO3,3,4 In2O3,5–7 SnO2 (ref. 8 and 9) and Fe2O3,10,11 detect concentrations of various types of VOC by measuring the current or the resistance change of the metal oxide due to adsorption of gases. However, these sensors still suffer from difficulties such as a long-term stability and selectivity. The progress of solid gas sensors has been the subject of much research in this framework, and we can cite the example of zinc oxide. ZnO is II–VI binary material and exists in three different crystalline structures such as wurtzite, zinc blend and rock salt. Hexagonal wurtzite is thermodynamically the most stable phase.12 Furthermore, ZnO has a wide band gap energy of about 3.2 eV.13 It is confirmed that oxygen vacancies (VO) are the dominant donor defect in ZnO since it is an intrinsic N-type semiconductor.14 This material has attracted much attention due to its notable physical properties and potential applications in various fields such as gas sensors,15,16 light-emitting diodes (LEDs),17,18 solar cells,19 and UV detectors.20 Recently, Masoumi et al.21 have fabricated chemo-thermoelectric gas sensor out of a pure ZnO pellet. They report that VOCs sensing responses obey the “power law” commonly utilized for describing the static sensing behavior in chemoresistors. More recently, Sinha et al.22 have developed hybrid sensing prototype of toxic VOCs by synthesizing a composite of ZnO and carbon nanotube. They demonstrate that switching of the VOC adsorption mechanism depending on the sensor operating temperature can be observed by going from “P- to N-” type above 150 °C. In other works, Postica et al.23 demonstrated the synergistic role of doping using Ag nanoparticles in enhancing the gas sensing response and selectivity of ZnO, toward specific VOCs. Besides, Acharyya et al.24 performed principal component analysis (PCA) for both types of sensors (ZnO NFs and rGO-ZnO NFs) with exposure to different VOCs. They quantitatively established an improvement in the selectivity towards 2-propanol of rGO-ZnO sensor NFs.
In this paper we purpose to discuss how the oxygen adsorption/desorption phenomenon impacts the detection mechanism of the analyzed VOC at different operating temperature. Besides, we launch an intelligent method based on the concept of virtual sensor array (VSA) for the recognition of the target gas. Effectively, linear discriminant analysis (LDA) ensures the appropriate result in a reasonably simple way. LDA is a fairly powerful supervised method, its advantage is that it has a limited database which is not the case for unsupervised methods like principal component analysis (PCA) and hierarchical ascendent classification (HAC). In fact, validation checks are not recorded in the LDA database, which gives this method simplicity with good predictability compared to other supervised learning techniques such as “decision tree” and “support vector machine”.
2 Experimental
2.1 Synthesis of ZnO pellets
ZnO nanoparticles were synthesized via sol–gel technique by dissolving 16 g of zinc acetate dehydrate (Zn(CH3CO2)2·2H2O) in 112 ml of methyl alcohol. After 15 min of magnetic stirring, 200 ml of ethyl alcohol was added to the mixture. The transparent and homogeneous obtained solution was introduced into an autoclave and dried under supercritical ethanol conditions (Tc = 243 °C; Pc = 63.6 bar).25 The gotten powders underwent a heat treatment in a furnace at 400 °C for 2 hours in air. To finish, the baked powders were compressed in a target handle with a uniaxial pressure of 300 kg cm−2 to obtain compact cylindrical pellets with a diameter of 10 mm and a thickness of 0.5 mm.
2.2 Characterization
The microstructure of the prepared pellets was analyzed by X-ray diffraction (XRD) using the CuKα1 radiation (1.5406 Å) of a Bruker D8 Advance diffractometer operating at 40 kV, 40 mA. The scanning range (2θ) is 20–70° with a slow speed of scanning ∼1.2° min−1. The sizes and shapes of the ZnO powders were studied using transmission electron microscopy (TEM) conducted with FEI Tecnai G20, LaB6 transmission electron microscope working at 200 kV. ZnO powders were dispersed in ethanol. Then a drop of the sample is placed on a 400 mesh holey carbon coated copper grids for analysis.
2.3 Gas sensing measurement
Fig. 1 shows the experimental setup used for gas detection in a dynamic atmosphere. The stainless-steel test chamber is a 3 liter cylindrical with a gas inlet and a gas outlet. The ZnO pellet is fixed on a support by two golden tungsten electrodes and polarized at 1 V with a HP 4140B pico-ammeter source. The sample was heated using a halogen lamp powered by a power supply. The working temperature was varied from 250 °C to 450 °C and measured through a Pt 100 probe connected to an ohmmeter (HP 34401A).
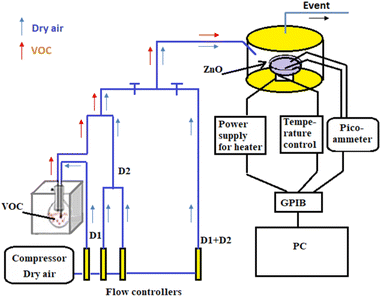 |
| | Fig. 1 Experimental setup of VOCs detection. | |
The devices are connected to a computer via GPIB card to record temperature and electric current through the sensor in real time. Organic vapors were generated from the pure liquid in a round-bottomed flask placed in a Polystat cc1 Huber water bath at fixed temperature Tvap. The vapors are then diluted by the mixture with dry air. The partial pressure of VOC was settled using two-arm gas flow device. The first is charged with dry air as a carrier gas (d1 flow rate), the second is charged with organic vapor (d2 flow rate). The two streams mix at the end of the two arms.
The VOC concentration is given by the following expression:26
| |
 | (1) |
where
x is the vapor molar fraction in the flask at a fixed temperature
Tvap, given by:
| |
 | (2) |
where
Patm and
Pvap are the atmospheric pressure and partial pressure of VOC at a given temperature
Tvap respectively.
After a 5 min exposure to VOC, the test chamber was purged for 15 min, which is the average time needed to go back toward initial baseline under dry air.
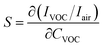
The gas response is defined as follows:27
| |
 | (3) |
where
Iair is the base current intensity in dry air and
IVOC is the sensor electrical current at different VOC concentrations.
3 Results and discussion
3.1 XRD and TEM characterization
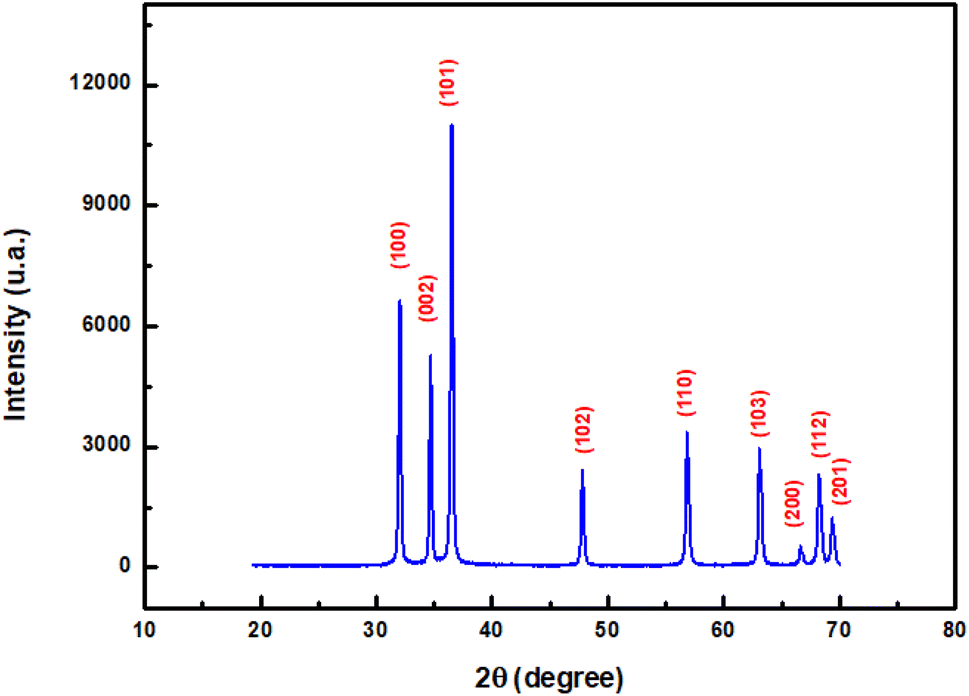
Fig. 2 depicts X-ray diffraction pattern of ZnO pellet. The diffractogram, reveals (100), (002), (101), (102), (110), (103), (200), (112) and (201) peaks, which corresponds to hexagonal wurtzite ZnO phase according to the JCPDS card 01-79-0207.
 |
| | Fig. 2 Diffractogram of ZnO pellet. | |
The crystallite size D was estimated by fitting the peak to Gaussian profile and using the Scherrer equation:28
| |
 | (4) |
where
β is the full width at half maximum in radians,
λ is the X-ray wavelength, and
θ is the Bragg angle.
The dislocation density δ defined as the length of the dislocation lines per unit volume of crystal and calculated using Williamson and Smallman's formula:29
| |
 | (5) |
The computed average value of crystallite size is 62 nm and the dislocation density is estimated to be δ = 2.6 1010 lines per cm2.
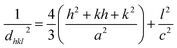
The distance between reticular planes (hkl) for hexagonal phase structure was expressed by the following formula:30
| |
 | (6) |
The Bragg relation is given by:
| |
2dhkl![[thin space (1/6-em)]](https://www.rsc.org/images/entities/char_2009.gif) sinθ = nλ sinθ = nλ
| (7) |
where
n is an integer.
Then, the lattice parameters a and c of the hexagonal ZnO lattice were calculated from (100) and (002) diffraction peaks using the following expressions:30,31
| |
 | (8) |
| |
 | (9) |
The deduced values of a and c are 3.23 Å and 5.17 Å respectively.
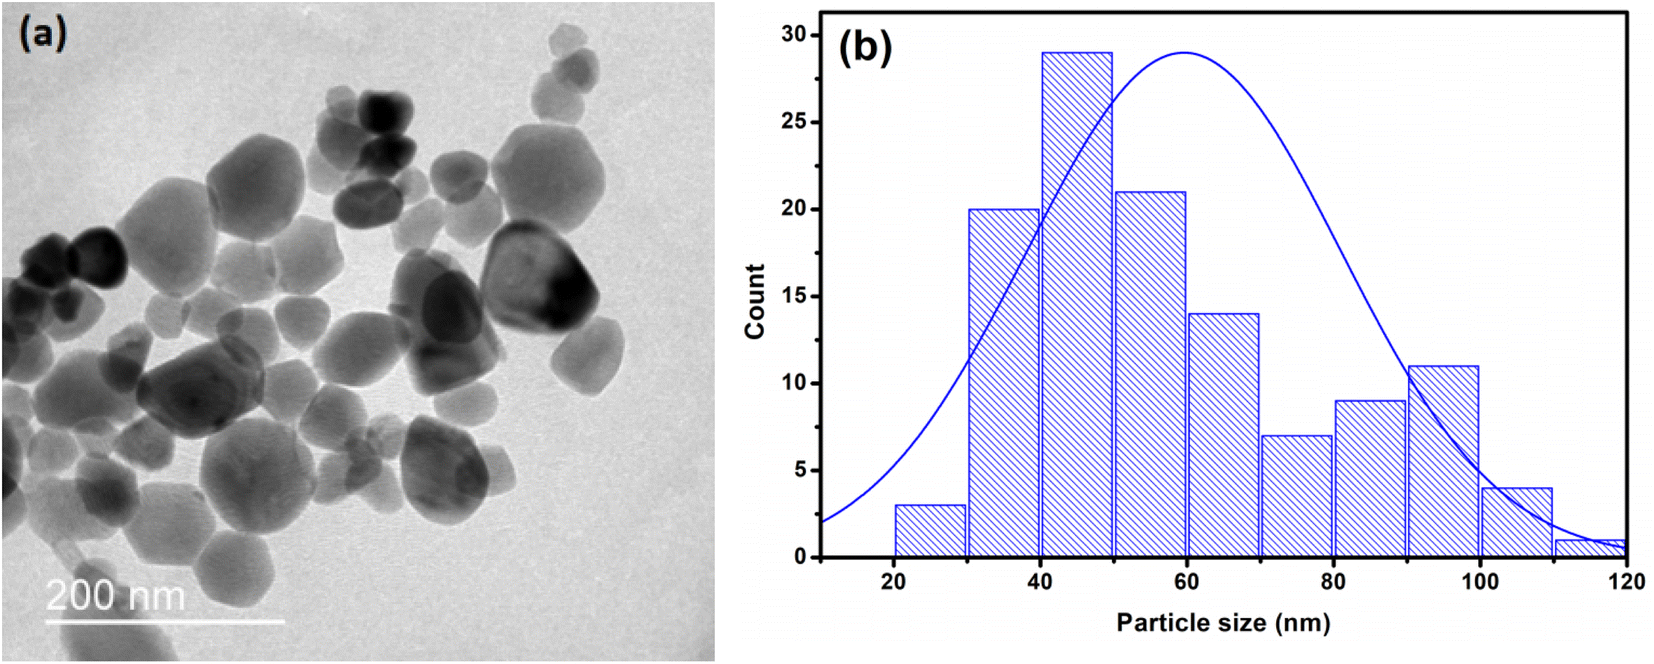
Moreover, Transmission Electron Microscopy (TEM) micrograph presented in Fig. 3(a) shows that ZnO powders are formed by nanoparticles having quasi-spherical shape with different size. Fig. 3(b) shows the particle size distribution histogram obtained with a statistical count taken on a TEM image using ImageJ software. We ran out the statistics with three measurements per particle. The fit of this distribution by normal law using “Origin” software shows a mean value of 60 nm. Such value is in accordance with XRD one as calculated to be 62 nm. We conclude that ZnO nanoparticles are monocrystalline.
 |
| | Fig. 3 (a) TEM micrograph and (b) particle size distribution histogram of ZnO pellet. | |
In the next section, we suggest investigating the sensing mechanism and selectivity for some volatile organic compounds.
3.2 VOCs sensing mechanism
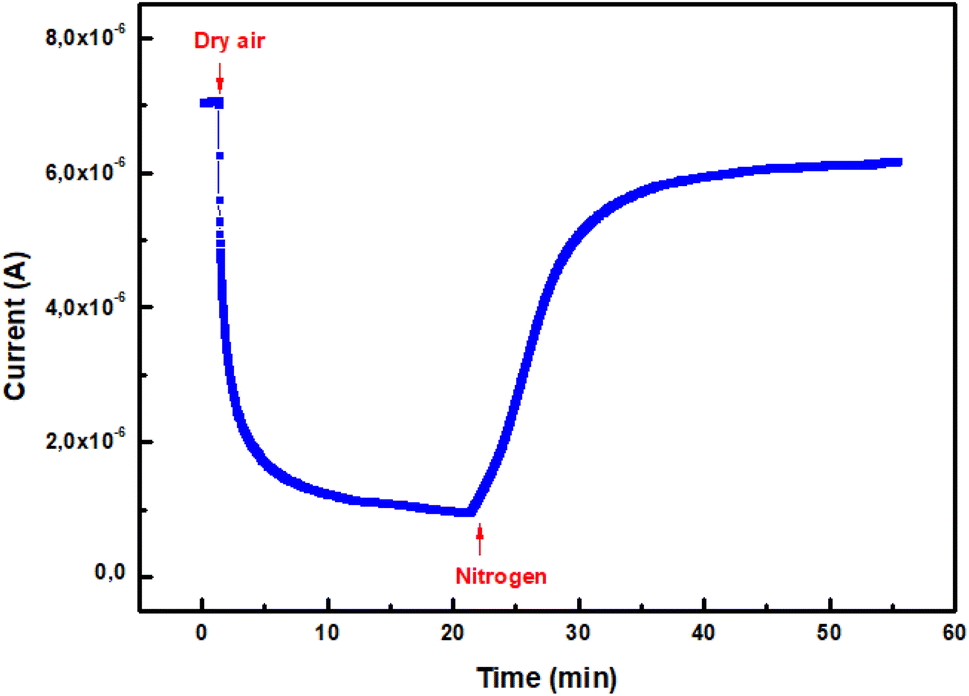
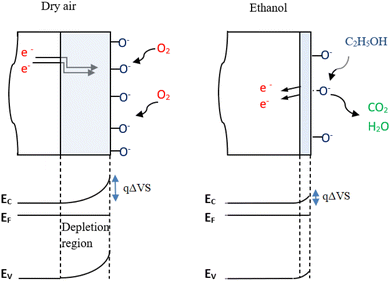
3.2.1 Oxygen adsorption/desorption. The adsorption and desorption of oxygen on zinc oxide pellet have been experimentally confirmed by carrying out alternating exposure to nitrogen and dry air. Fig. 4 shows that current decreases when dry air is injected in the test chamber and increases after its removal by nitrogen at a working temperature of 350 °C. In fact, under dry air, because of oxygen vacancies and zinc interstitials defects, oxygen molecules would be adsorbed on the surface of ZnO pellet, trap electrons from the semiconductor and produce oxygen ions such as O2−; O− and O2−.32,33
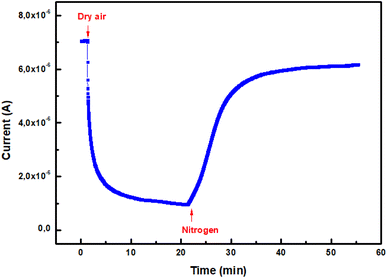 |
| | Fig. 4 Dynamic change of current during a cycle of alternating exposure of ZnO pellet to dry air and nitrogen at 350 °C. | |
The electrons trapped from the conduction band by this process are confined to the surface and form a space charge region. This leads to a depletion of the energy bands and the appearance of a potential barrier qΔVS between the surface and the bulk.23 As a result, the free electrons concentration diminishes and current intensity through the ZnO sensor decreases. When nitrogen gas is introduced in the test chamber, the trapped electrons are released back to the ZnO nanoparticles, oxygen molecules would be desorbed from the surface, leading to an augmented current through the sensor.
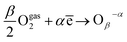
Similar processes were found with metal oxides, so oxygen adsorption was modelized by Barsan and Weimer34 with the following equation:
| |
 | (10) |
where O
β−α is a chemisorbed oxygen species with:
α = 1 for singly ionized forms,
α = 2 for doubly ionized form,
β = 1 for atomic forms and
β = 2 for molecular form.
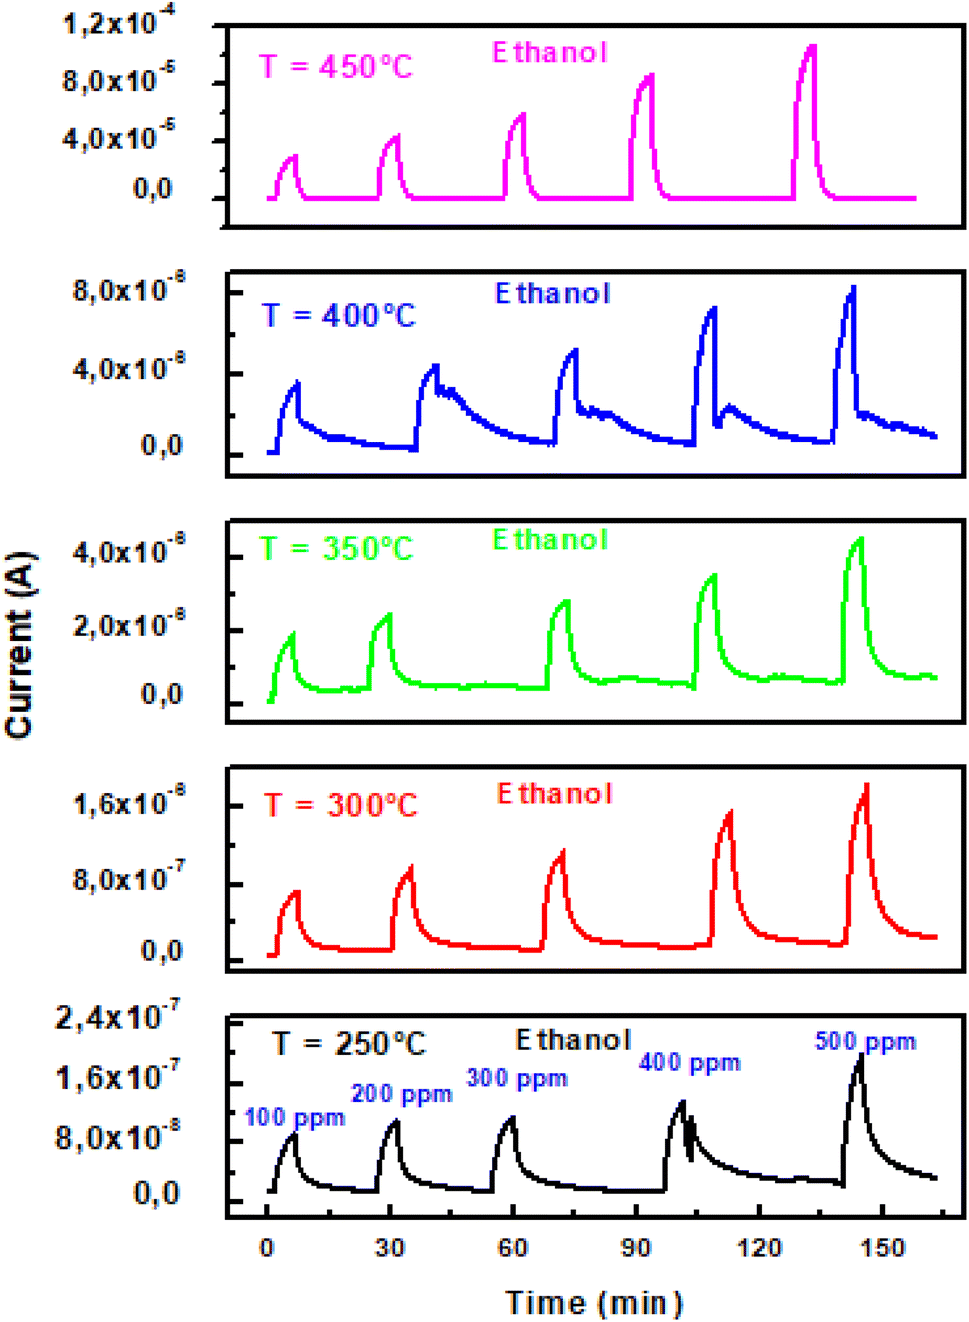
3.2.2 Ethanol sensing investigation. Fig. 5 shows the transient current change of ZnO pellet versus ethanol concentration and working temperature in the range 250–450 °C. Five responses and recovery curves are shown at a fixed operating temperature corresponding to 100 ppm, 200 ppm, 300 ppm, 400 ppm and 500 ppm of ethanol gas. As represented, the sample displays a current increase under ethanol and a decrease to the base line under dry air. Such behavior agrees with the detection mechanism of reducing gases by N-type semiconductors.34
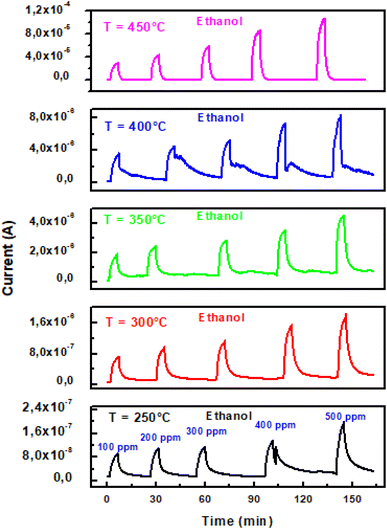 |
| | Fig. 5 Transient current change of ZnO pellet versus ethanol concentration and working temperature in the range 250–450 °C. | |
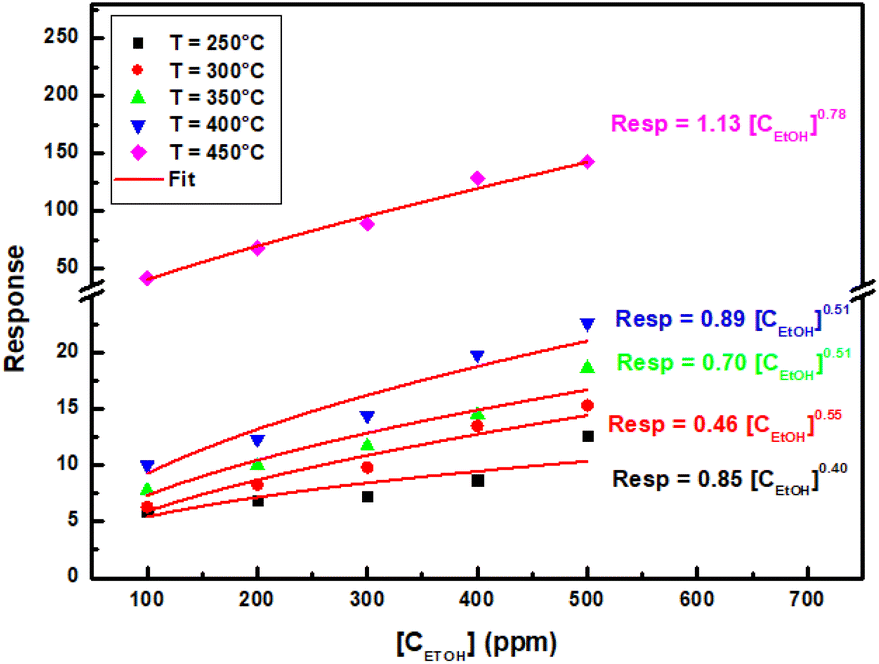
Furthermore, Fig. 6 presents sensing data for experimental responses against ethanol concentration and adjusting response curves using the following power law:
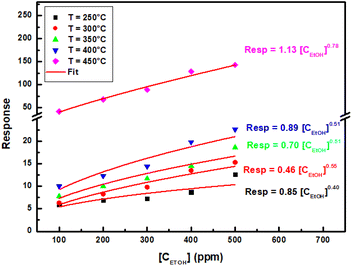 |
| | Fig. 6 Experimental data and power fit of sensing response of ZnO sensor as a function of ethanol concentration at different operating temperatures. | |
The values of γ obtained at different operating temperatures are listed in Table 1.
Table 1 Fitting results of sensing response of ZnO sensor versus ethanol concentration at different operating temperatures
| Working temperature (°C) |
250 |
300 |
350 |
400 |
450 |
| γ |
0.40 |
0.55 |
0.51 |
0.51 |
0.78 |
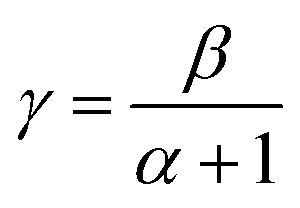
These values are less than one and show that response increases slowly and tends to saturation. In fact, the gas molecules on the material surface were gradually saturated with the increasing concentration. According to Barsan and Weimer34 model, γ obeys the relation:
| |
 | (12) |
We note that in the working temperature range 250–400 °C, the exponent γ is about 0.5. This is entails that β = 1 and α = 1. So, the oxygen ion type is O−. Thus, the mechanism of ethanol sensing in zinc oxide pellets can be monitored by the following equations:23
| |
 | (13) |
| | |
Under ethanol: C2H5OH(ads) + 6O(ads)− → 2CO2 + 3H2O + 6ē
| (14) |
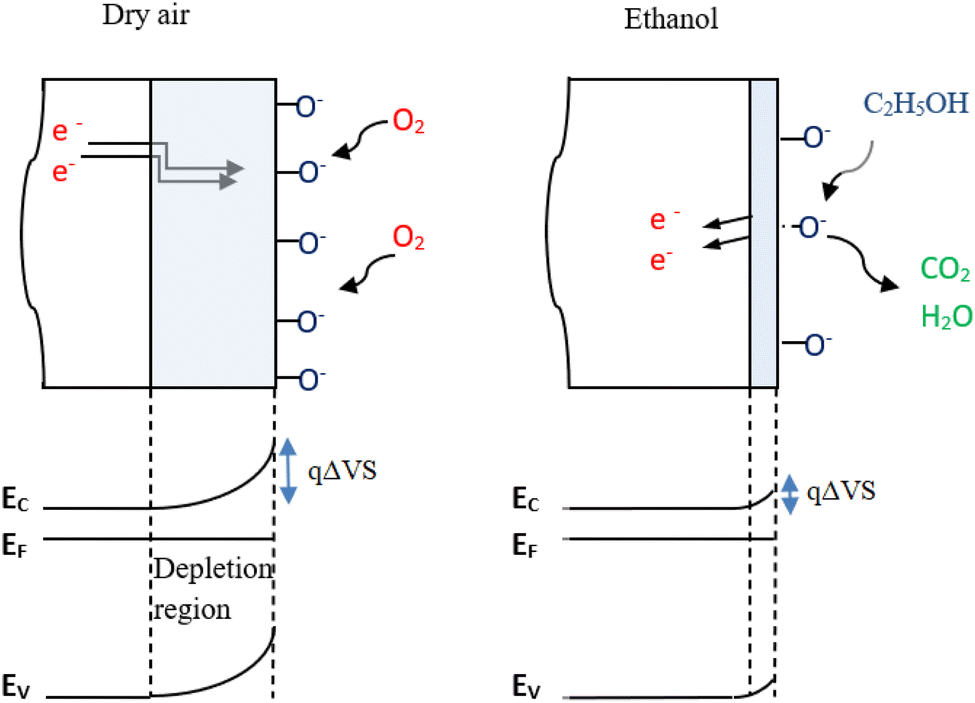
Eqn (13) shows that adsorption of oxygen on ZnO surface effectively traps electrons. Since the material is N type, this process, reduces the Fermi level and causes a band bending to extend the width of the electron depletion region (Fig. 7). When ethanol is injected in the test chamber, electrons that are given up by the reaction mechanism (eqn (14)) increases the concentration of the free carriers and rises therefore the current intensity. Therefore, the gas sensing mechanism is based on the modification of potential barriers (qΔVS) between ZnO grains due to the adsorption/desorption of oxygen ions, which modifies the surface electron depletion region as illustrated in Fig. 7.
 |
| | Fig. 7 Mechanism of ethanol detection by ZnO pellet. | |
3.2.3 VOCs sensing investigation. Eqn (12) requires that the values of the exponent γ must be identical to the types of oxygen ions such as O2−; O− and O2− are respectively 1; 0.5 and 0.33. In particular, at 450 °C the obtained value of γ from ethanol study is 0.78, so the type of oxygen ion cannot be proven. In order to verify this value (γ = 0.78), the ZnO pellet was again exposed to different concentrations of other VOCs at the operating temperature of 450 °C. Fig. 8(a and b) shows the current evolution measured in ZnO pellet upon exposure to different concentrations of methanol, isopropanol, acetone and toluene with dry air as carrier gas.
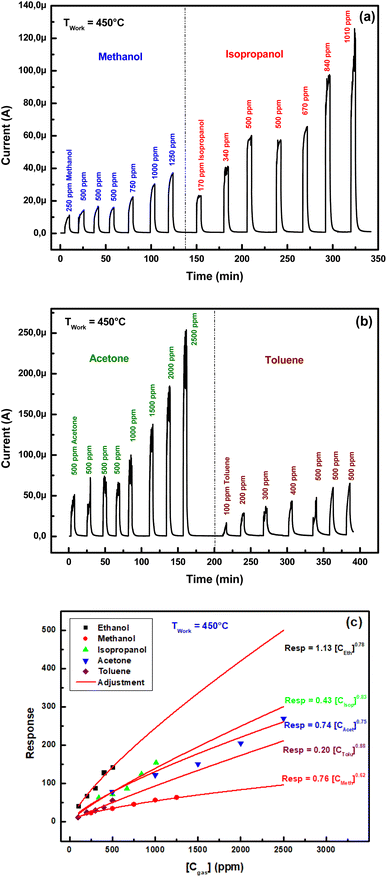 |
| | Fig. 8 Current evolution at working temperature of 450 °C measured in ZnO pellet upon exposure to different concentrations of various organic vapors (a) methanol and isopropanol, (b) acetone and toluene, (c) experimental and power fit of sensing response of ZnO sensor as a function of organic vapor concentration. | |
Fig. 8(c) illustrates the experimental and power fit of ZnO sensing response as a function of organic vapor concentration. The values of the exponent γ are regrouped in Table 2.
Table 2 Fitting results of sensing response of ZnO sensor versus VOCs concentration at 450 °C
| VOCs |
Ethanol |
Methanol |
Isopropanol |
Acetone |
Toluene |
| γ |
0.78 |
0.62 |
0.83 |
0.75 |
0.88 |
It's confirmed that the exponent γ of the power law of response versus VOC concentration is about 0.8. We think that operating at 450 °C is accompanied by a recrystallization of the sensitive layer. Such operation has the effect of a thermal annealing which improves electrical conductivity and gets interconnection–interpenetration of the ZnO grains. This enhances the modulation of qΔVS which governs the gas response.35
3.3 Performance indicators
3.3.1 Quantitative metrics.
3.3.1.1 Sensitivity. Sensitivity is defined by eqn (15):| |
 | (15) |
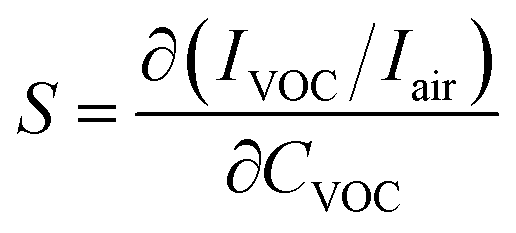
where CVOC denotes the concentration of VOC. The slope of the fitting line between sensing response and concentration represents the sensitivity S of the tested sensor.Table 3 regroups sensitivities of ZnO pellet for different VOCs at 450 °C. We note that the highest sensitivity (0.26 ppm−1) is obtained with ethanol while the lowest one (0.041 ppm−1) corresponds to methanol.
Table 3 Sensitivity and LOD of ZnO based VOCs sensor
| VOC |
Ethanol |
Methanol |
Isopropanol |
Acetone |
Toluene |
| Sensitivity (ppm−1) |
0.260 |
0.041 |
0.140 |
0.093 |
0.100 |
| LOD (ppm) |
0.3 |
2.0 |
0.6 |
0.9 |
0.8 |
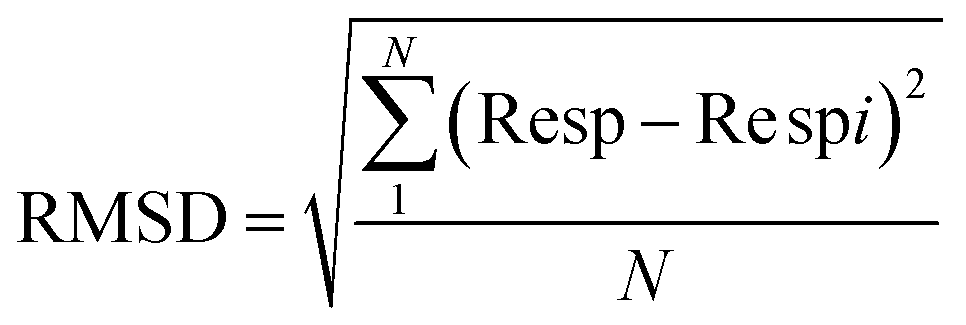
3.3.1.2 Limit of detection. The limit of detection (LOD) is set as the minimum concentration at which the response is clearly different from the noise signal (generally LOD is 3 times the standard deviation of the noise). Sensor noise can be estimated by measuring the sensing response of the developed sensor in the baseline before exposure to VOC. Using the average sensing response (Resp) of (N = 30) consecutive baseline data and then we calculate the root mean square deviation (RMSD) by the following expression:36,37| |
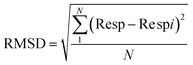 | (16) |
where N is the number of data points and Respi is the ith baseline measured data response. According to this definition, the LOD was calculated using eqn (17):| |
 | (17) |
The calculated value for each VOC is illustrated in Table 3. It's noted that LOD of ZnO sensor is 0.3 ppm for ethanol and 2.0 ppm for methanol.
3.3.2 Selectivity. The aptitude of a sensor to reply to a particular gas in the presence of other gases is known as selectivity. The last property can be evaluated at the steady state from comparison of sensor response to the target gas and an interference gas, for equal concentration. Lupan et al.38 reported that undoped ZnO films have a very low sensing response (less than 2% towards 1.5 ppm nitrogen dioxide and 100 ppm ammonia). They have demonstrated that the gas sensing characteristics of the ZnO film can be improved drastically to 6% for NO2 by introducing Sn dopant into the sensing film. Likewise, sensing response to NH3 attains 100% with Ni doping. These results show an enhancement of selectivity. In addition, Kolhe et al.39 explain that Al doping ZnO gives rise to the increase of oxygen vacancies related defects that contribute to increase the active adsorption sites enhancing sensor characteristics. They show that response to 600 ppm of hydrogen sulfide jumps from 2 to 12 going from undoped to 4% Al doped ZnO. In our case, cross responses between different volatile organic compounds are present in most times. For this purpose, we extracted relevant information from the transient response of the ZnO pellet gas sensor to identify and/or quantify a certain VOC. Considering the large number of features, a statical Linear Discrimination Analysis (LDA) method was used to separate two or more classes of objects or events. This approach has been reported for MOX-based sensors in many works, in particular for the electronic nose.40,41
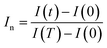
3.3.3 Features emerged from the transient responses. We have already in previous work42 defined computer code that introduces new features of the sensor's transient response in real time. In this section, we are only interested in the responses at 450 °C of all the studied VOCs. The first step is to normalize the transient sensing response over the period T (here T = 1 min) by the following formula:| |
 | (18) |
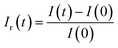
where I(t) the current through the sensors at the moment t under the target VOC and I(0) is the base line current in dry air.We also define the relative response Ir(t) as follow:
| |
 | (19) |
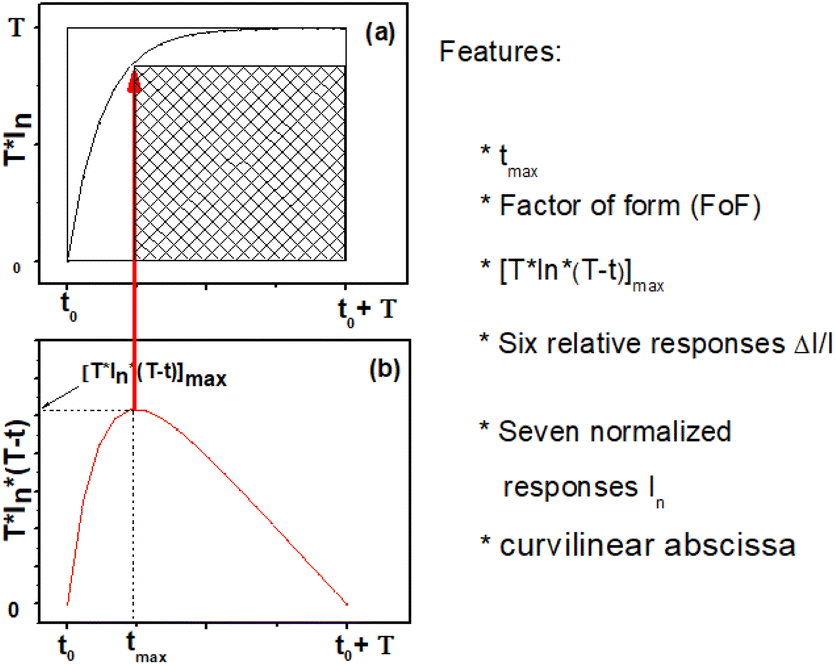
Fig. 9(a) presents the normalized and squared response T × In versus time in the range [t0 − t0 + T].
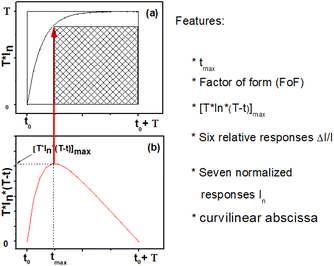 |
| | Fig. 9 Related features, (a) form of a normalized and squared experimental curve and (b) function generated from curve (a) [T × In × (T – t)]. | |
In addition, Fig. 9(b) shows a specific curve generated from the normalized response by the following expression:
| | |
P(t) = [T × In(t) × (T − t)]
| (20) |
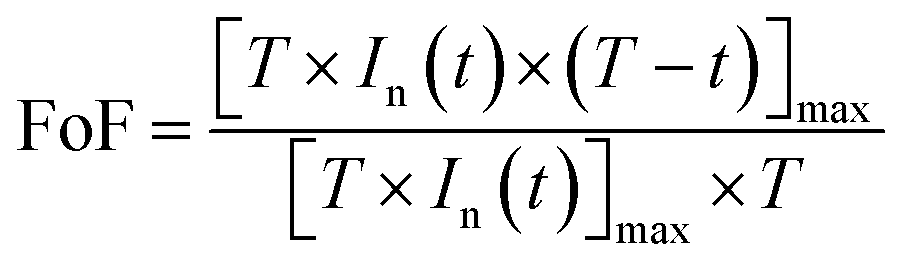
We note that P(t) presents a maximum at a given moment tmax which can indirectly translate the kinetics of the chemical reaction of the target gas at the surface. Then tmax is related to the normalized and squared response in Fig. 9(a), once, we depict the point that leads to the determination of the factor of form (FoF) with the resulting formula:
| |
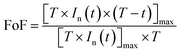 | (21) |
Graphically the FoF is the ratio of the shaded area to the total square area (T2) as shown in Fig. 9(a).
Then by running the computer code, we deftly extract 17 features, namely: tmax, FoF, [T × In × (T − t)]max, the relative responses Ir(t) relating at instants (7.5 s, 15 s, 22.5 s, 37.5 s, 45 s, 52.5 s), the normalized responses In at instants (7.5 s, 15 s, 22.5 s, 30 s, 37.5 s, 45 s, 52.5 s) and the curvilinear abscissa for one minute normalized response time (Cabs).
This allowed us to build a labeled database, to perform linear discriminant analysis.
3.3.4 Methodology. Linear Discriminant Analysis (LDA) technique consists of dimension shortening used as a pre-processing step for sample classification and machine learning applications.43 LDA is like PCA (Principal Component Analysis) but LDA in extension finds trends that increase sorting between multiple clusters.44 From the basic course about LDA, it is a method that aims to maximize separation between two clusters. Then the goal is to project a feature space (n-dimensional data) onto a smaller subspace k (k ≤ n − 1) while preserving the class discriminative information. One can also directly optimize the linear decision limit, without any probabilistic model and can be caught in several ways. This approach searches for a vector W such that:* At best the centroid of each cluster projected on this line are separated, i.e., to increase the between-cluster distance.
* The expected observations are close to their expected centroid, i.e., the distance within-cluster is reduced.
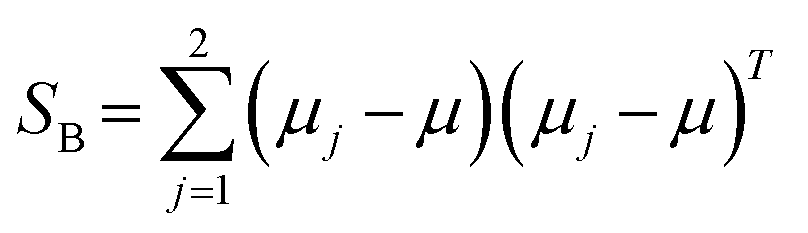
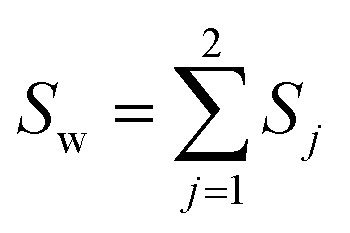
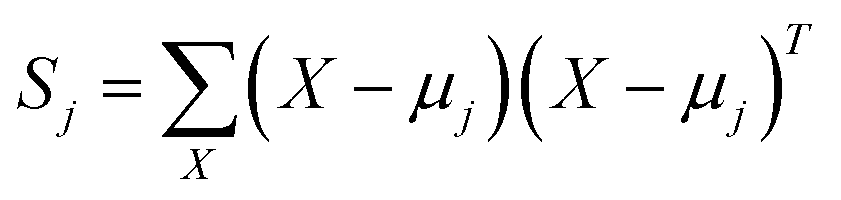
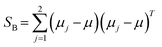
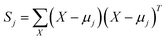
The original LDA is widely used by many applications in a standard way which is interpreted by a typical subspace discrimination algorithm for a two-class problem. By defining a dataset from a vector matrix of 2 classes (or labels); we can compute the scatter matrices SW and SB which are within-class and a between-class respectively SB and SW are expressed by eqn (22) and (23):43–45
| |
 | (22) |
where
μj denotes the centroid of all samples of class
j defined by the following equation:
| |
 | (23) |
| |
 | (24) |
| |
 | (25) |
where
| |
 | (26) |
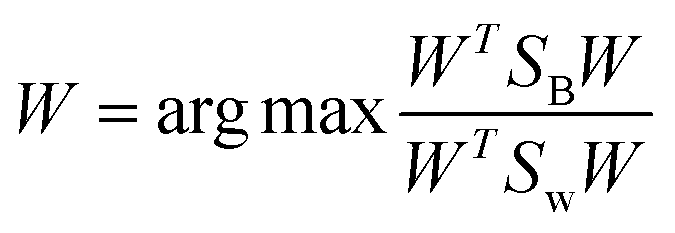
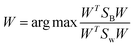
The optimization criterion for LDA is to find the optimal projection vector W. The space transformation vector W can be obtained for dimension reduction by solving the following purpose function knowing as Rayleigh quotient:43–45
| |
 | (27) |
where
W corresponds to eigen vector having the largest eigenvalue using
eqn (28) and
(29):
Or we get directly solve W vector by using the following formula:43
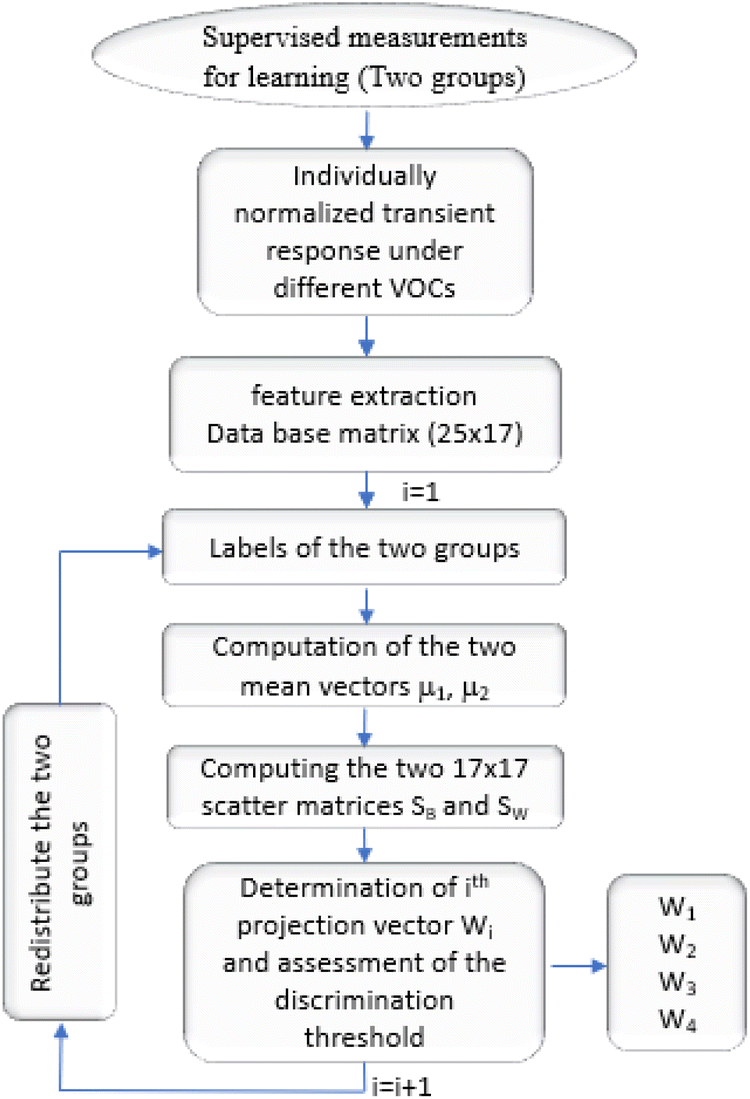
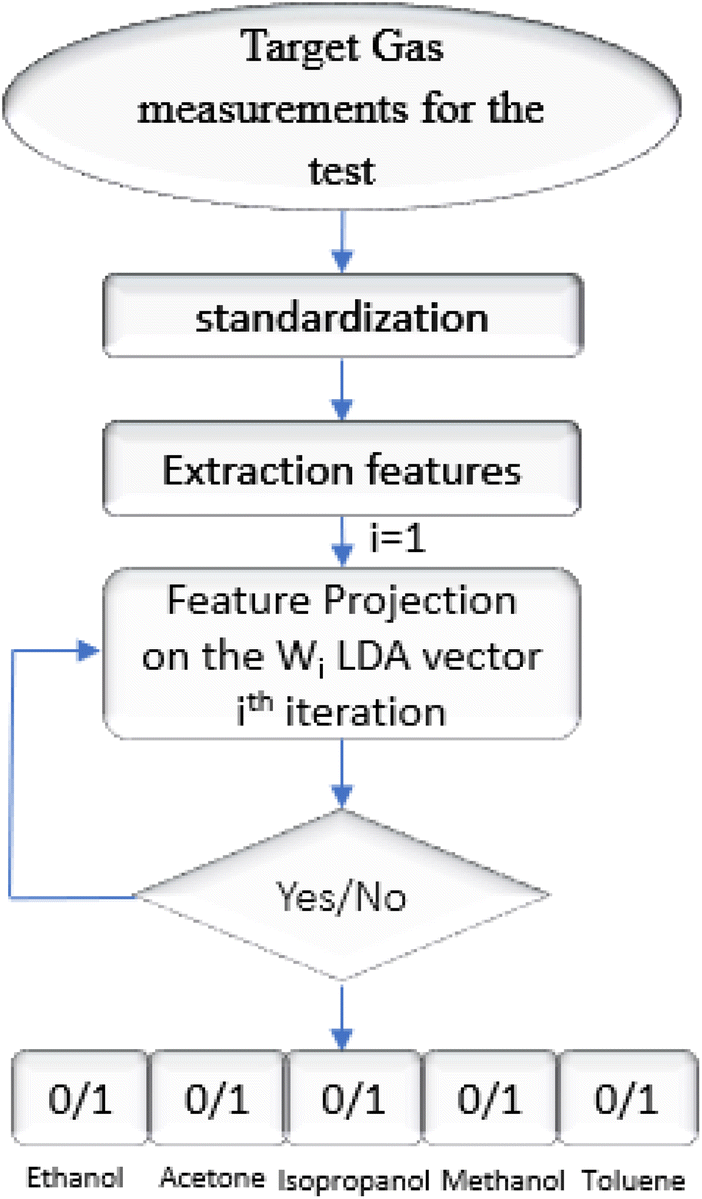
Since we were attracted to the two-clusters, the geometrical approach allows for good orientation separating the groups as closely as possible through orthogonal projections. Having this mathematical element, we had the idea of using it to ensure the discrimination of several clusters. Indeed, in this work, we suggest to separate five clusters matching 5 VOCs from supervised database. The supervised analysis consists of integrating the learning features of the VOCs with the database to determine their predictions and thus their membership in one of two groups. So, the outputs are binary (0/1). This allows us to select VOCs one by one (homogeneous group) each time to perform the separation with the others by analyzing the same data in the same way. Therefore, we define four projection vectors that make up the learning outcome for end-test recognition. Fig. 10 shows an outline of the automation algorithm as a flowchart summarizing all steps for the supervised data.
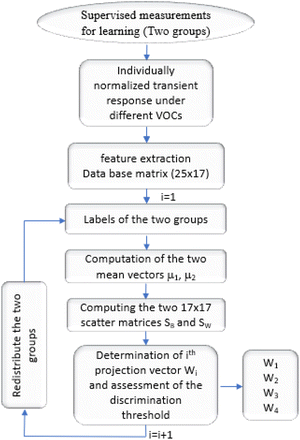 |
| | Fig. 10 Flowchart describe the steps to automatically identify VOC molecules. | |
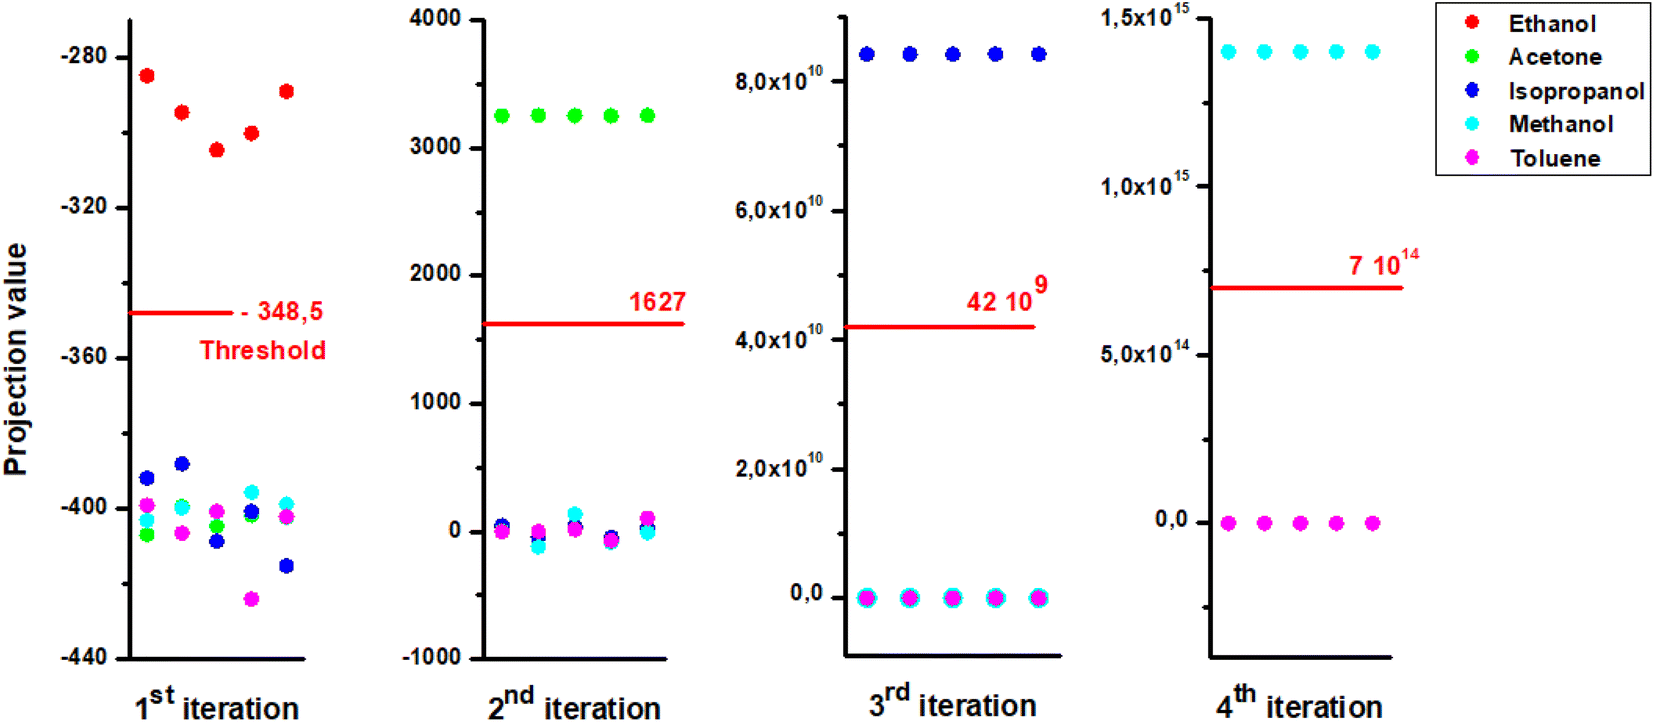
3.3.5 Results and validation. A matrix containing 25 measurements including five concentrations for each volatile compound. Each measurement is associated with seventeen properties that emerge from the transient response even before the steady state is reached (0 < t < T = 1 min). Initially, we divided our supervised measurements into two groups by selecting ethanol alone in the first group and the other four VOCs together for the second group. The result was so conclusive that we were able to determine the separation threshold for these two groups. Then comes the turn of acetone which will be chosen as the first group and the other four volatile organic compounds together. Respectively, the round will deal with the case of isopropanol and methanol. The result was very decisive as shown in Fig. 11. For the primary iteration by LDA where ethanol is alone in the first class, we set a threshold of −348. In the second step or iteration, we substitute the labeled ethanol by acetone from the database, and selected the other VOCs together, which also gave by LDA (2nd iteration) a good result with a level value of 1627. The third LDA iteration, also shows very good separation between isopropanol as a first group and other volatile organic compounds as the second one. Finally, for the last LDA iteration, we see a total distinction between methanol and toluene.
 |
| | Fig. 11 Output of analysis by LDA for different iterations by substituting homogenous cluster each time. | |
For each iteration we attribute the digit “1” to the gas belonging to the first class and the digit “0” if it has its place in the second one. Table 4 regroups the possible binary codes corresponding to the different VOCs. The flow chart in Fig. 12 shows the possible steps that must be performed for the gas recognition.
Table 4 LDA binary codes matching different VOCs
| VOCs |
1st iteration |
2nd iteration |
3rd iteration |
4th iteration |
| Ethanol |
1 |
0 |
0 |
0 |
| Acetone |
0 |
1 |
0 |
0 |
| Isopropanol |
0 |
0 |
1 |
0 |
| Methanol |
0 |
0 |
0 |
1 |
| Toluene |
0 |
0 |
0 |
0 |
 |
| | Fig. 12 Test procedure for the predicted target VOCs. | |
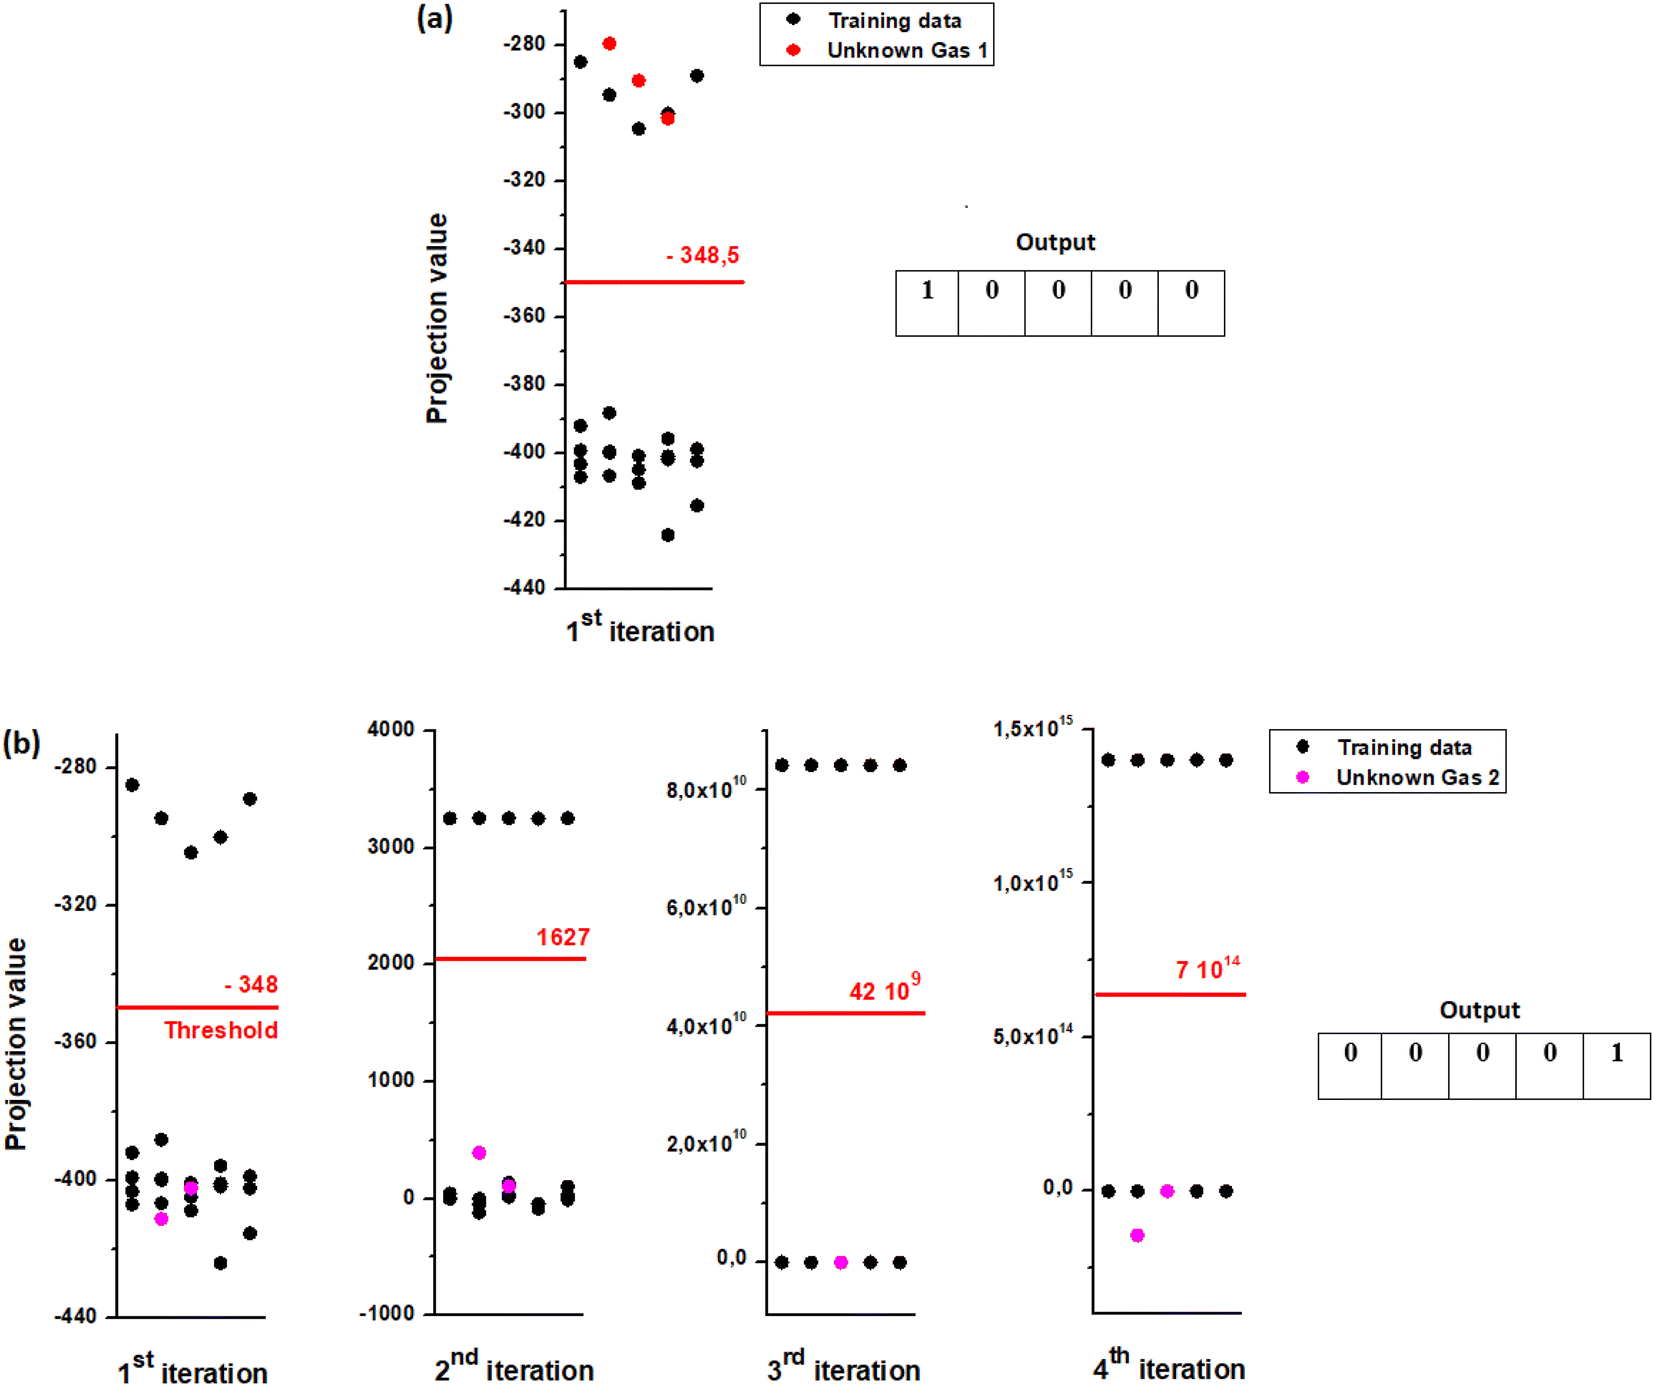
In order to validate our separation technique, we have carried out various tests. We see in Fig. 13(a and b) the binary code corresponding respectively for gas1 (ethanol) and gas2 (toluene). We note that each target vapor matches well to its group.
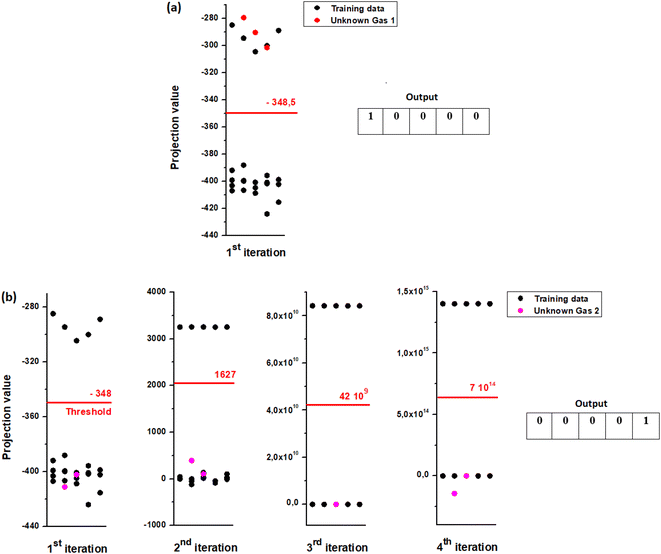 |
| | Fig. 13 LDA results for identifying unknown gases, (a) gas1 (ethanol), (b) gas2 (toluene). | |
4 Conclusion
ZnO pellets were prepared by sol–gel technique. XRD diffraction analysis reveals the formation of hexagonal wurtzite ZnO pure phase. Transmission Electron Microscopy micrograph shows that ZnO powders are formed by nanoparticles having quasi-spherical shape. The average particle size is 60 nm and each nano particle is made up of a mono crystallite. The fit of the ethanol response between 250–400 °C versus ethanol concentration shows a power law with an exponent equal to 0.5. The sensing mechanism of ZnO semiconductor was explained on the basis of the reaction between the reducing vapors with mainly O− chemisorbed oxygen ions. Similarly, the response adjustment of the VOC response at 450 °C depending on the concentration exhibits an exponent of 0.8. The latter is interpreted by the modulation of the grains bend bending qΔVS, which governs the gas response. It has been shown that the highest sensitivity (0.26 ppm−1) is observed with ethanol while the lowest level (0.041 ppm−1) corresponds to methanol. Similarly, the limit of detection (LOD) is 0.3 ppm for ethanol and 2.0 ppm for methanol. In addition, selectivity was evaluated from transient response. Linear Discrimination Analysis (LDA) method was used to find a linear combination of features that characterizes or separates classes of events. Our control tests showed that each target VOC matches well to its group. Therefore, these results revealing the potential of ZnO pellets in detecting VOCs encourage further study to improve detection properties. LDA method makes it possible to obtain good selectivity for various volatile organic compounds and can be generalized with respect to other gases such as NO2, H2S, CO. In addition, doping element such as Ga, Ag, Zn and Sn can enhance the response as well as the sensitivity. It can also upgrade the development result of LDA method possibly through probabilistic computation.
Ethical statement
The authors have no potential conflict of interest to disclose.
Data availability
The datasets generated during and/or analyzed during the current study are available from corresponding author on reasonable request.
Author contributions
Conceptualization: R. Souissi, B. Bouricha, L. El Mir, M. Abderrabba. Data curation: R. Souissi, B. Bouricha. Formal Analysis: R. Souissi, B. Bouricha, N. Bouguila, A. Labidi. Methodology: R. Souissi, B. Bouricha. Supervision: L. El Mir, M. Abderrabba. Validation: R. Souissi, B. Bouricha L. El Mir, N. Bouguila, A. Labidi, M. Abderrabba. Writing – original draft: R. Souissi, B. Bouricha. Writing – review & editing: L. El Mir, N. Bouguila, A. Labidi, M. Abderrabba.
Conflicts of interest
There are no conflicts to declare.
Acknowledgements
The authors declare that no funds, grants or other support were received during the preparation of this manuscript.
References
- L. Liu, D. Zhang, Q. Zhang, X. Chen, G. Xu, Y. Lu and Q. Liu, Smartphone-based sensing system using ZnO and graphene modified electrodes for VOCs detection, Biosens. Bioelectron., 2017, 93, 94–101, DOI:10.1016/j.bios.2016.09.084.
- F. Paraguay D, M. Miki-Yoshida, J. Morales, J. Solis and W. Estrada L, Influence of Al, In, Cu, Fe and Sn dopants on the response of thin film ZnO gas sensor to ethanol vapor, Thin Solid Films, 2000, 373, 137–140, DOI:10.1016/S0040-6090(00)01120-2.
- X. Zhang, B. Dong, W. Liu, X. Zhou, M. Liu, X. Sun, J. Lv, L. Zhang, W. Xu, X. Bai, L. Xu, S. Mintova and H. Song, Highly sensitive and selective acetone sensor based on three-dimensional ordered WO3/Au nanocomposite with enhanced performance, Sens. Actuators, B, 2020, 320, 128405, DOI:10.1016/j.snb.2020.128405.
- K. Kanda and T. Maekawa, Development of a WO3 thick-film-based sensor for the detection of VOC, Sens. Actuators, B, 2005, 108, 97–101, DOI:10.1016/j.snb.2005.01.038.
- S. Kim, S. Park, G.-J. Sun, S. K. Hyun, K. K. Kim and C. Lee, Enhanced acetone gas sensing performance of the multiple-networked Fe2O3-functionalized In2O3 nanowire sensor, Curr. Appl. Phys., 2015, 15, 947–952, DOI:10.1016/j.cap.2015.05.005.
- S. Wang, J. Cao, W. Cui, L. Fan, X. Li and D. Li, Oxygen vacancies and grain boundaries potential barriers modulation facilitated formaldehyde gas sensing performances for In2O3 hierarchical architectures, Sens. Actuators, B, 2018, 255, 159–165, DOI:10.1016/j.snb.2017.08.054.
- X. Liu, L. Jiang, X. Jiang, X. Tian, X. Sun, Y. Wang, W. He, P. Hou, X. Deng and X. Xu, Synthesis of Ce-doped In2O3 nanostructure for gas sensor applications, Appl. Surf. Sci., 2018, 428, 478–484, DOI:10.1016/j.apsusc.2017.09.177.
- X. Kang, N. Deng, Z. Yan, Y. Pan, W. Sun and Y. Zhang, Resistive-type VOCs and pollution gases sensor based on SnO2: A review, Mater. Sci. Semicond. Process., 2022, 138, 106246, DOI:10.1016/j.mssp.2021.106246.
- A. K. Srivastava, Detection of volatile organic compounds (VOCs) using SnO2 gas-sensor array and artificial neural network, Sens. Actuators, B, 2003, 96, 24–37, DOI:10.1016/S0925-4005(03)00477-5.
- W. Geng, S. Ge, X. He, S. Zhang, J. Gu, X. Lai, H. Wang and Q. Zhang, Volatile Organic Compound Gas-Sensing Properties of Bimodal Porous α-Fe2O3 with Ultrahigh Sensitivity and Fast Response, ACS Appl. Mater. Interfaces, 2018, 13702–13711, DOI:10.1021/acsami.8b02435.
- H. Sheng, S. Ma, T. Han, P. Yun, T. Yang and J. Ren, A highly sensitivity and anti-humidity gas sensor for ethanol detection with NdFeO3nano-coral granules, Vaccum, 2022, 194, 110642, DOI:10.1016/j.vacuum.2021.110642.
- W. Lawrence Bragg, LXII. The crystalline structure of zinc oxide, London, Edinburgh Dublin Philos. Mag. J. Sci., 1920, 39, 647–651, DOI:10.1080/14786440608636079.
- L. Dejam, S. Kulesza, J. Sabbaghzadeh, A. Ghaderi, S. Solaymani, Ş. Ţălu, M. Bramowicz, M. Amouamouha, A. Salehi shayegan and A. Sari, ZnO, Cu-doped ZnO, Al-doped ZnO and Cu-Al doped ZnO thin films: Advanced micro-morphology, crystalline structures and optical properties, Results Phys., 2023, 44, 106209, DOI:10.1016/j.rinp.2023.106209.
- L. Liu, Z. Mei, A. Tang, A. Alexander, A. Kuznetsov, Qi-K. Xue and X. Du, Oxygen vacancies: The origin of n-type conductivity in ZnO, Phys. Rev. B, 2016, 93, 235305, DOI:10.1103/PhysRevB.93.235305.
- M. Hjiri, F. Bahanan, M. S. Aida, L. El Mir and G. Neri, High Performance CO Gas Sensor Based on ZnO Nanoparticles, J. Inorg. Organomet. Polym. Mater., 2020, 30, 4063–4071, DOI:10.1007/s10904-020-01553-2.
- H.-B. Na, X.-F. Zhang, M. Zhang, Z.-P. Deng, X.-L. Cheng, L.-H. Huo and S. Gao, A fast response/recovery ppb-level H2S gas sensor based on porous CuO/ZnO heterostructural tubule via confined effect of absorbent cotton, Sens. Actuators, B, 2019, 297, 126816, DOI:10.1016/j.snb.2019.126816.
- S. J. Pearton and F. Ren, Advances in ZnO-based materials for light emitting diodes, Curr. Opin. Chem. Eng., 2014, 3, 51–55, DOI:10.1016/j.coche.2013.11.002.
- Y.-S. Choi, J.-W. Kang, D.-K. Hwang and S.-J. Park, Recent Advances in ZnO-Based Light-Emitting Diodes, IEEE Trans. Electron Devices, 2010, 57, 26–41, DOI:10.1109/TED.2009.2033769.
- J. Luo, Y. Wang and Q. Zhang b, Progress in perovskite solar cells based on ZnO nanostructures, Sol. Energy, 2018, 163, 289–306, DOI:10.1016/j.solener.2018.01.035.
- X. L. Zhang, K. S. Hui and K. N. Hui, High photo-responsivity ZnO UV detectors fabricated by RF reactive sputtering, Mater. Res. Bull., 2013, 48, 305–309, DOI:10.1016/j.materresbull.2012.10.030.
- S. Masoumi, M. Shokrani, S. Aghili and F. Hossein-Babae, Zinc oxide-based direct thermoelectric gas sensor for the detection of volatile organic compounds in air, Sens. Actuators, B, 2019, 294, 245–252, DOI:10.1016/j.snb.2019.05.063.
- M. Sinha, S. Neogi, R. Mahapatra, S. Krishnamurthy and R. Ghosh, Material dependent and temperature driven adsorption switching (p- to n- type) using CNT/ZnO composite-based chemiresistive methanol gas sensor, Sens. Actuators, B, 2021, 336, 129729, DOI:10.1016/j.snb.2021.129729.
- V. Postica, A. Vahl, D. Santos-Carballal, T. Dankwort, L. Kienle, M. Hoppe, A. Cadi-Essadek, N. H. de Leeuw, M.-. Terasa, R. Adelung, F. Faupel and O. Lupan, Tuning ZnO Sensors Reactivity toward Volatile Organic Compounds via Ag Doping and Nanoparticle Functionalization, ACS Appl. Mater. Interfaces, 2019, 11, 31452–31466, DOI:10.1021/acsami.9b07275.
- D. Acharyya, A. Saini and P. Bhattacharyya, Influence of rGO Cladding in Improving the Sensitivity and Selectivity of ZnO Nanoflowers-Based Alcohol Sensor, IEEE Sens. J., 2018, 18, 1820–1827, DOI:10.1109/JSEN.2018.2790084.
- L. El Mir, J. El Ghoul, S. Alaya, M. Ben Salem, C. Barthou and H. J. von Bardeleben, Synthesis and luminescence properties of vanadium-doped nanosized zinc oxide aerogel, Phys. B, 2008, 403, 1770–1774, DOI:10.1016/j.physb.2007.10.069.
- A. Labidi, A. Bejaoui, H. Ouali, F. Chaffar Akkari, A. Hajjaji, M. Gaidi, M. Kanzari, B. Bessaïs and M. Maaref, Dry air effects on the copper oxides sensitive layers formation for ethanol vapor detection, Appl. Surf. Sci., 2011, 257, 9941–9945, DOI:10.1016/j.apsusc.2011.06.112.
- O. Lupan, V. Postica, J. Gröttrup, A. K. Mishra, N. H. de Leeuw, J. F. C. Carreira, J. Rodrigues, N. Ben Sedrine, M. R. Correia, T. Monteiro, V. Cretu, I. Tiginyanu, D. Smazna, Y. K. Mishra and R. Adelung, Hybridization of zinc oxide tetrapods for selective gas sensing applications, ACS Appl. Mater. Interfaces, 2017, 9(4), 4084–4099, DOI:10.1021/acsami.6b11337.
- B. D. Cullity, Elements of X-ray Diffraction, Addison-Wesley, Reading, MA, 1978, Library of Congress Catalog Card No. 77-73950, ISBN 0-201-01174-3 Search PubMed.
- W. D. Callister Jr, Materials Science and Engineering: An Introduction, John Wiley & Sons, Inc., New York, 4th edn, 1997 Search PubMed.
- M. A. Ismail, K. K. Taha, A. Modwi and L. Khezami, ZnO nanoparticles: Surface and X-ray profile analysis, J. Ovonic Res., 2018, 14(5), 381–393 CAS.
- H. J. Al-Asedy, N. Bidin, K. N. Abbas and M. A. Al-Azawi, Structure, morphology and photoluminescence attributes of Al/Ga co-doped ZnO nanofilms: role of annealing time, Mater. Res. Bull., 2018, 97, 71–80, DOI:10.1016/j.materresbull.2017.08.050.
- M. Bagheri, A. A. Khodadadi, A. R. Mahjoub and Y. Mortazavi, Gallia–ZnO nanohybrid sensors with dramatically higher sensitivity to ethanol in presence of CO, methane and VOCs, Sens. Actuators, B, 2016, 223, 576–585, DOI:10.1016/j.snb.2015.09.137.
- S. Yan and Q. Wu, A novel structure for enhancing the sensitivity of gas sensors α-Fe2O3 nanoropes containing a large amount of grain boundaries and their excellent ethanol sensing performance, J. Mater. Chem. A, 2015, 3, 5982–5990, 10.1039/C4TA06861K.
- N. Barsan and U. Weimar, Conduction model of metal oxide gas sensors, J. Electroceram., 2001, 7, 143–167, DOI:10.1023/A:1014405811371.
- V. Postica, I. Hölken, V. Schneider, V. Kaidas, O. Polonskyi, V. Cretu, I. Tiginyanu, F. Faupel, R. Adelung and O. Lupan, Multifunctional device based on ZnO:Fe nanostructured films with enhanced UV and ultra-fast ethanol vapour sensing, Mater. Sci. Semicond. Process., 2016, 49, 20–33, DOI:10.1016/j.mssp.2016.03.024.
- T. Sekrafi, B. Bouricha, Z. Denden, S. Tascu, A. Labidi, H. Nasri and C. Dridi, IEEE Sens. J., 2021, 21, 2589–2596, DOI:10.1109/JSEN.2020.302682.
- J. Sun, L. Sun, N. Han, H. Chu, S. Bai, X. Shu, R. Luo and A. Chen, rGO decorated CdS/CdO composite for detection of low concentration NO2, Sens. Actuators, B, 2019, 299, 126832–126841, DOI:10.1016/j.snb.2019.126832.
- O. Lupan, S. Shishiyanu, L. Chow and T. Shishiyanu, Nanostructured zinc oxide gas sensors by successive ionic layer adsorption and reaction method and rapid photothermal processing, Thin Solid Films, 2008, 516, 3338–3345, DOI:10.1016/j.tsf.2007.10.104.
- P. S. Kolhe, A. B. Shinde, S. G. Kulkarni, N. Maiti, P. M. Koinkar and K. M. Sonawane, Gas sensing performance of Al doped ZnO thin film for H2S detection, J. Alloys Compd., 2018, 748, 6–11, DOI:10.1016/j.jallcom.2018.03.123.
- G. Magna, S. D. Zor, A. Catini, R. Capuano, F. Basoli, E. Martinelli, R. Paolesse and C. Di Natale, Surface arrangement dependent selectivity of porphyrins gas sensors, Sens. Actuators, B, 2017, 251, 524–532, DOI:10.1016/j.snb.2017.05.054.
- H. Abe, S. Kanaya, Y. Takahashi and S.-I. Sasaki, Extended studies of the automated odor-sensing system based on plural semiconductor gas sensors with computerized pattern recognition techniques, Anal. Chim. Acta, 1988, 215, 155–168, DOI:10.1016/S0003-2670(00)85275-7.
- B. Bouricha, T. Sekrafi, A. Labidi and C. Dridi, VOCs Identification method based on one single ZnTTP sensor, IEEE Sens. J., 2022, 22(1), 671–677, DOI:10.1109/JSEN.2021.3129447.
- X. Jin, M. Zhao, T. W. S. Chow and M. Pecht, Motor Bearing Fault Diagnosis Using Trace Ratio Linear Discriminant Analysis, IEEE Trans. Ind. Electron., 2014, 61(5), 2441–2451, DOI:10.1109/TIE.2013.2273471.
- H. Li, D. Luo, Y. Sun and H. GholamHosseini, Classification and Identification of Industrial Gases Based on Electronic Nose Technology, Sensors, 2019, 19(22), 5033, DOI:10.3390/s19225033.
- Y. Li, B. Liu, Y. Yu, H. Li, J. Sun and J. Cui, 3E-LDA: Three Enhancements to Linear Discriminant Analysis, ACM Trans. Knowl. Discovery Data, 2021, 15(4), 1–20, DOI:10.1145/3442347.
|
| This journal is © The Royal Society of Chemistry 2023 |
Click here to see how this site uses Cookies. View our privacy policy here. 
 Open Access Article
 This Open Access Article is licensed under a Creative Commons Attribution-Non Commercial 3.0 Unported Licence
 *a,
B. Bourichaa,
N. Bouguilab,
L. El Mirb,
A. Labidic and
M. Abderrabbaa
*a,
B. Bourichaa,
N. Bouguilab,
L. El Mirb,
A. Labidic and
M. Abderrabbaa