 Open Access Article
Water structure modification by D-(+)-glucose at different concentrations and temperatures-effect of mutarotation†
Mohammad Hossain a,
Noortaz Chowdhurya,
Amiya Atahara and
Md. Abu Bin Hasan Susan
 *ab
*ab
aDepartment of Chemistry, University of Dhaka, Dhaka 1000, Bangladesh
bDhaka University Nanotechnology Center (DUNC), University of Dhaka, Dhaka 1000, Bangladesh. E-mail: susan@du.ac.bd
First published on 23rd June 2023
Abstract
Water structure modification by carbohydrates is essential both in chemistry and life processes and in particular, molecular level interaction of glucose with water is very important. With a view to developing a fundamental knowledge base, thermodynamic parameters derived from measurements of density, viscosity, and refractive index have been analyzed to investigate how D-(+)-glucose alters the structure of water at various concentrations and temperatures. The nature and extent of the interactions have been investigated using apparent molar volume, Jones–Dole constants, changes in free energy (ΔG), changes in entropy (ΔS), and changes in enthalpy (ΔH) for viscous flow. Using measurements from dynamic light scattering (DLS), the sizes of the aggregates were studied. The kinetics of mutarotation have been investigated using polarimetry and the structural effect on water during mutarotation between α-D-glucose and β-D-glucose with time has been explored by near-infrared (NIR) spectroscopy. The spectroscopic results were examined using difference spectroscopy and two-dimensional correlation spectroscopy (2DCOS). The absorption bands of water shift to a higher wavenumber irrespective of the concentration of the solution with time due to the enhancement of the cleavage of hydrogen bonding in water. At high temperatures, three bands in the region 7100–7350 cm−1 are attributed to the first overtones of the hydrogen-bonded –O–H stretching vibration. Refractive index values indicate an increase in the density of the anomer solutions with time, suggesting an increase in free water concentration. These results provide evidence for more than one water molecule being involved in the mechanism of mutarotation and propose a concerted mechanism for proton transfer.
1 Introduction
Water is the substance that makes up the majority of the surface of the Earth. It is the main component of all living things and essential in chemical processes.1,2 In practice, a large number of chemical reactions occur in aqueous medium. The rate and thermodynamic activation parameters of the reactions are influenced by the effects of water as a solvent. To understand the mechanisms of these chemical reactions, the structure and dynamics of water need to be understood.3,4 There is strong evidence that the three-dimensional network of hydrogen bonds in liquid water is large but transient.5–8 This extensive network of hydrogen bonds gives water its highly structured liquid state.9 The idea of “water structure” has been used to elucidate a variety of aqueous phenomena.10 It is interesting to note that temperature and various additives can change the water structure and, consequently, the fundamental properties of water.11–16 The bonds in the dynamic network are formed or broken in picoseconds due to the hydrogen bonding that occurs between water molecules. Hence, it is challenging to probe the structure of water. Despite the challenges, it is crucial to understand the local structure because water is fundamentally important in chemical processes.17 Various experimental techniques like femtosecond mid-infrared (IR), pump-probe 2D IR, far-IR (FIR), X-ray diffraction, high-pressure X-ray, Raman, neutron diffraction, differential and titration scanning calorimetry, nuclear magnetic resonance (NMR), optical Kerr effect (OKE), terahertz (THz), high-pressure THz, THz-Fourier transform infrared (FTIR), THz-time-domain spectroscopy (TDs), combined THz-Raman, optical pump-THz probe spectroscopies and theoretical tools like ab initio, classical molecular dynamics (MD), Monte Carlo (MC), quantum mechanics/molecular mechanical (QM/MM) simulations, density functional theory (DFT) computations have been used to investigate hydrophilic and hydrophobic hydration, hydrogen bond network dynamics upon solvation, bulk water, tetrahedral hydration water, and more disordered (or interstitial) hydration water, retardation in the hydration bond dynamics in the vicinity of anions and cations, size of the hydration shell, clathrate hydrates and semi-clathrates, local electrostatics, etc.18–25Water is thought to undergo structural changes when solutes are added, much like when the temperature is altered. Due to the presence of hydroxyl groups, carbohydrates are one of the most fascinating additives to impact the structure of water.1 An in-depth analysis of physicochemical properties can provide a comprehensive interpretation of interactions in binary systems with variations of temperature since these characteristics of a given system are the obvious indicator of the microscopic level interactive features.26
Solution properties of carbohydrate solutions are of great interest not just for numerous domains of fundamental research, but also as key molecules in life processes.27 Several thermodynamic28–30 and spectroscopic31,32 studies have revealed that the number and position of hydroxyl groups within carbohydrate molecules affect the hydration of carbohydrates.33 Glucose is possibly the most elegant example of carbohydrates, which depending on its concentration breaks or forms the water structure.34 Dynamic light scattering (DLS) has been a well-established modus operandi for investigating particle aggregation, identifying and measuring biomolecules, and examining particle–particle interaction.35–38 It can provide a comprehensive picture of glucose aggregation and its subsequent impact on the structure of water.39
Further studies with sugars, especially monosaccharides have a limitation-the spontaneous interconversion or mutarotation of monosaccharides when dissolved in water. The mechanism of mutarotation and how many water molecules participate in the transition state are still up for debate. Among all the other monosaccharides, glucose is the most essential for the human body. It finds applications in food, candy, soft drinks, low-calorie sweeteners, and pharmaceutical industries. It is also a precursor of many products including citric acid, lactic acid, and surfactants. It is an essential carbohydrate that is a source of energy to the human body providing nutrients to the organs, muscles, and nervous systems of the human body. The detailed work on water structure modification in the literature is very scarce due possibly to its ability to undergo mutarotation in aqueous solution. It can exist in three states-an open chain form and two pyranose ring structures containing five –O–H groups. The ring structure has two different configurations differing only in carbon number one. These are called anomers of each other. If –O–H of the first carbon is in an axial position it is called α-D-glucose, while if –O–H is in an equatorial position it is the β-D-glucose. Kinetic studies of the mutarotation of glucose show that the rate of mutarotation changes with time, temperature, and concentration.40–44 Spectroscopic studies have been conducted to provide evidence for structural change of glucose with time,45,46 while a systematic study of mutarotation between glucose anomers in water using perturbations such as time, concentration, and temperature is not available. The molecular level interaction of glucose with water is very important and a fundamental knowledge base needs to be developed on water structure modification with a focus on mutarotation because of its undeniable participation both in industries and life processes. In this work, thermodynamic study, photon correlation spectroscopy, and near-infrared (NIR) spectroscopy have been exploited to understand how mutarotation is involved in the modification of water structure.
2 Experimental
2.1 Materials
Merck KGaA, Sigma Aldrich, and Tokyo Chemical Industry Co. Ltd provided D-(+)-glucose anhydrous, α-D-glucose, and β-D-glucose, respectively. Deionized water with a specific conductivity of 0.055 μS cm−1 was used to prepare the stock and sample solutions. Deionized water was prepared by BOECOpure (Model: BOE-8082060, Germany) using distilled water (Ivymen, Model: AC-L8, Greece). Additionally, other uses for the ultrapure water included washing glassware.2.2 Methods and instrumentation
The aqueous solutions of D-(+)-glucose were prepared at concentrations ranging from 0.5 M to 3.0 M with an interval of 0.5 M. The densities of all the D-(+)-glucose aqueous solutions were assessed using a vibrating tube density meter (Anton Paar, Model: DMA 4500). Deionized water was used to calibrate the instrument. The built-in thermostat was used to maintain the density of the solution within 0.01 K since it is very sensitive to temperature. The repeatability of the density values at each temperature was 0.00001 g cm−3.The viscosities of all the D-(+)-glucose solutions were measured using a Lovis 2000 M/ME microviscometer with an accuracy of 10−6 mPa. Capillaries having diameters of 1.59 mm and 2.5 mm and gold balls with a maximum deviation in the measurement of 0.1% were used for measurements. The capillaries were calibrated with supplied S3 and N100 oils. The temperature was regulated using a built-in temperature controller with an accuracy of 0.01 K.
An Anton Paar automated refractometer (Model: Abbemat 300) was used to measure the refractive indices of α-D-glucose and β-D-glucose of 2.5 M concentration at 25 °C up to 30 min. The measurements had a resolution of ±1 × 10⁻⁵. Using the built-in thermostat, the temperature of the experiment was kept within 0.1 K of the target level.
With a temperature range of 20–60 °C and a 5 °C interval, DLS measurements of all the aqueous solution of D-(+)-glucose were carried out using a Zetasizer Nano ZS90 (ZEN3690, Malvern Instruments Ltd., UK). Internal Peltier elements were used to control the temperature. The sample was taken in a glass cell with a round aperture. The cell was made dust-free by cleaning it with water and ethanol. A 632.8 nm He–Ne laser beam was used as the light source. The measurements were performed at a 90° angle. All the samples were filtered using a 0.45 μm polytetrafluoroethylene (PTFE) membrane filter and the sample solutions were allowed to stand for about 24 h after filtration to reach equilibrium before taking DLS measurements. The hydrodynamic diameter (Dh) of the aggregates was analysed using intensity and number average data.
The changes in the angle of rotation of 0.5 M to 2.5 M aqueous solutions of pure α-D-glucose with time were measured by an automatic digital polarimeter (PAD 300, SCO Tech, Germany) at room temperature (30 °C). The sample solutions were taken to a polarimeter glass tube, 10 cm in length. The accuracy of the measurements was ±0.01° and the resolution was 0.001°.
NIR spectra of aqueous solutions of pure α-D-glucose and β-D-glucose of 0.5 M to 2.5 M concentrations were captured by a Fourier transform spectrophotometer (PerkinElmer, USA, Frontier FT-IR/NIR) with 20 scans for each sample in the 4000–10000 cm−1 range at a resolution of 4.0 cm−1. The measurements were taken using a pair of rectangular CaF2 windows (Specac Model No. GS20522) with a path length of 0.1 mm. A heatable liquid sampling cell was used which was very sensitive. Polytetrafluoroethylene (PTFE) spacers were used to change the path length. The temperature was regulated using an electrical heating jacket (Specac Model No. GS20730), and cold water was circulated in the jacket to maintain a constant temperature.
3 Results and discussion
3.1 Volumetric analysis of D-(+)-glucose aqueous solutions
Various concentrations and a temperature range of 20 to 60 °C have been used to measure the density values of D-(+)-glucose sample solutions. The density rises as the concentration of D-(+)-glucose rises as a result of various types of hydrogen bonds formed between sugar and water. On the other hand, as the temperature rises, the number and strength of hydrogen bonds decrease, resulting in a reduction in the density. The apparent molar volume of D-(+)-glucose in the binary system at various concentrations and temperatures was calculated to study the nature of solute–solvent and solute–solute interactions using
 | (1) |
| Φv = Φ0v + Svm | (2) |
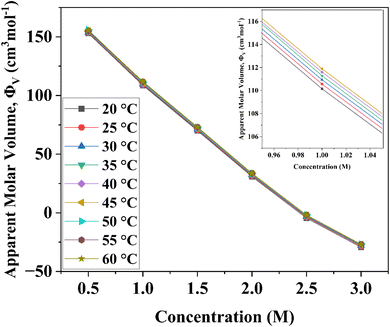 | ||
| Fig. 1 Variation of apparent molar volume of D-(+)-glucose aqueous solutions from 0.5 M to 3.0 M concentration and in the temperature range of 20 °C to 60 °C with the variations in the concentration of D-(+)-glucose. The apparent molar volume was determined from density data using eqn (1). | ||
The values of Φ0v and Sv for various temperatures are listed in Table 1. The first derivative values of Sv show the rate of change of Sv and the second derivative values show the increase or decrease of the rate of change. The increasing Φ0v indicates the increasing water–D-(+)-glucose interaction and decreasing Sv indicates the decreasing D-(+)-glucose–D-(+)-glucose interaction.

 and Sv using eqn (2).
  and
and  were obtained by the first and second derivative of Φ0v with respect to absolute temperature, T (K) respectively
| Temperature T, K | Φ0v, cm3 mol−1 | Sv, cm3 kg mol−2 | cm3 mol−1 K−1 | cm3 mol−1 K−2 |
|---|---|---|---|---|
| 293.15 | 183.8078 | −44.3771 | 0.07941 | 2.004 × 10⁻⁴ |
| 298.15 | 184.20484 | −44.28622 | 0.08041 | 2.169 × 10⁻⁴ |
| 303.15 | 184.6119 | −44.23525 | 0.08158 | 3.366 × 10⁻⁴ |
| 308.15 | 185.02061 | −44.2201 | 0.08378 | 9.519 × 10⁻⁴ |
| 313.15 | 185.44966 | −44.23804 | 0.0911 | 0.00447 |
| 318.15 | 185.93157 | −44.2981 | 0.12849 | −0.00509 |
| 323.15 | 186.73457 | −44.46165 | 0.04018 | −0.01065 |
| 328.15 | 186.33342 | −44.33916 | 0.02204 | 0.00841 |
| 333.15 | 186.95494 | −44.5023 | 0.1243 | 0.02045 |
The empirical Sv values for the aqueous mixture of D-(+)-glucose at all the working temperatures are negative. This means that D-(+)-glucose + H2O interactions are stronger than D-(+)-glucose + D-(+)-glucose interactions. Solvent molecules surround every ion and the ions are infinitely far from each other. Therefore, Φ0v is unaffected by D-(+)-glucose–D-(+)-glucose interaction and it is a measure of the D-(+)-glucose + H2O interaction. Positive Φ0v values indicate strong D-(+)-glucose + H2O interaction.
3.2 Viscometric study of aqueous solutions of D-(+)-glucose
As D-(+)-glucose concentration increases, viscosity rises as a result of an increase in intermolecular force or hydrogen bonding. Conversely, as there are fewer intermolecular interactions at higher temperatures, the viscosity of the solutions decreases. The Jones–Dole equation is used to investigate the interactions between solutes and solvents. The data of solution viscosities are used.
 | (3) |
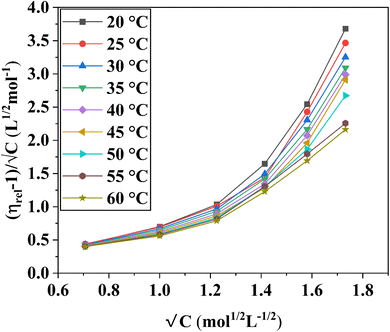
In the Jones–Dole equation, constant A represents the Falkenhagen coefficient, which exhibits solute–solute interaction and is independent of solution concentration. The size, charge, and other properties of the solute particles have an impact on the other constant B, also referred to as the Jones–Dole coefficient. Constant B provides information on the hydration of solute particles and solute–solvent interaction. Greater solvophobic interaction between the solute and solvent is indicated by a higher B value, whereas stronger hydrogen bonds between the solute and solvent molecules are indicated by a lower B value.47 The intercept and slope of a linear plot of  versus √C are used to evaluate the values of solute–solute and solute–solvent interactions. The variation of
  as a function of √C is shown in Fig. 2.
The Jones–Dole constants A and B are shown in Table 2 as a function of temperature. The B derivatives and Jones–Dole constants change as the temperature increases, as shown in Table 2. As the temperature rises, the glucose–glucose interaction grows as A grows. In contrast, the majority of B-coefficient values fall as the temperature rises. A decrease in the value of B as well as the negative dB/dT values show structure-forming effect of D-(+)-glucose molecules on solvent due to solvophobic interaction.
 is obtained by the first derivative of B with respect to absolute temperature, T (K)
| Temperature, T (K) | A | B | dB/dT |
|---|---|---|---|
| 293.15 | −4.32379 | 1.17295 | −8.52 × 10⁻⁴ |
| 298.15 | −3.95622 | 1.16869 | −0.01682 |
| 303.15 | −3.67008 | 1.00477 | −0.02123 |
| 308.15 | −3.42128 | 0.95641 | −0.00539 |
| 313.15 | −3.2918 | 0.95088 | −1.71 × 10⁻⁴ |
| 318.15 | −3.15441 | 0.9547 | −0.01599 |
| 323.15 | −2.82412 | 0.79099 | −0.04223 |
| 328.15 | −2.24907 | 0.53236 | −0.02729 |
| 333.15 | −2.09666 | 0.51807 | −0.00286 |
3.3 Thermodynamic parameters of D-(+)-glucose in water
The Eyring equation was used to calculate the change in free energy of activation for viscous flow.48
 | (4) |
The viscous flow is correlated with the change in Gibbs free energy of activation, ΔG. The ΔG regulates the rate of fluid flow, which is determined by the ability of molecules to enter the hole and the ease with which the liquid creates the hole.49 Since its inception, the hole theory of liquids has been around for a very long period. This theory, which was created to explain the thermal and viscosity characteristics of liquids at equilibrium, assumes that a liquid can be thought of as a continuum perforated by holes. The quantity of holes is comparable to the quantity of liquid particles. Eyring's theory of shear viscosity, which assumes that there are holes in the liquid and that flow occurs through thermally induced jumps of “molecules” (volume Vm) between the holes, can be related to the function of ΔG. The following prerequisite must be met for the viscosity theory to be applicable. A molecule must stay in the new minimum long enough to release the energy it had while crossing the previous barrier after moving from one minimum to the next. As a result, it must randomly obtain additional activation energy at each minimum. Based on this hole theory, the free energy of activation for viscous flow, ΔG has been determined.50,51
As D-(+)-glucose concentration rises, the positive values of ΔG also rise, indicating that D-(+)-glucose molecules are associated with water molecules (Fig. 3). The decrease in the ΔG with increasing temperature indicates less association of glucose molecules with water molecules and a decrease in self-aggregation property of glucose molecules (cf. Fig. S1 ESI†).
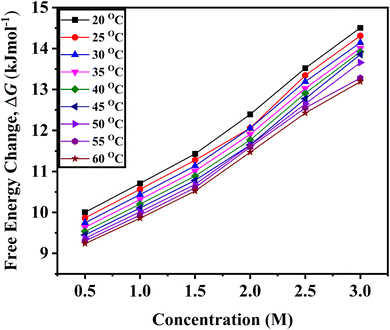 | ||
| Fig. 3 Variation of the change in free energy of activation, ΔG determined from eqn (4) for viscous flow with the variation of concentration of D-(+)-glucose from 0.5 M to 3.0 M in the temperature range of 20 °C to 60 °C. | ||
The physical significance of the positive value of ΔG is that in D-(+)-glucose + water, the interactions between the molecules of the solvent and solute are stronger in the ground state than in the transition state. Hence, in terms of free energy, the solvation of solute in the transition state is nonspontaneous and unfavourable. Molecules absorb energy to do useful work. With an increase in D-(+)-glucose concentration, the value of ΔG rises. This indicates that as the concentration of D-(+)-glucose rises, the unfavourable interaction between the solute and solvent intensifies.52 The majority of the D-(+)-glucose molecules self-aggregate and form an ice-like structure that is surrounded by tetrahedrally arranged water molecules when D-(+)-glucose is added. A small amount of the D-(+)-glucose molecules form hydrogen bonds with water. The addition of glucose increases the size of various clusters, and they become more resistant to becoming holes or forming new holes. The movement of large clusters requires more energy.53
Despite some discontinuities, it has been observed that the entropy of solution is positive regardless of temperature and that it rises with rising D-(+)-glucose concentration (cf. Fig. S2(a) ESI†) and falls with rising temperature (cf. Fig. S2(b) ESI†), indicating a more ordered system. The positive ΔS indicates that a lower number of hydrogen bonding interactions occurs during viscous flow. The less positive values of ΔS at lower D-(+)-glucose concentrations suggest that along with the different water clusters already present in the system, dimers, trimers, or small aggregates of D-(+)-glucose are also formed. As oligomeric and polymeric aggregates of D-(+)-glucose tend to assemble the water molecules, the value of ΔS decreases with increasing D-(+)-glucose concentration regardless of temperature.
The change in entropy of activation, ΔS is calculated by equation,48
 | (5) |
The thermodynamic relation yields the enthalpy of activation of viscous flow, ΔH.
| ΔH = ΔG + TΔS | (6) |
Changes in enthalpy increase with increasing D-(+)-glucose concentration (cf. Fig. S3(a) ESI†) and decrease with increasing temperature (cf. Fig. S3(b) ESI†). D-(+)-glucose solvation in water is endothermic, according to positive ΔH values. Hence, mixing glucose in water decreases the temperature of the solution. As the concentration of D-(+)-glucose increases, the ΔH increases, impeding the mobility of the molecules and ultimately increasing activation energy. Based on the hole theory, holes must be present for solvents to flow. The dissolution process involves disrupting the normal water network to allow the D-(+)-glucose molecules to disperse and form a mixture. D-(+)-glucose molecules cannot easily vibrate when they are confined in the solid lattice. On the other hand, the molecules dispersed in the solvent can move around, rotate, and vibrate. As a result, in the solid state, energy is needed to dissociate the intermolecular interactions between D-(+)-glucose molecules.
3.4 Analysis of DLS results
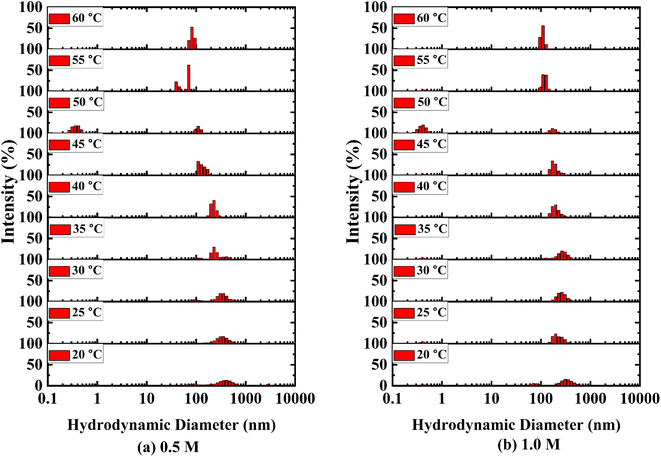
The size distribution for binary systems of glucose and water at different concentrations was investigated using DLS measurements (Fig. 4 and S4 ESI†). Three different aggregations between glucose and water were found in the binary systems based on their hydrodynamic diameter and coexisted dynamically. The smallest associations are less than 1 nm and the largest particles towards 5000 nm are less prominent than medium-sized particles from 100 nm to 1000 nm. It is apparent that the medium and large-sized aggregations became smaller as a result of the breaking down of aggregations with rising temperature. Eventually, the intensity of small-sized clusters increased. A large number of smaller-sized species is found at 50 °C in 0.5 M and 1.0 M solutions which is exceptional in this trend (Fig. 4(a) and (b)). This is due to the anomalous behaviour of water at this temperature.54 As the concentration of glucose in aqueous systems increases, the hydrodynamic diameter of those species also increases (cf. Fig. S5 ESI†). The formation of larger species indicates the formation of intermolecular hydrogen bonding among glucose molecules and the ordered structure of water around that cluster.3.5 Kinetics of mutarotation
D-Glucose shows mutarotation because it undergoes interconversion between its α and β (+) glucopyranose structures following:| α-D-Glucose ⇌ β-D-glucose |
The kinetics of conversion from α-D-glucose to β-D-glucose has been investigated in this study.
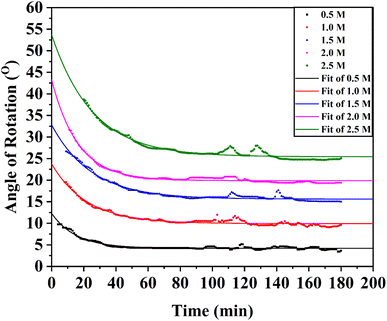
The solvent water was in large excess and the rate equation for the pseudo-first-order reaction can be written as,  where, S denotes sugar, α-D-glucose and k denotes the rate constant of the first-order reaction. The progress of the reaction was measured by measuring the optical rotation of the plane polarized light by the solutions of α-D-glucose at room temperature (30 °C) (Fig. 5). If θ0, θt and θ∞ are the angle of rotation at time 0, t and ∞ respectively, then, [S]0 = d(θ0 − θ∞) and [S]t = d(θt − θ∞); where d is a proportionality constant. Since the mutarotation follows first-order kinetics, [S]t = [S]0e−kt. Therefore, θt − θ∞ = (θ0 − θ∞)e−kt. Hence,
| θt = θ∞ + (θ0 − θ∞)e−kt | (7) |
It is apparent from the optimized values of θ0, θ∞, and k listed in Table 3 that the rate of mutarotation of α-D-glucose in water was prominent at ambient temperature.
| No. of solution | Concentration (mol L−1) | θ0 (°) | θ∞ (°) | k (s−1) |
|---|---|---|---|---|
| 01 | 0.5 | 12.307 | 4.216 | 0.065 |
| 02 | 1.0 | 23.754 | 9.927 | 0.045 |
| 03 | 1.5 | 32.816 | 15.615 | 0.040 |
| 04 | 2.0 | 43.248 | 19.883 | 0.061 |
| 05 | 2.5 | 53.701 | 25.415 | 0.039 |
3.6 Spectroscopic study on mutarotation
With reference to the first spectrum obtained at 6 min after the solution was prepared, the difference spectra of glucose solutions at various concentrations at room temperature were taken. The time difference spectra of aqueous α-D-glucose solutions revealed significant changes as shown in Fig. S6 ESI.† Negative peaks appear at a lower wavenumber; while positive peaks appear at a higher wavenumber. At a longer period, the intensity of both peaks increases. A similar trend was observed for aqueous β-D-glucose solutions (Fig. 6). This shows that the band changes to a higher wavenumber over time and reveals that the effect of mutarotation with time is such that it raises the concentration of free water or species of water with weak hydrogen bonds. The presence of an isosbestic point suggests an equilibrium between the two species of water.55,56 It might also suggest that glucose first enters the water cluster and undergoes mutarotation by the effect of the strongly hydrogen-bonded water clusters. The water clusters as a result break to increase the free water concentration.However, at lower concentrations, the trend in time difference spectra for both anomers seemed to be disrupted. This might occur due to the simultaneous effect of the breaking of water clusters by two perturbations. In dilute solutions, glucose molecules act as water structure breakers,34 as a result the effect of only mutarotation could not be observed.
Time-dependent difference spectra were also reviewed at various temperatures with reference to the first spectrum measured at 12 min after the solution was prepared (Fig. S7 ESI†). The difference spectra of 0.25 M α-D-glucose and β-D-glucose solutions at 30 °C as well as 55 °C show that the positive peaks appear at lower wavenumbers and the negative peaks appear at higher wavenumbers. For the peak intensity, the positive ones decrease while the negative ones increase with time.
At high temperatures, the positive peak appears to be vanishing and three distinct peaks are noticeable in the region of 7100–7350 cm−1. The first overtone of –O–H bond of water and glucose might be assigned to these peaks. Bands in this region have been assigned to monomeric hydrogen-bonded first overtones in the literature.57,58 Furthermore, these bands are not affected by temperature. Three bands are observed at 7160, 7240, and 7340 cm−1 at high temperatures, and the positions of these bands are constant with increasing temperature (cf. Fig. S8 ESI†).
The interpretation of time-dependent 2D spectra for synchronous maps was consistent with the results observed in the spectral region 4400–5600 cm−1 by difference spectroscopy. The synchronous spectrum shows the four-leaf-clover cluster pattern, which is not at all symmetric (cf. Fig. S9 ESI†). The positive peaks are coloured red and negative peaks are coloured blue. The two autopeaks along the diagonal are disproportionate to each other and the sign of the cross peaks are both negative. This suggests that there are two possibilities. Either the position of the band in this region shifts is coupled with intensity change or there exists two overlapping bands that are also coupled with intensity change.59 Furthermore, the presence of two autopeaks here suggests two overlapping bands; one is in the higher wavenumber region, other in the lower region, and the intensity of one component increases at the expense of the other. The same phenomena in Fig. S9 ESI† indicate that the intensity change of the overlapping band occurs at two different wavenumbers, 5025 and 5235 cm−1. The negative cross-peaks reveal that the intensity of one component increases while diminishing the other.
The asynchronous map didn't develop any distinct cross-peak. This is likely because converting water clusters into free water is a one-step reaction or because any intermediate species have a very short lifetime that makes them impossible to be detected.
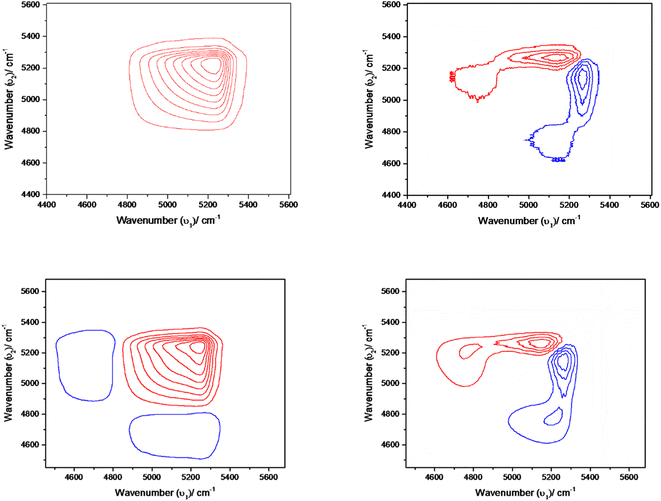
Fig. 7 shows the synchronous map of the combination band in the NIR region 4400–5600 cm−1 for aqueous α-D-glucose and β-D-glucose solutions of 1.0, 1.5, 2.0, and 2.5 M concentrations. The band at 5025 cm−1 is missing from the concentration-dependent synchronous map suggesting that the corresponding band does not change its spectral intensity to a great extent under a perturbation such as concentration. However, a strong autopeak is observed at 5235 cm−1. The asynchronous peak shows elongated peaks; positive above the diagonal and negative below the diagonal. This suggests that with increasing concentration, the position of the band shifts from a higher wavenumber to a lower wavenumber. This represents reinforcement of the property of sugar by the water structure.
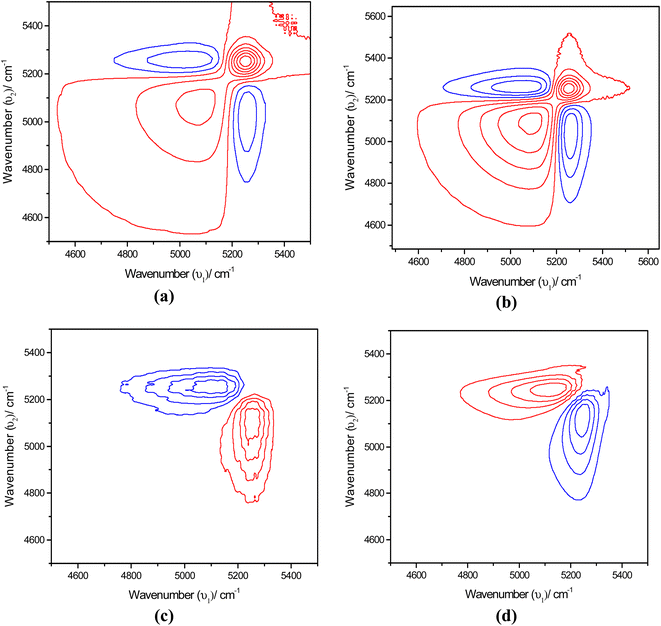
The synchronous map in Fig. 8(a) and (b) resembles the time-dependent synchronous map revealing the same features. However, the difference is in the position at which the autopeaks are developed. Positive peaks appear at 5082 and 5025 cm−1. On the other hand, a simple asynchronous map being developed in this region excludes the possibility of other complications such as line broadening with temperature. Simply, in the asynchronous map for an α-D-glucose solution, the positive peak appears at 5250 cm−1 and the negative peak appears at 5082 cm−1 suggesting that spectral intensity at 5250 cm−1 changes before 5082 cm−1. For a β-D-glucose solution the phenomenon is reversed; the spectral intensity at 5082 cm−1 changes before 5250 cm−1. Fig. 8(c) and (d) illustrate the asynchronous maps of both anomer solutions.
The breaking of water clusters due to mutarotation was indicated with refractive index studies as well (Fig. S10 ESI†). Refractive indices of α-D-glucose, and β-D-glucose solutions of 2.50 M concentration at different time intervals show that the refractive index increases linearly with time at all concentrations giving the most significant change at the highest concentration. An increase suggests that with time the solutions became denser,60 which is possible due to the mutarotation of glucose anomers. The mutarotation might have increased the weakly hydrogen-bonded species of water by breaking the less dense water clusters. As a result, water contributed to the increase in the density of the medium with time. Between 10–15 min, a slight change of linearity was observed for both anomer solutions. For α-D-glucose a slight decrease and β-D-glucose an increase was observed. This might be an indication that the relative concentration of the anomers in the solutions tends to reach equilibrium.
3.7 D-(+)-Glucose–water interactions on water structure modification and effect of mutarotation
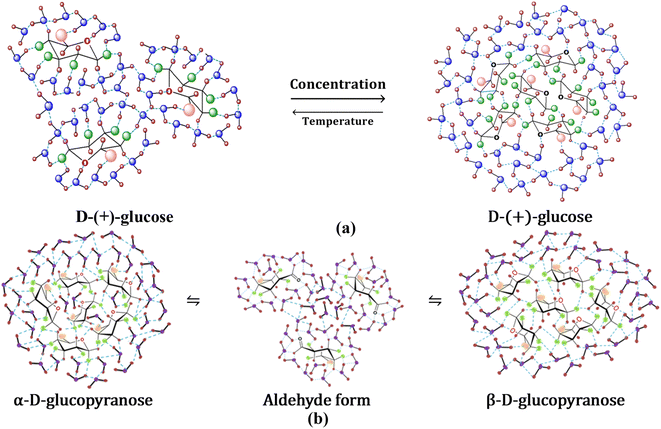
Hydroxyls are split off from the solute faces when the configuration is equatorial. To the periphery, intramolecular hydrogen bonding is more predominant, where hydroxyls interact instead of solvent molecules.61 Glucopyranosides, or sugars with OH-4 in an equatorial configuration, have very little OH-4-to-OH-6 hydrogen bonding. Because of its free interaction with solvent molecules, the OH-6 does not participate in intramolecular hydrogen bonding in general. The anomeric carbon (C1) has less influence on hydrogen bonding, and in D-(+)-glucose, all OH groups are considered to be in the equatorial position, forming intermolecular hydrogen bonds with the solvent molecules. Because of this, water molecules and D-(+)-glucose molecules can easily form hydrogen bonds at lower concentrations, and water structure breaking prevails (Fig. 9(a)). However, at higher concentrations, intermolecular hydrogen bonding between glucose molecules is possible, as well as water molecules form an ordered structure around glucose. At higher concentrations, this could be attributed to D-(+)-glucose acting as a structure maker (Fig. 9(a)). Self-aggregation property of glucose molecules decreases with increasing temperature and water structure breaking predominates at high temperatures. With the progress of mutarotation, water clusters break to increase the concentration of free water representing structure-breaking characteristics (Fig. 9(b)).4 Conclusion
D-(+)-Glucose molecules associate more strongly with water as the concentration rises. The hindrance in the mobility of molecules increases with increasing concentration of D-(+)-glucose. At high concentrations, D-(+)-glucose exhibits structure-making behavior, while at low concentrations, it exhibits structure-breaking behavior. Structure-breaking behavior increases with increasing temperature. At concentrations above 1.0 M, both α-D-glucose and β-D-glucose affect water structure in the same manner at room temperature, while at concentrations below 1.0 M, their effect is ambiguous. During the mutarotation of glucose anomers, going through an intermediate, the strongly hydrogen-bonded species of water decrease as the weakly hydrogen-bonded species increase. Liquid water becomes denser as the mutarotation of glucose proceeds revealing the structure-breaking behavior of open-chain aldehyde form during the mutarotation process. The fundamental analysis in this study has improved the understanding of the interaction between water and glucose and may underpin further development to describe the mechanism of mutarotation of glucose or other monosaccharides.Author contributions
Mohammad Hossain: conducting experiments, data interpretation, analysis, writing – original draft preparation, reviewing and editing; Noortaz Chowdhury: conducting experiments, data interpretation, writing – original draft preparation, Amiya Atahar: data interpretation and analysis; Md. Abu Bin Hasan Susan: conceptualization, writing – reviewing and editing, supervision, funding acquisition, resources.Conflicts of interest
There are no conflicts to declare.Acknowledgements
The authors acknowledge Bose Center for Advanced Study and Research in Natural Sciences for its financial support. MH also acknowledge an NST fellowship from the Ministry of Science and Technology, Bangladesh.References
- T. Afrin, S. N. Karobi, M. M. Rahman, M. Y. A. Mollah and M. A. B. H. Susan, J. Solution Chem., 2013, 42, 1488–1499 CrossRef CAS.
- D. Eisenberg and W. Kauzmann, The Structure and Properties of Water, Oxford University Press, Oxford, 1969 Search PubMed.
- G. W. Robinson, Water in Biology, Chemistry, and Physics: Experimental Overviews and Computational Methodologies, World Scientific, 1996, vol. 9 Search PubMed.
- L. Arzuman, S. N. Karobi, M. J. Islam, G. Ara, M. M. Rahman, M. Y. A. Mollah and M. A. B. H. Susan, Synth. React. Inorg., Met.-Org., Nano-Met. Chem., 2014, 45, 764–769 CrossRef.
- J. D. Bernal and R. H. Fowler, J. Chem. Phys., 1933, 1, 515–548 CrossRef CAS.
- J. A. Pople, Proc. R. Soc. London, Ser. A, 1951, 205, 163–178 CAS.
- R. P. Marchi and H. Eyring, J. Phys. Chem., 1964, 68, 221–228 CrossRef CAS.
- M. Falk and T. A. Ford, Can. J. Chem., 1966, 44, 1699–1707 CrossRef CAS.
- Y. Marcus, Pure Appl. Chem., 2010, 82, 1889–1899 CAS.
- P. Ball and J. E. Hallsworth, Phys. Chem. Chem. Phys., 2015, 17, 8297–8305 RSC.
- R. Ludwig, Angew. Chem., Int. Ed., 2001, 40, 1808–1827 CrossRef CAS PubMed.
- N. J. English and J. S. Tse, Phys. Rev. Lett., 2011, 106, 1–4 CrossRef PubMed.
- M. Praprotnik, D. Janežič and J. Mavri, J. Phys. Chem. A, 2004, 108, 11056–11062 CrossRef CAS.
- M. A. González and J. L. F. Abascal, J. Chem. Phys., 2011, 135, 224516 CrossRef PubMed.
- N. N. Mafy, M. M. Rahman, M. Y. A. Mollah and M. A. B. H. Susan, ChemistrySelect, 2016, 1, 5789–5800 CrossRef.
- N. N. Mafy, M. Marium, M. M. Rahman, M. Y. A. Mollah and M. A. B. H. Susan, in Advances in Chemistry Research, ed. James C. Taylor, Nova Science Publishers, New York, 1st edn, 2015, ch. 2, vol. 28, pp. 91–117 Search PubMed.
- M. J. Shultz, T. H. Vu, B. Meyer and P. Bisson, Acc. Chem. Res., 2012, 45, 15–22 CrossRef CAS PubMed.
- F. Böhm, G. Schwaab and M. Havenith, Angew. Chem., Int. Ed., 2017, 56, 9981–9985 CrossRef PubMed.
- H. Vondracek, S. Imoto, L. Knake, G. Schwaab, D. Marx and M. Havenith, J. Phys. Chem. B, 2019, 123, 7748–7753 CrossRef CAS PubMed.
- G. Schwaab, F. Sebastiani and M. Havenith, Angew. Chem., Int. Ed., 2019, 58, 3000–3013 CrossRef CAS PubMed.
- H. Vondracek, S. Alfarano, C. Hoberg, I. Kolling, F. Novelli, F. Sebastiani, J. B. Brubach, P. Roy, G. Schwaab and M. Havenith, Biophys. Chem., 2019, 254, 106240 CrossRef CAS PubMed.
- F. Sebastiani, T. A. Bender, S. Pezzotti, W. L. Li, G. Schwaab, R. G. Bergman, K. N. Raymond, F. Dean Toste, T. Head-Gordon and M. Havenith, Proc. Natl. Acad. Sci. U. S. A., 2020, 117, 32954–32961 CrossRef CAS PubMed.
- F. Novelli, B. Guchhait and M. Havenith, Materials, 2020, 13, 1–15 CrossRef PubMed.
- F. Sebastiani, C. Y. Ma, S. Funke, A. Bäumer, D. Decka, C. Hoberg, A. Esser, H. Forbert, G. Schwaab, D. Marx and M. Havenith, Angew. Chem., Int. Ed., 2021, 60, 3768–3772 CrossRef CAS PubMed.
- C. Millon, J. Schmidt, S. Ramos, E. P. Van Dam, A. Buchmann, C. Saraceno and F. Novelli, AIP Adv., 2022, 12, 1–8 Search PubMed.
- M. Marium, A. Auni, M. M. Rahman, M. Y. A. Mollah and M. A. B. H. Susan, J. Mol. Liq., 2017, 225, 621–630 CrossRef CAS.
- K. Fuchs and U. Kaatze, J. Phys. Chem. B, 2001, 105, 2036–2042 CrossRef CAS.
- T. Arakawa, Y. Kita and J. F. Carpenter, Pharm. Res., 1991, 08, 285–291 CrossRef CAS PubMed.
- S. A. Galema, M. J. Blandamer and J. B. F. N. Engberts, J. Am. Chem. Soc., 1990, 112, 9665–9666 CrossRef CAS.
- S. A. Galema and H. Høiland, J. Phys. Chem., 1991, 95, 5321–5326 CrossRef CAS.
- R. K. Schmidt, M. Karplus and J. W. Brady, J. Am. Chem. Soc., 1996, 118, 541–546 CrossRef CAS.
- M. J. Tait, A. Suggett, F. Franks, S. Ablett and P. A. Quickenden, J. Solution Chem., 1972, 1, 131–151 CrossRef CAS.
- A. Suggett, S. Ablett and P. J. Lillfor, J. Solution Chem., 1976, 5, 17–31 CrossRef CAS.
- R. Giangiacomo, Food Chem., 2006, 96, 371–379 CrossRef CAS.
- P. A. Hassan, S. Rana and G. Verma, Langmuir, 2015, 31, 3–12 CrossRef CAS PubMed.
- G. González-Gaitano, P. Rodríguez, J. R. Isasi, M. Fuentes, G. Tardajos and M. Sánchez, J. Inclusion Phenom., 2002, 44, 101–105 CrossRef.
- N. Kumari and P. N. Pathak, J. Ind. Eng. Chem., 2014, 20, 1382–1387 CrossRef CAS.
- A. E. James and J. D. Driskell, Analyst, 2013, 138, 1212–1218 RSC.
- A. Atahar, N. N. Mafy, M. M. Rahman, M. Y. A. Mollah and M. A. B. H. Susan, J. Mol. Liq., 2019, 294, 111612 CrossRef CAS.
- C. S. Husdon and J. K. Dale, J. Am. Chem. Soc., 1916, 889, 320–328 Search PubMed.
- P. Atkins and J. D. Paula, Atkins' Physical Chemistry, Oxford University Press, 8th edn, 2006 Search PubMed.
- T. E. Kiovsky and R. E. Pincock, J. Am. Chem. Soc., 1966, 88, 4704–4710 CrossRef CAS.
- P. Giraudeau and L. Frydman, Annu. Rev. Anal. Chem., 2014, 7, 129–161 CrossRef CAS PubMed.
- G. Livingstone, F. Franks and L. J. Aspinall, J. Solution Chem., 1977, 6, 203–216 CrossRef CAS.
- I. Noda, Spectrochim. Acta, Part A, 2018, 197, 4–9 CrossRef CAS PubMed.
- A. Awichi, E. M. Tee, G. Srikanthan and W. Zhao, Appl. Spectrosc., 2002, 56, 897–901 CrossRef CAS.
- M. Shakeel and K. Mahmood, J. Chin. Chem. Soc., 2020, 67, 1552–1562 CrossRef CAS.
- S. Mondal, S. S. Dhondge, L. J. Paliwal, V. M. Tangde and S. P. Jengathe, J. Chem. Thermodyn., 2015, 90, 147–157 CrossRef CAS.
- T. Afrin, N. N. Mafy, M. M. Rahman, M. Y. A. Mollah and M. A. B. H. Susan, RSC Adv., 2014, 4, 50906–50913 RSC.
- H. Eyring, J. Chem. Phys., 1936, 4, 283–291 CrossRef CAS.
- C. D'Agostino, RSC Adv., 2017, 7, 51864–51869 RSC.
- T. C. Bai and G. B. Yan, Carbohydr. Res., 2003, 338, 2921–2927 CrossRef CAS PubMed.
- N. N. Mafy, T. Afrin, M. M. Rahman, M. Y. A. Mollah and M. A. B. H. Susan, RSC Adv., 2015, 5, 59263–59272 RSC.
- J. Catalán and J. A. Gonzalo, Chem. Phys. Lett., 2017, 679, 86–89 CrossRef.
- X. Cui, W. Cai and X. Shao, RSC Adv., 2016, 6, 105729–105736 RSC.
- G. W. Robinson, C. H. Cho and J. Urquidi, J. Chem. Phys., 1999, 111, 698–702 CrossRef CAS.
- C. L. Bell and G. M. Barrow, J. Chem. Phys., 1959, 31, 300 CrossRef CAS.
- P. C. McKinney and G. M. Barrow, J. Chem. Phys., 1959, 31, 294 CrossRef CAS.
- T. L. Haltom, E. T. Arakawa, M. W. Williams and E. Kretschmann, Appl. Opt., 1979, 18, 1233 CrossRef CAS PubMed.
- T. Pazderka and V. Kopecky Jr, Tech. Comput. Prague, 2008, 978–980 Search PubMed.
- J. L. Dashnau, K. A. Sharp and J. M. Vanderkooi, J. Phys. Chem. B, 2005, 109, 24152–24159 CrossRef CAS.
Footnote |
| † Electronic supplementary information (ESI) available: Change in free energy (ΔG) with the variation of temperature, change in entropy of activation for viscous flow (ΔS), change in enthalpy of activation for viscous flow (ΔH), DLS data, difference spectra of aqueous solutions of α-D-glucose at various concentrations, difference spectra of aqueous solutions of α-D-glucose and β-D-glucose at different temperatures, change of band positions of hydrogen-bonded components with temperature, time-dependent synchronous 2D NIR spectra of 2.5 M α-D-glucose and β-D-glucose, refractive indices of α-D-glucose and β-D-glucose solutions at different time intervals. See DOI: https://doi.org/10.1039/d3ra03081d |
| This journal is © The Royal Society of Chemistry 2023 |




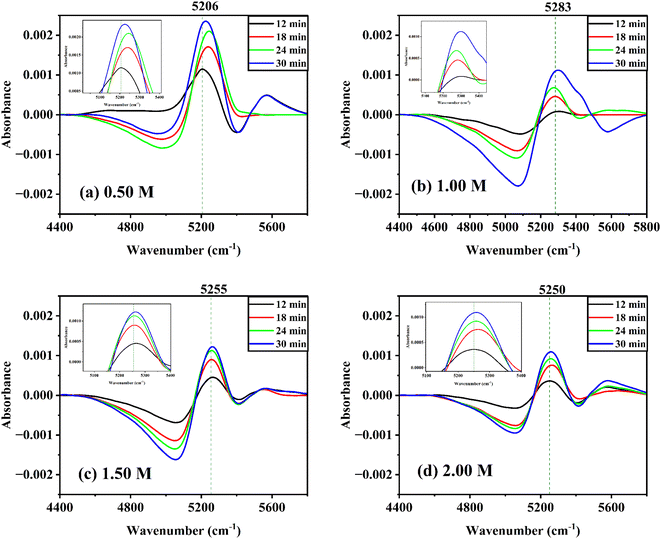
![[thin space (1/6-em)]](https://www.rsc.org/images/entities/char_2009.gif) 000 cm−1 to 5600 cm−1 for each plot.
000 cm−1 to 5600 cm−1 for each plot.