 Open Access Article
Creative Commons Attribution 3.0 Unported Licence
Molecular adsorption and self-diffusion of NO2, SO2, and their binary mixture in MIL-47(V) material†
Kompichit Seehamarta,
Wutthikrai Busayaporn b and
Rungroj Chanajaree
 *c
*c
aDepartment of Applied Physics, Faculty of Engineering, Rajamangala University of Technology Isan, Khon Kaen Campus, Khon Kaen 40000, Thailand
bSynchrotron Light Research Institute (Public Organization), Nakhon Ratchasima 30000, Thailand
cMetallurgy and Materials Science Research Institfute (MMRI), Chulalongkorn University, Bangkok 10330, Thailand. E-mail: Rungroj.Ch@chula.ac.th
First published on 23rd June 2023
Abstract
The loading dependence of self-diffusion coefficients (Ds) of NO2, SO2, and their equimolar binary mixture in MIL-47(V) have been investigated by using classical molecular dynamics (MD) simulations. The Ds of NO2 are found to be two orders of magnitude greater than SO2 at low loadings and temperatures, and its Ds decreases monotonically with loading. The Ds of SO2 exhibit two diffusion patterns, indicating the specific interaction between the gas molecules and the MIL-47(V) lattice. The maximum activation energy (Ea) in the pure component and in the mixture for SO2 are 16.43 and 18.35 kJ mol−1, and for NO2 are 2.69 and 1.89 kJ mol−1, respectively. It is shown that SO2 requires more amount of energy than NO2 to increase the diffusion rate. The radial distribution functions (RDFs) of gas–gas and gas–lattice indicate that the Oh of MIL-47(V) are preferential adsorption site for both NO2 and SO2 molecules. However, the presence of the hydrogen bonding (HB) interaction between the O of SO2 and the H of MIL-47(V) and also their binding angle (θ(OHC)) of 120° with the linkers of lattice indicate a stronger binding interaction between the SO2 and the MIL-47(V), but it does not occur with NO2. The jump-diffusion of SO2 between adsorption sites within the lattice has been confirmed by the 2D density distribution plots. Moreover, the extraordinarily high Sdiff for NO2/SO2 of 623.4 shows that NO2 can diffuse through the MIL-47(V) significantly faster than SO2, especially at low loading and temperature.
1 Introduction
According to the World Health Organization (WHO), one eighth of all worldwide deaths are caused by air pollution.1,2 Nitrogen dioxide (NO2) and sulfur dioxide (SO2) are two of the main air pollutants released during the combustion of fossil fuels such as coal and petroleum.3–5 SO2 and NO2 are constantly present in the atmosphere as a result of the increasing industrialization of several developing countries.6 These gases have a high solubility in water and are colorless, non-flammable, and corrosive. Excessive pollution gas emissions will lead to the formation of acid rain, which poses a serious hazard to human health in addition to having a negative influence on the ecosystem.7 Therefore, eliminating SO2 and NO2 from flue gas becomes important in preserving air quality.4,8 In case of SO2, flue gas desulfurization (FGD) technologies like limestone scrubbing successfully remove a significant portion of 95% of SO2 from flue gases, but residual SO2 still remains and can harm additional gas scrubbers.9–12 Due to the highly reactive and corrosive nature of SO2 and NO2, complete removal of SO2 and NO2 traces is difficult and requires a capture system with significant stability and higher selectivity of SO2 and NO2 than that of N2 and CO2.13–16 Designing new materials is important for removing traces of SO2 and NO2. In terms of process economy and energy efficiency, it could be a possibility.17–19 Metal organic frameworks (MOFs) have showed significant promise in a variety of applications, including drug delivery, substrate binding, and gas adsorption, storage, and separation.20–23 Molecular modeling contributions to predict the performance of MOFs play an important role in selecting materials for specific applications. The diffusion behavior of gases is essential in many of the applications proposed for MOFs. Without understanding of gas diffusion rates, the applications for MOFs such as catalysis, membranes, and sensors cannot be assessed. Furthermore, the majority of knowledge on gas diffusion in MOFs has come from molecular dynamics (MD) research.However, to the best of our knowledge, molecular simulations studies were mostly focused on carbon capture, and much less attention has been given to the removals of SO2 and NOx.4,24,25 MOF materials are a promising alternative for the capture of SO2 and NO2, especially because of their unique chemical functionality and pore sizes, which have shown great results for the capture assignment.26 However, the investigations of the adsorption of the strong reactivity molecules e.g. SO2 and NO2, including their mixture in MOFs have rarely been reported.5,27–29 Kampouraki et al.30 reported the removal of SO2 by using MOF materials. Their results indicate that the selectivity and adsorption ability are further enhanced after functionalization of the MOF surface. Sun et al.4 investigated the porous MOFs and zeolites for removal of SO2 and NOx from flue gases by grand canonical Monte Carlo (GCMC) simulations. They found that Cu-BTC and MIL-47 have high adsorption ability of SO2, hence they can be used for the removal of SO2 from flue gases. Peng et al.24 studied many kinds of porous materials. They discovered that the SO2 molecules have a very strong binding interaction with the Na-5A and the Na-13X zeolites which is difficult in SO2 desorption even at high temperature. While the MIL-47(V) and zeolite-like MOFs (zMOFs) materials are easier to regenerate at high temperature since it has a weaker interaction with SO2. López-Olvera et al.31 reported that the MIL-53(Al)-TDC and the MIL-53(Al)-BDC have excellent SO2 adsorption even under humid condition, and also have high chemical stability and easy to regenerate. However, the MIL-53(Al)-TDC which exhibits as a rigid-like lattice has higher SO2 adsorption than the MIL-53(Al)-BDC.
MIL-47(V) is one of MOF materials32,33 that was created by Gérard Férey's group.34 It is composed of V4+O6 octahedra linked by linear dicarboxylate ligands, providing a 3D framework with 1D diamond-shaped pores with a diameter of approximately 8.5 Å (see Fig. 1). The material has excellent water stability, a hydrophobic property, a large BET surface area of 930 m2 g−1, and a high thermal stability in air up to 400 °C.34–37 It also shows stability upon adsorption of different adsorbates,35,38–42 and its framework does not collapse even under high pressure.43
 | ||
| Fig. 1 (a) Labeled atom types for MIL-47(V) lattice, (b) MIL-47(V) lattice in xz plane and (c) in yz plane. | ||
The MIL-47(V) material which acts as a rigid-like lattice similar to the MIL-53(Al)-TDC, has an excellent SO2 adsorption and also reported to be an effective H2S adsorbent.41,44,45 Additionally, it has been brought to the market. However, the diffusion and separation of SO2 and NO2 in MIL-47(V) material have received limited theoretical and experimental research, despite the fact that numerous research have emphasized on the adsorption in this material.
Using MD simulations, this study has looked into the self-diffusivity of pure SO2, NO2, and their mixture in a MIL-47(V) lattice at different loadings and temperatures. Radial distribution functions (RDFs) and probability densities were used to analyze the detailed molecular adsorption in MIL-47(V). Our findings were discussed and compared with those from earlier studies.
2 Model and simulations
Classical Molecular Dynamics (MD) simulations were conducted to determine the adsorption and self-diffusion coefficient of SO2, NO2, and their equimolar (1![[thin space (1/6-em)]](https://www.rsc.org/images/entities/char_2009.gif) :
:![[thin space (1/6-em)]](https://www.rsc.org/images/entities/char_2009.gif) 1) mixture in MIL-47(V) material. The MIL-47(V) framework structure is provided from Cambridge Crystallographic Data Center (CCDC-166785).46 An orthorhombic unit cell (Pnma) of MIL-47(V) contains 72 lattice atoms (C32H16O20V4) with lattice parameter of a = 6.1879 Å, b = 16.1430 Å, and c = 13.9390 Å. The simulation box was extended to 32 (8 × 2 × 2) unit cells with dimensions of 54.5432 × 32.2860 × 27.8780 Å, comprise of 2304 lattice atoms (see Fig. 1).
1) mixture in MIL-47(V) material. The MIL-47(V) framework structure is provided from Cambridge Crystallographic Data Center (CCDC-166785).46 An orthorhombic unit cell (Pnma) of MIL-47(V) contains 72 lattice atoms (C32H16O20V4) with lattice parameter of a = 6.1879 Å, b = 16.1430 Å, and c = 13.9390 Å. The simulation box was extended to 32 (8 × 2 × 2) unit cells with dimensions of 54.5432 × 32.2860 × 27.8780 Å, comprise of 2304 lattice atoms (see Fig. 1).
For the SO2 and NO2 molecules, they were modeled by using the three-site Lennard-Jones model.4 The force field parameters for the MIL-47(V) framework were obtained from Xu et al.,47 which utilizes the DREIDING force field,48 except vanadium which utilized the UFF force field.49 The Lennard-Jones (LJ) parameters with partial charges which follow eqn (1), are summarized in Table 1.
 | (1) |
| σij = (σi + σj)/2 | (2) |
 | (3) |
| Molecules | Atom type | ε/kB (K) | σ (Å) | Charge (e) | Geometry (—) |
|---|---|---|---|---|---|
| MIL-47(V) | V | 8.056 | 2.801 | 0.861 | — |
| Oh | 48.161 | 3.033 | −0.475 | — | |
| Oc | 48.161 | 3.033 | −0.446 | — | |
| Co | 47.859 | 3.473 | 0.603 | — | |
| Ch | 47.859 | 3.473 | −0.015 | — | |
| Cc | 47.859 | 3.473 | −0.097 | — | |
| Hc | 7.649 | 2.846 | 0.112 | — | |
| SO2 | S | 145.900 | 3.620 | 0.471 | dS–O = 1.43 Å |
| O | 57.400 | 3.010 | −0.2355 | ∠OSO = 119.50° | |
| NO2 | N | 50.360 | 3.240 | 0.146 | dN–O = 1.20 Å |
| O | 62.510 | 2.930 | −0.073 | ∠OSO = 134.30° |
MD simulations of SO2, NO2, and SO2/NO2 mixture in the rigid framework of MIL-47(V) were performed under the NVT ensemble at 200, 250, 298, 350, and 400 K with the Nosé-Hoover thermostat.51 The periodic boundary condition (PBC) was applied and the shifted potential was truncated with a cutoff distance of 12 Å. The coulombic interactions were described by the Ewald summation with a precision of 10−5. The velocity Verlet algorithm was used, with a time step of 1 fs. The equilibration period of 1 ns (1![[thin space (1/6-em)]](https://www.rsc.org/images/entities/char_2009.gif) 000
000![[thin space (1/6-em)]](https://www.rsc.org/images/entities/char_2009.gif) 000 steps) and another 5 ns (5
000 steps) and another 5 ns (5![[thin space (1/6-em)]](https://www.rsc.org/images/entities/char_2009.gif) 000
000![[thin space (1/6-em)]](https://www.rsc.org/images/entities/char_2009.gif) 000 steps) for sampling density were performed. Then, the production runs were carried out for 15 ns (15
000 steps) for sampling density were performed. Then, the production runs were carried out for 15 ns (15![[thin space (1/6-em)]](https://www.rsc.org/images/entities/char_2009.gif) 000
000![[thin space (1/6-em)]](https://www.rsc.org/images/entities/char_2009.gif) 000 steps) with trajectory collection taking every 100 fs. The DL_POLY package52 has been applied for all simulations. The simulation boxes for SO2 and NO2 in the MIL-47(V) framework is shown in Fig. S1 in the ESI.†
000 steps) with trajectory collection taking every 100 fs. The DL_POLY package52 has been applied for all simulations. The simulation boxes for SO2 and NO2 in the MIL-47(V) framework is shown in Fig. S1 in the ESI.†
The self-diffusion coefficients (Ds) of SO2 and NO2 in pure component and in mixture within the one-dimensional channel of MIL-47(V)38,53,54 were computed from the linear fit to the mean-squared displacements (MSDs). It is written as Einstein's relation,55 see eqn (4).
 | (4) |
The diffusion selectivities (Sdiff)56 were defined as the ratio of the Ds of molecules from species A and B in a binary mixture (eqn (5)).
 | (5) |
The activation energies (Ea) for Ds of SO2 and NO2 were obtained from the linear slope of the Arrhenius equation which can be written as
 | (6) |
3 Results and discussion
3.1 Self-diffusion coefficients (Ds)
In this work, Ds of NO2 and SO2 for pure components and their mixture in MIL-47(V) material have been examined using conventional MD simulations as a function of loading at 200, 250, 298, 350, and 400 K. The MSDs in one-dimensional channel of MIL-47(V) were calculated from the center of mass of guest molecules over 5 ns, averaged by shifting the starting point of the evaluation over the first 10 ns of a 15 ns trajectory. The representative MSD plots' approaching linearity shows that the simulation's quality is reliable and that it yields Ds values (see Figs. S2 and S3†). The MSDs in different axes (i.e. x, y and z) that indicate the one-dimensional diffusion are illustrated in Fig. S5.† Fig. 2a and b illustrate how temperature and loading affect the Ds (i.e. D1D/3) values of NO2 and SO2 for both their pure components and their mixture, respectively. All Ds values are also summarized in Tables S1 and S2.†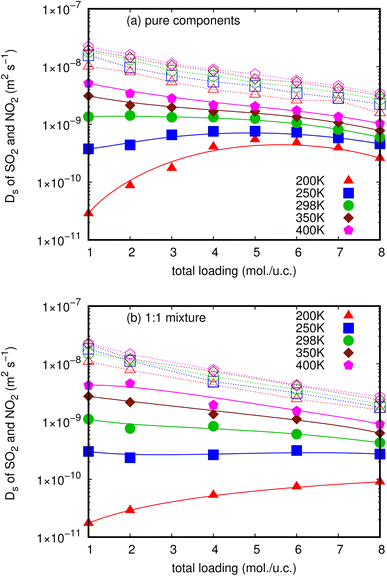 | ||
| Fig. 2 The loading dependence of Ds of SO2 (solid line) and NO2 (dashed line) in pure component (a) and in mixture (b) within the MIL-47(V) framework at different temperatures. | ||
These figures clearly indicate that NO2 molecules in MIL-47(V) have expectedly larger Ds values than SO2 molecules at all loadings and temperatures, as well as in both pure component and mixture. Since the pore diameters of MIL-47(V) (8.5 Å) are greater than the kinetic diameter of NO2 (3.3 Å), the diffusion of NO2 is governed by steric hindrance between diffusing molecules at higher loading, and the resulting Ds value decreases monotonically with loading (called type I self-diffusion).57 Several guest molecules in MIL-47(V) exhibited similar loading dependent diffusion behavior in both experimental and simulated studies.35,39,40,42,47 The Ds of NO2 increase only slightly as temperature increases. In addition, at low loading and temperature, the Ds of NO2 are approximately two orders of magnitude more than those of SO2, which has a kinetic diameter of 4.1 Å.
Nevertheless, Ds of SO2 are considerably sensitive to loading and temperature in MIL-47(V) than those of NO2, hence the MIL-47(V) material can probably be regenerated at high temperature. Ds of SO2 exhibit two types of self-diffusion behavior, particularly in pure components with loading varied from 1 to 8 mol per u.c. At temperatures over 298 K, its Ds decreases monotonically as loading increases due to steric hindrance (type I self-diffusion), similar to that of NO2. While, at temperatures equal to or less than 298 K, Ds increases as a function of loading from 1 to 4 mol per u.c., reaches a maximum at 5 mol per u.c., and subsequently decreases with increasing loading (type IV self-diffusion). The diffusing CO2 and SO2 molecules in ZIF-10,58 the CO2 molecules in other ZIFs,37 and the H2S molecules in MIL-47(V) from our previous work revealed similar loading dependent diffusion behavior.45
For the mixture in MIL-47(V) at 200 K, the Ds of SO2 increase as total loading increases from 1 to 8 mol per u.c., in which the amount of SO2 is 0.5–4 mol per u.c. (see Fig. 2b). This unexpected Type IV evolution of Ds is most often associated with preferential interactions between the host material and the diffusive species, and the maximum in Ds is determined by the number of adsorption sites. It is confirmed by the log-log plot of MSD that shows a sub-diffusion process of SO2 as shown in Fig. S4.† As a result, the first SO2 molecules will stick to stronger adsorption sites and diffuse more slowly than when other molecules are introduced. In addition, the loading dependence for diffusion behavior of SO2 molecules differs greatly from that of NO2 molecules, which might be attributed to differences in interactions between gas molecules and MIL-47(V). Moreover, the relationship between Ds and temperature can be described using an Arrhenius equation. The activation energy represents the energy barrier that particles need to overcome to diffuse, and it determines the sensitivity of diffusion to temperature changes. A higher activation energy implies a stronger temperature dependence of diffusion.
3.2 Activation energy (Ea)
Activation energy (Ea) is an important factor that influences gas diffusion. The activation energy is the least amount of energy required for gas molecules to diffuse from one site to another within the MOF framework, and it is a critical parameter in determining the diffusion rate of gas in the MOF. Ea is affected by the temperature, the size and shape of the MOF pores or channel, and that the gas molecules interact with the MOF framework. Fig. 3 shows the relationship between Ds at various loadings that vary with the inverse of temperature.The relationship between ln(Ds) and 1/T appeared to be linear for all loadings. The Ea of diffusion of SO2 and NO2 in MIL-47(V) for pure component and mixture is obtained by fitting ln(Ds) versus 1/T to the Arrhenius equation (eqn (6)), see Fig. S6 in the ESI† for pure component. The calculated Ea values is shown in Fig. 4. The Ea of SO2 in the mixture is greater than that in the pure component, and it decreases with increasing loadings for both the mixture and the pure component. For a total loading of 1 mol per u.c., the maximum Ea values of SO2 are 16.34 and 18.35 kJ mol−1 for the pure component and the mixture, respectively, suggesting that SO2 diffusion in the mixture is slower than that in the pure component. In case of pure component, as the loading varies from 1 to 4 mol per u.c., the Ea of SO2 decrease rapidly, and then become relatively constant when the loading exceeds 5 mol per u.c. This corresponds to Type IV diffusion behavior of SO2, as seen in Fig. 2. In the event of a mixture, the Ea values of SO2 remain significantly decreased since the loading of SO2 molecules in mixture only varies from 0.5–4 mol per u.c., in which the total loading varies between 1 and 8 mol per uc. It is seen that the activation energy of SO2 decreases with increasing loading, due to the repulsive interactions between diffusing molecules which are expected to reduce significantly in SO2–MIL-47(V) framework interactions. This increases the diffusion rate of SO2 molecules.
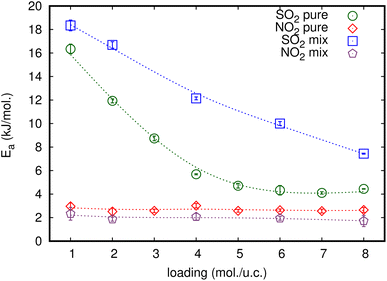 | ||
| Fig. 4 The loading dependence of Ea of SO2 and NO2 for pure and their mixture in the MIL-47(V) framework. | ||
On the other hand, the Ea of NO2 in pure component is unaffected by loading and that in mixture is slightly lower than in pure component. The averaged Ea values of NO2 for the pure component and the mixture are 2.69 and 1.89 kJ mol−1, respectively. The absence of considerable variability in the Ea of NO2 indicates the existence of uniform NO2–NO2 and NO2–MIL-47(V) interactions.
3.3 Adsorption properties
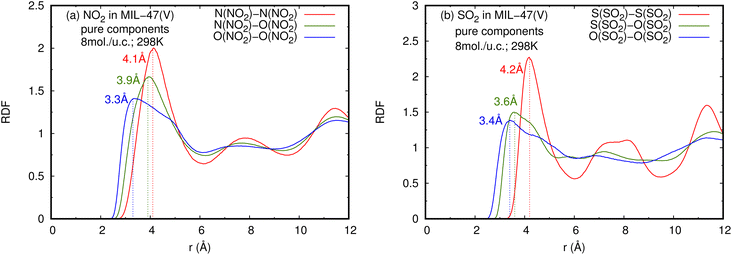 | ||
| Fig. 5 RDFS of (a) NO2–NO2 and (b) SO2–SO2 in pure component, at loading of 8 mol per u.c. and 298 K. | ||
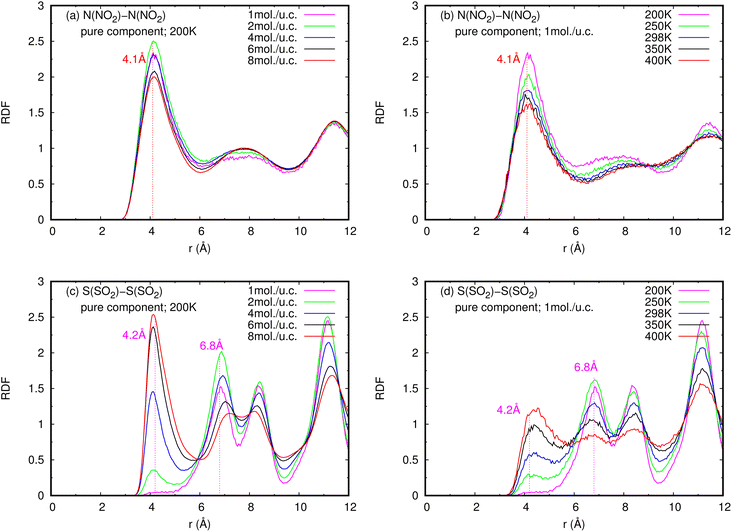 | ||
| Fig. 6 RDFS of (a), (b) NO2–NO2 and (c), (d) SO2–SO2 in pure component, at different loadings and temperatures. | ||
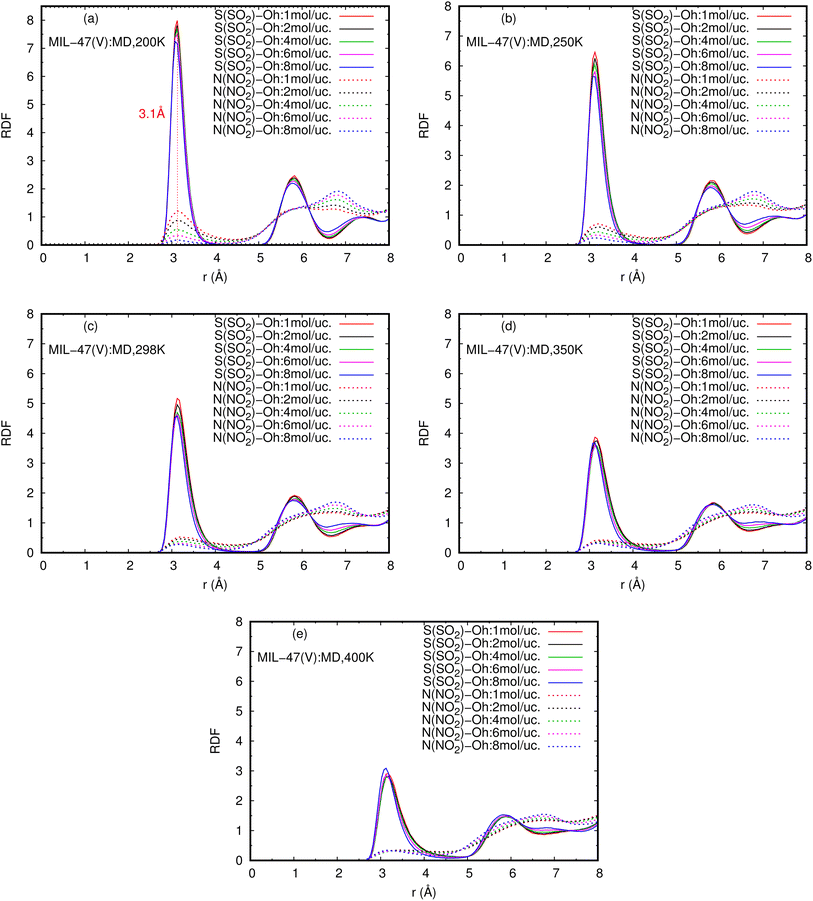
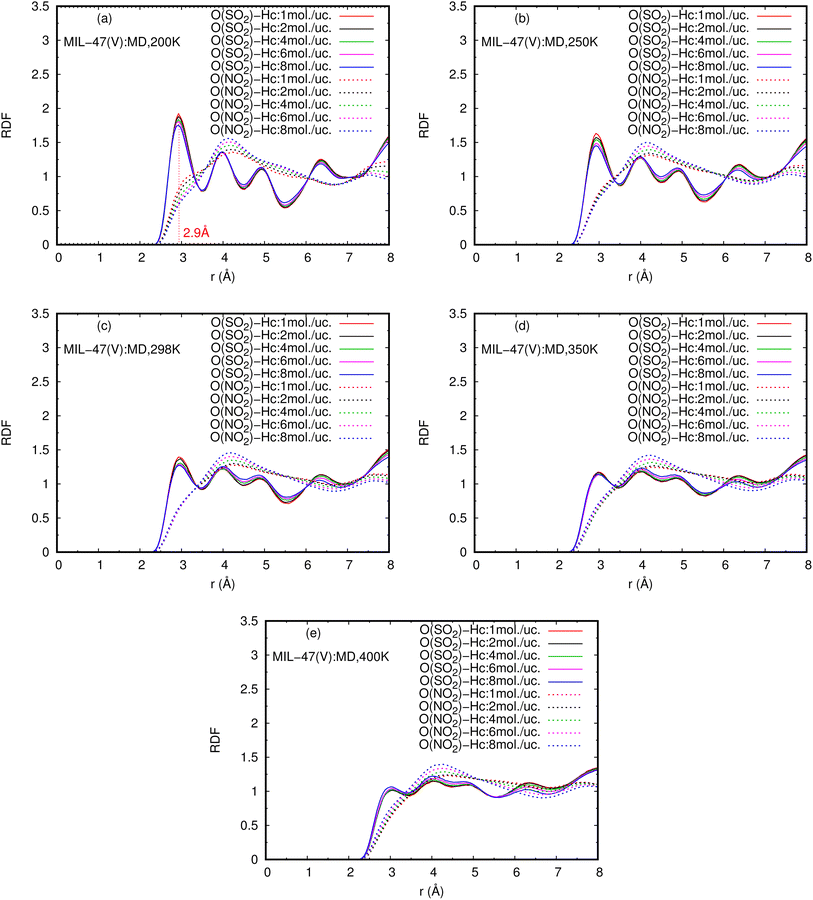
The RDFs can also provide evidence for the regional distribution of NO2 and SO2 molecules as well as their interactions with the MIL-47(V) framework. Therefore, in this study, RDFs were utilized to investigate the adsorption sites of NO2 and SO2 in the MIL-47(V). Fig. 7 shows the RDFs between atoms of NO2, SO2 and lattice atoms in the pure component, at the loading of 1 mol per u.c. The first N(NO2)–Oh and S(SO2)–Oh peaks are discovered at 3.1 Å, suggesting that Oh sites in the MIL-47(V) framework may be the preferential adsorption sites for NO2 and SO2. The peak intensities of SO2 are much higher than those of NO2, attributable to the stronger interaction of SO2 molecules with MIL-47(V) than that of NO2 molecules, which is consistent with the Ds mentioned above. Interestingly, the RDFs for the O(SO2)–Hc show the first peak at a distance of 2.9 Å with noticeable high intensity (see Fig. 7d), indicating a significant interaction between the O atom of SO2 molecules and the H atoms in the linkers of MIL-47(V), but this is not clearly seen in the RDFs for the O(NO2)–Hc (see Fig. 7b). Furthermore, this figure depicts that the interaction between SO2 and MIL-47(V) is really different from the interaction between NO2 and MIL-47(V).
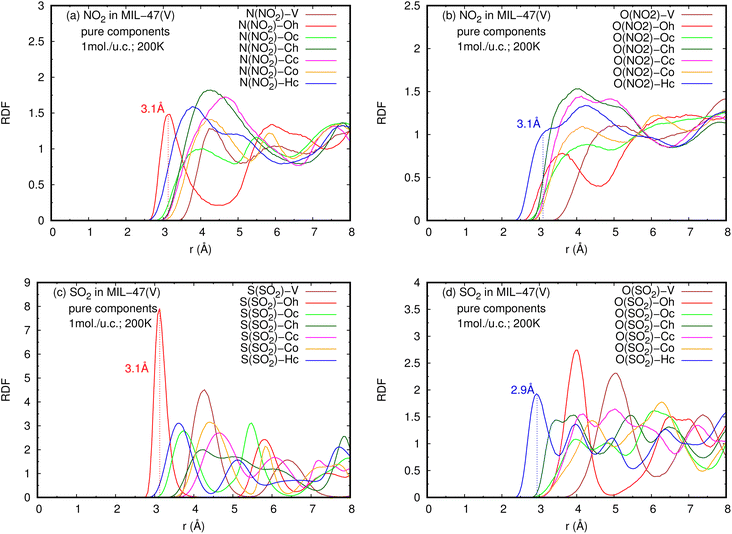 | ||
| Fig. 7 RDFS of (a), (b) NO2-lattice atoms and (c), (d) SO2-lattice atoms in pure component, at loading of 1 mol per u.c. and 200 K. | ||
Fig. 8 reports the RDFs of N(NO2)–Oh and S(SO2)–Oh in mixture, at various loadings and temperatures. The first peak of S(SO2)–Oh at 3.1 Å are noticeably more intense than those of NO2–Oh, showing that SO2 molecules are adsorbed at that Oh sites of MIL-47(V), while NO2 molecules are free to move around within the MIL-47(V) channel. This adsorption behavior is similar for both pure component and mixture (see Fig. S8 in ESI† for their RDFs in pure component).
Several experiments and simulations have recently suggested that the hydrogen bonding (HB) interaction between gas molecules (e.g. CO2, SO2, and H2O, etc.) and ZIFs (a subclass of MOFs) is crucial for determining the adsorption and diffusion behavior of gas molecules in MOFs.58 To the best of our knowledge, only a few number of research works have reported on the HB interaction of gas molecules in MILs.63 However, Fig. 7d shows clearly that SO2 can form HBs with the MIL-47(V) framework, that is, HBs between the O atoms of SO2 molecules and the H in the linker of MIL-47(V), but it is not the case for NO2.
Fig. 9 shows the RDFs of O(NO2)–Hc and O(SO2)–Hc in mixture, at different loadings and temperatures (see Fig. S9 in ESI† for their RDFs in pure component). The first peak of O(SO2)–Hc with a strong intensity is pronounced at 2.9 Å, especially at lower temperatures. This indicates the presence of HBs forming between SO2 molecules and MIL-47(V). However, the HB interaction decrease with increasing loading and temperature. While, it is not found for NO2 molecules.
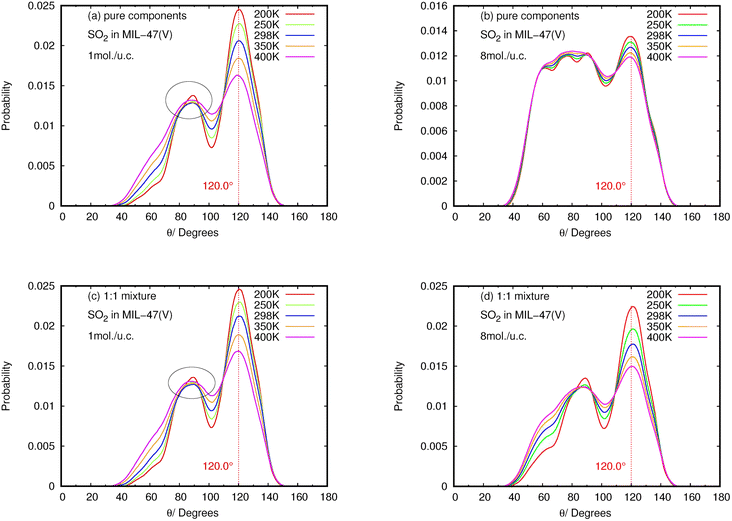
The results for NO2 and SO2 are presented in Fig. 10 and 11, respectively. In the case of SO2, the maximum value for the probability of θ(OHC) is 120.0°. This angle is clearly visible for both pure component and mixture, particularly at low loading and low temperature, which is well consistent with the strong interaction between SO2 and MIL-47(V). This suggests that 120.0° is the optimal HB binding angle for SO2 adsorbed in the MIL-47(V) channel. However, the probability of 120.0° decreases with increasing loading and temperature, indicating a weaker HB interaction. The probability of θ(OHC) in mixture is considerably higher than that in pure component, which may be related to the Ea and Ds values that were previously mentioned. In regard to CO2 and SO2 adsorption in ZIFs, the 120.0° angle of HBs was also discovered, and HB interaction is crucial for determining the adsorption and diffusion behavior of these gases in ZIFs.58,64,65
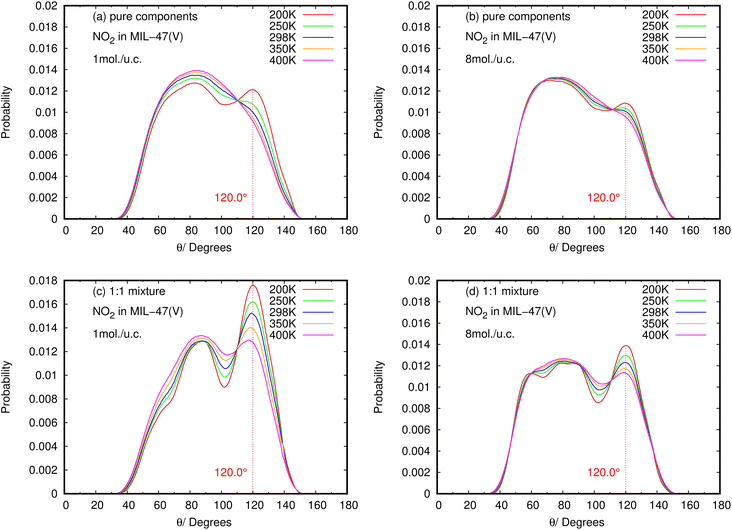 | ||
| Fig. 11 The angle distribution of O(NO2)–Hc–C in (a, b) pure component and (c, d) binary mixture, at different loadings and temperatures. | ||
Contrary to SO2, the maximum value for the probability of θ(OHC) is not 120.0° in the case of pure NO2 component under different loading and temperature conditions. This suggests that there was no possibility of an HB interaction between NO2 and MIL-47(V). However, the θ(OHC) probability of 120.0° for NO2 in the mixture becomes apparent at low loading, meaning that HB interaction between NO2 and MIL-47(V) may occur in this circumstance, but it is much less possible than SO2.
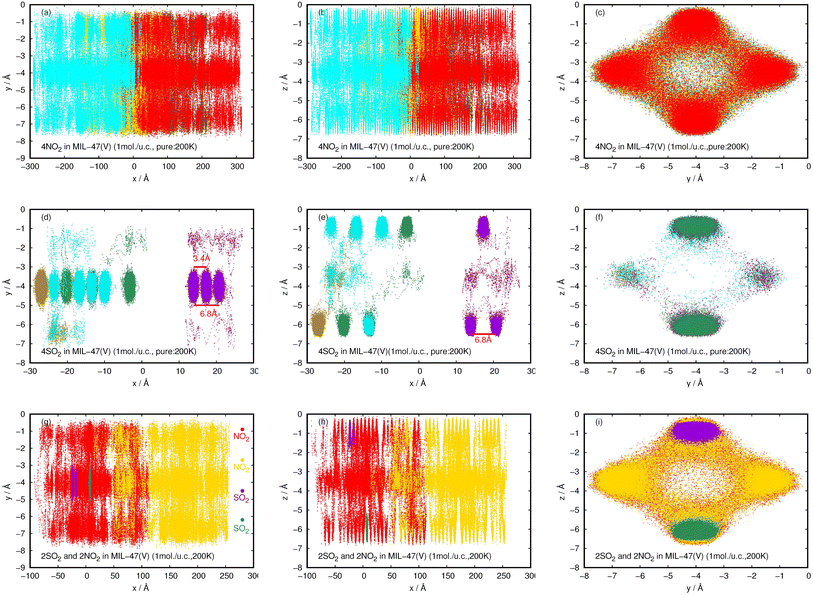 | ||
| Fig. 12 2D probability density plots of 4NO2 (a–c) and 4SO2 (d–f) for pure component, and, 2NO2 and 2SO2 for their mixture (g–i) in a MIL-47(V) channel at 200 K, displayed in yx, zx, and zy planes. | ||
In contrast to pure NO2, the pure SO2 molecules behave differently in MIL-47(V), as seen in Fig. 12d–f. This dynamics study shows that a specific SO2 molecule stays in the Oh sites within the MIL-47(V) channel before hopping to adjacent Oh sites at a distance of 6.8 Å, which corresponds to the RDFs of S(SO2)–S(SO2), or other Oh sites on the opposite site of the channel. Hence, it is possible to divide the diffusion process of SO2 in MIL-47(V) into two phases. The first phase is determined by the mobility of gas molecules around the Oh sites, and the second phase involves rapid jumping to other sites. It is seen that the diffusion behavior of each gas specie are similar in both pure component and mixture (see Fig. 12g–i). Furthermore, the SO2 molecules exhibit similar diffusion behavior as the H2S molecules in MIL-47(V) reported in45.
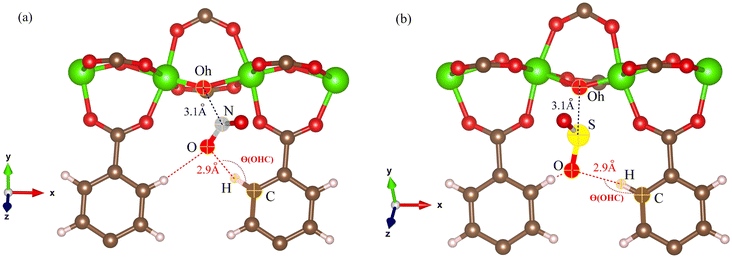
Fig. 13 shows the typical arrangement of a NO2 and SO2 molecule in a MIL-47(V) channel at 200 K and loading 1 mol per u.c., as well as the typical N–Oh and S–Oh distances, and θ(OHC) angle, which yield values consistent with those found in the RDFs discussed above. The snapshots show that NO2 and SO2 molecules are preferentially adsorbed at around the Oh sites of the framework. Simultaneously, both NO2 and SO2 molecules attempt to link their N or S atoms to the Oh atom, while their O atoms connect to the H atom in the framework's linker.
3.4 Diffusion selectivity (Sdiff)
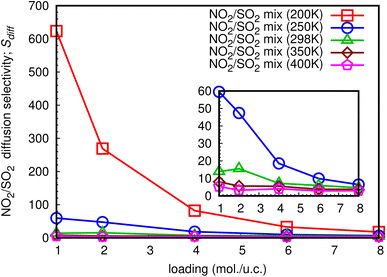
The diffusion selectivity of gases in MOFs depends on several factors, including the size of the gas molecules, the size and shape of the pores in the MOF, and the chemical interactions between the gas molecules and the MOF framework. Additionally, the ability to selectively transport gases through MOFs has many potential applications in areas, such as gas storage, separation, and purification, as well as in catalysis and sensing. In this work, diffusion selectivity for a NO2/SO2 binary mixture is defined as Sdiff = Ds,NO2/Ds,SO2, where Ds,NO2 is Ds of NO2, and Ds,SO2 is Ds of SO2. The loading dependence for Sdiff at different temperatures is shown in Fig. 14. For all studied temperatures, the Sdiff exhibits the same pattern, with the a maximum at low total loading of 1 mol per u.c. and decreasing as the loading increases. At total loading 1 mol per u.c. of 200 K, the extraordinarily high Sdiff of 623.4 is obtained, indicating that NO2 can diffuse through the MIL-47(V) lattice significantly faster than SO2 in their mixture, especially at low loading. The sub-figure shows that with a total loading of 1 mol per u.c. of 250 K, Sdiff is likewise high of 59.5 and follows the same trend as at 200 K. Furthermore, for temperatures equal to or greater than 298 K, it is not greatly impacted by temperature and loading, with maximum values of 15.5, 8.1, and 5.4 found for 298 K, 350 K, and 400 K, respectively.4 Conclusion
In this work, the classical MD simulations have been performed to investigate the Ds of pure NO2, SO2, and their equimolar binary mixture in the MIL-47(V) at different loadings and temperatures. Our MD simulations shows that NO2 molecules exhibit different diffusion behavior from SO2 in both pure component and binary mixture in MIL-47(V). The Ds of NO2 molecules in MIL-47(V) are approximately two orders of magnitude greater than those of SO2 at low loadings and temperatures, in the cases of both pure component and binary mixture. The diffusion of NO2 is affected by the steric hindrance between diffusion molecules at higher loading, where its Ds value decreases monotonically with loading indicating Type I self-diffusion. While, Ds of SO2 are more sensitive to loading and temperature than those of NO2 and show two types of diffusion mechanism. The SO2 molecules in MIL-47(V) exhibit type I self-diffusion at temperature higher than 298 K, showing that its Ds decreases with increasing loading, similar to NO2. At temperatures equal to or less than 298 K, the Ds of SO2 indicates Type IV self-diffusion, where its Ds increases with increasing loading, reaches a maximum and then decreases with increasing loading. Type IV self-diffusion is mostly due to the specific interactions between the lattice and the gas molecules, and the maximum in Ds is determined by the number of adsorption sites.The obtained Ea of SO2 in MIL-47(V) in mixture is larger than in pure component, indicates that SO2 molecules have slower diffusion in mixture than in pure component. The maximum Ea of SO2 are 16.43 and 18.35 kJ mol−1 for the pure component and the mixture, respectively. In case of NO2, their Ea in mixture are only slightly depend on the loading and also slightly lower than those in pure component. The averaged Ea value of NO2 for the pure component and the mixture are only 2.69 and 1.89 kJ mol−1, respectively. The RDFs of N(NO2)–Oh and S(SO2)–Oh suggested that Oh in MIL-47(V) could be the preferential adsorption sites for NO2 and SO2, where the peak intensities of SO2 are much higher than those of NO2, relating to their Ds. In addition, the higher intensity of S(SO2)–Oh displays that SO2 molecules are adsorbed at the Oh site, while NO2 can move freely within the lattice. The RDFs of O(SO2)–Hc with high intensity is found to indicate the HB between the O atoms of SO2 and the H atoms of the organic linkers of MIL-47(V), but it could not occur for NO2.
Furthermore, the calculated angle distributions of the O⋯H–C bond, so-called θ(OHC), show the optimal HB binding angle of 120° for SO2 adsorbed in the MIL-47(V) channel, and the probability of 120° is higher at low loading and temperatures. The probability of θ(OHC) for NO2 suggested that there is no HB interaction between NO2 and MIL-47(V) in pure component, nevertheless it may occur in mixture, but it is much less possible than SO2.
The probability densities illustrate that NO2 are freely distributed through the center of the channel along the x-axis, showing to the 1D diffusion. While, SO2 molecules are found the stay close to the Oh sites in the MIL-47(V) and it shows their jump diffusion between the Oh sites.
The Sdiff for a NO2/SO2 binary mixture exhibit the loading dependence at different temperature, where a maximum value is found at loading of 1 mol per u.c., and it decreases with increasing loading. Interestingly, the extraordinarily high Sdiff of 623.4 is detected at a total loading of 1 mol per u.c. and temperature of 200 K, meaning that NO2 can diffuse through the MIL-47(V) lattice significantly faster than SO2 in their mixture, especially at low loading. Finally, our simulations in this work provide a clear picture at molecular level of the adsorption and diffusion mechanism of NO2 and SO2 in the MIL-47(V) material. This is valuable information for developing new MOF materials for gas adsorption and separation.
Data availability
The authors confirm that the data supporting the findings of this study are available within the article and its ESI.†Conflicts of interest
There are no conflicts to declare.Acknowledgements
This research is funded by Thailand Science Research and Innovation Fund Chulalongkorn University (BCG66620031). Computational resources provided by Computational Sciences and Engineering Center (CSEc), SLRI, Thailand under Science, Research, and Innovation Fund (SRI Fund), 2021. Computing resources are also provided by Computational Chemistry Unit, MMRI, Chulalongkorn University, Thailand.References
- M. Savage, et al., Adv. Mater., 2016, 28, 8705 CrossRef CAS PubMed
.
- 7 million premature deaths annually linked to air pollution.
- S. Reis, et al., Science, 2012, 338, 1153 CrossRef CAS PubMed
.
- W. Sun, L.-C. Lin, X. Peng and B. Smit, AIChE J, 2014, 60, 2314 CrossRef CAS
.
- E. Martinez-Ahumada, M. Diaz-Ramírez, M. Velásquez-Hernández, V. Jancik and I. Ibarra, Chem. Sci., 2021, 12, 6772 RSC
.
- T. Larssen, et al., Environ. Sci. Technol., 2006, 40, 418 CrossRef CAS PubMed
.
- Air quality guidelines for particulate matter, ozone, nitrogen dioxide and sulfur dioxide.
- S. Xing, et al., Angew. Chem., Int. Ed., 2021, 60, 17998 CrossRef CAS PubMed
.
- T. Islamoglu, et al., Chem. Rev., 2020, 120, 8130 CrossRef CAS PubMed
.
- E. Martínez-Ahumada, et al., Organometallics, 2020, 39, 883 CrossRef
.
- Y. Liu, T. Bisson, H. Yang and Z. Xu, Fuel Process. Technol., 2010, 91, 1175 CrossRef CAS
.
- M. Hanif, N. Ibrahim and A. Jalil, Environ. Sci. Pollut. Res., 2020, 27, 27515 CrossRef CAS PubMed
.
- I. Matito-Martos, et al., Phys. Chem. Chem. Phys., 2014, 16, 19884 RSC
.
- J. Yu, Y. Ma and P. Balbuena, Langmuir, 2012, 28, 8064 CrossRef CAS PubMed
.
- D. D'Alessandro, B. Smit and J. Long, Angew. Chem., Int. Ed., 2010, 49, 6058 CrossRef PubMed
.
- L. Ding and A. Yazaydin, J. Phys. Chem. C, 2012, 116, 22987 CrossRef CAS
.
- C. Li, D. Lu and C. Wu, Phys. Chem. Chem. Phys., 2018, 20, 16704 RSC
.
- A. Wang, et al., ACS Appl. Mater. Interfaces, 2018, 10, 37407 CrossRef CAS PubMed
.
- P. Brandt, et al., Adv. Sustainable Syst., 2021, 5, 2000285 CrossRef CAS
.
- J.-R. Li, J. Sculley and H.-C. Zhou, Chem. Rev., 2012, 112, 869 CrossRef CAS PubMed
.
- E. Barea, C. Montoro and J. Navarro, Chem. Soc. Rev., 2014, 43, 5419 RSC
.
- M. Suh, H. Park, T. Prasad and D.-W. Lim, Chem. Rev., 2012, 112, 782 CrossRef CAS PubMed
.
- J. Zhuang, et al., ACS Nano, 2014, 8, 2812 CrossRef CAS PubMed
.
- X. Peng and D. Can, AlChE J., 2013, 59, 2928 CrossRef CAS
.
- R. Krishna and J. M. van Baten, Phys. Chem. Chem. Phys., 2011, 13, 10593 RSC
.
- X. Han, S. Yang and M. Schröder, Nat. Rev. Chem., 2019, 3, 108 CrossRef CAS
.
- S. Yang, et al., J. Am. Chem. Soc., 2013, 135, 4954 CrossRef CAS PubMed
.
- X. Han, et al., Nat. Mater., 2018, 17, 691 CrossRef CAS PubMed
.
- P. Thallapally, R. Motkuri, C. Fernandez, B. McGrail and G. Behrooz, Inorg. Chem., 2010, 49, 4909 CrossRef CAS PubMed
.
- Z.-C. Kampouraki, et al., Molecules, 2019, 24, 4525 CrossRef CAS PubMed
.
- A. López-Olvera, et al., ACS Appl. Mater. Interfaces, 2021, 13, 39363 CrossRef PubMed
.
- C. Serre, et al., Adv. Mater., 2007, 19, 2246 CrossRef CAS
, Cited By: 437..
- G. Férey, et al., Chem. Soc. Rev., 2011, 40, 550 RSC
.
- K. Barthelet, J. Marrot, D. Riou and G. Ferey, Angew. Chem., Int. Ed., 2002, 41, 281 CrossRef CAS PubMed
.
- F. Salles, et al., Am. Chem. Soc., 2010, 4, 143 CAS
.
- S. Biswas, et al., Microporous Mesoporous Mater., 2013, 181, 175 CrossRef CAS
.
- S. Biswas, et al., J. Phys. Chem. C, 2013, 117, 22784 CrossRef CAS
.
- D. Kolokolov, et al., J. Phys. Chem. C, 2012, 116, 15093 CrossRef CAS
.
- S. Rives, et al., Microporous Mesoporous Mater., 2012, 164, 259 CrossRef CAS
.
- S. Rives, et al., J. Phys. Chem. C, 2013, 117, 6293 CrossRef CAS
.
- L. Hamon, et al., J. Am. Chem. Soc., 2009, 131, 3640 Search PubMed
.
- S. Rives, et al., J. Phys. Soc. Jpn., 2013, 82, SA005 CrossRef
.
- P. Yot, et al., Chem. Sci., 2012, 3, 1100 RSC
.
- L. Hamon, et al., J. Phys. Chem. C, 2011, 115, 2047 CrossRef CAS
.
- R. Chanajaree, W. Sailuam and K. Seehamart, Microporous Mesoporous Mater., 2022, 335, 111783 CrossRef CAS
.
- The Cambridge Crystallographic Data Centre (CCDC).
- J. Xu, et al., J. Mater. Sci., 2016, 51, 2307 CrossRef CAS
.
- S. L. Mayo, B. D. Olafson and W. A. Goddard, J. Phys. Chem., 1990, 94, 8897 CrossRef CAS
.
- A. K. Rappe, C. J. Casewit, K. S. Colwell, W. A. Goddard and W. M. Skiff, J. Am. Chem. Soc., 1992, 114, 10024 CrossRef CAS
.
- J. Delhommelle and P. Millié, Mol. Phys., 2001, 99, 619 CrossRef CAS
.
- W. Hoover and B. Holian, Phys. Lett. A, 1996, 211, 253 CrossRef CAS
.
- W. Smith, T. Forester, I. Todorov, and M. Leslie, The DL_Poly_2 User Manual, CCLRC Daresbury Laboratory, UK, 2006 Search PubMed
.
- A. Ghoufi and G. Maurin, J. Phys. Chem. C, 2019, 123, 17360 CrossRef CAS
.
- J. Wieme, L. Vanduyfhuys, S. Rogge, M. Waroquier and V. V. Speybroeck, J. Phys. Chem. C, 2016, 120, 14934 CrossRef CAS PubMed
.
- D. Frenkel and B. Smit, Understanding Molecular Simulation, Academic Press, San Diego, London, Boston, New York, Sidney, Tokyo, Toronto, 2002 Search PubMed
.
- R. Krishna and J. van Baten, Chem. Eng. J., 2007, 133, 121 CrossRef CAS
.
- J. Kärger and H. Pfeifer, Zeolites, 1987, 7, 90 CrossRef
.
- L. Li, et al., Langmuir, 2017, 33, 11543 CrossRef CAS PubMed
.
- Y. Sabahi, M. Razmkhah and F. Moosavi, Results Chem., 2022, 4, 100283 CrossRef CAS
.
- T. Yamagushi, O. Lindqvist and U. Dahlborg, Acta Chem. Scand., Ser. A, 1984, 38, 757 CrossRef
.
- G. Kamath, M. Ketko, G. Baker and J. Potoff, J. Chem. Phys., 2012, 136, 044514 CrossRef PubMed
.
- T. Katō, J. Chem. Phys., 2003, 120, 829 CrossRef PubMed
.
- Y. Ye, et al., J. Am. Chem. Soc., 2022, 144, 1681 CrossRef CAS PubMed
.
- I. Ahmed, M. Tong, J. Jun, C. Zhong and S. Jhung, J. Phys. Chem. C, 2016, 120, 407 CrossRef CAS
.
- I. Ahmed and S. Jhung, Chem. Eng. J., 2017, 310, 197 CrossRef CAS
.
- F. Salles, et al., J. Phys. Chem. C, 2009, 113, 7802 CrossRef CAS
.
- N. Jr. Rosenbach, et al., Angew. Chem., Int. Ed., 2008, 47, 6611 CrossRef CAS PubMed
.
Footnote |
| † Electronic supplementary information (ESI) available. See DOI: https://doi.org/10.1039/d3ra02724d |
| This journal is © The Royal Society of Chemistry 2023 |


