 Open Access Article
Creative Commons Attribution 3.0 Unported Licence
Cost-effective core@shell structured zero-valent iron nanoparticles @ magnetic (nZVI@Fe3O4) for Cr(VI) removal from aqueous solutions: preparation by disproportionation of Fe(II)†
Chuan He ab,
Yarong Dinga,
Canhua Li*ad,
Wang Yanb,
Aiqin Mao
 c,
Shuxian Weia and
Minghui Lia
aCollege of Metallurgical Engineering, Anhui University of Technology, Ma'anshan 243000, China. E-mail: licanhua1979@163.com
bJiuquan Vocational and Technical College, Jiuquan 735000, China
cSchool of Materials Science and Engineering, Anhui University of Technology, Ma'anshan, 243000, China
dXuancheng Industrial Technology Research Institute, Anhui University of Technology, Xuancheng, 242002, China
First published on 8th September 2023
Abstract
Nanoscale zero-valent iron (nZVI) and its composites are known for their excellent ability to remove Cr(VI), but their preparation can be expensive due to the reduction processes. This study presents a cost-effective method to prepare core@shell structured nZVI@Fe3O4 nanocomposites using a novel Fe(II) disproportionation reaction. The nZVI@Fe3O4 was thoroughly characterized using various techniques, including FESEM, HRTEM, EDS, XPS, XRD, FTIR, and VSM. Batch experiments were performed to evaluate the removal efficiency of nZVI@Fe3O4 in eliminating Cr(VI) ions from aqueous solutions, while classical models were employed to investigate the influencing factors associated with the removal process. The results showed that a 0.7 mg per ml NaOH solution reacted with Fe(II) at 150 °C for 0.5 h could be used to prepare nZVI@Fe3O4 composites efficiently and inexpensively. nZVI@Fe3O4 was able to remove more than 99% of Cr(VI) from both simulated Cr(VI) solutions and real electroplating wastewater, and the recovery and preparation could be easily performed using external magnets to separate it from the solution. At pH 6.0, the maximum adsorption capacity (qmax) for Cr(VI) reached 58.67 mg g−1. The reaction mechanism was discussed from the perspective of electron transfer. Overall, the results suggest that nZVI@Fe3O4, an efficient adsorbent prepared using an environmentally friendly and inexpensive Fe(II) disproportionation reaction, is a promising option for the treatment of Cr(VI) from industrial wastewater and other contaminated water sources.
1. Introduction
Pollution is a major global environmental issue that leads to illness and premature death.1 One of the most dangerous contaminants found in polluted sites is chromium, which frequently appears in both trivalent (Cr(III)) and hexavalent (Cr(VI)) forms.2 While Cr(VI) is primarily caused by human activities, such as industrial manufacturing and metallurgy, Cr(III) is often insoluble in aqueous solutions and soil.3 The soluble forms of Cr(VI), which have a high mobility in nature, are particularly harmful to human health, causing respiratory and eye irritation, dermatitis, gastrointestinal damage, and even cancers like lung and kidney cancer.4,5Adsorption is recognized as an effective and cost-effective approach for treating heavy metals such as Cr(VI), and it involves using substances like low-valent iron (Fe(0) and/or Fe(II)) to act as a trapping and reducing agent.6 These substances have been shown to excel at capturing Cr(VI) in groundwater, industrial wastewater, and soil. Once captured, Cr(VI) is converted to Cr(III) and rendered immobile by reacting with Fe to form insoluble compounds, which is environmentally safe.7,8 Nano-magnetite (nFe3O4) and nano zero-valent iron (nZVI) are two common substances that possess magnetic properties and are frequently utilized for adsorption purposes. The magnetic properties of these substances are a critical factor in their selection as nFe3O4 and nZVI can be easily separated by magnetic separation, which is often more economical and convenient compared to complex membrane filtration.9 Among these substances, nZVI has a higher reduction potential and is widely used for soil and groundwater remediation in Europe and the United States.10 However, there are two significant challenges in using nZVI for adsorption. Firstly, acquiring nZVI involves costly and complex “top-down” or “bottom-up” processes that may lead to secondary contamination.11,12 Secondly, nZVI particles tend to rapidly agglomerate into larger particles due to interparticle interactions, and surface passivation due to high oxidation environments can result in a decrease in reactivity.13 These challenges can reduce the effectiveness of nZVI in adsorption, and researchers are working to address these issues to improve the use of nZVI for heavy metal treatment.
Many methods have been developed to modify and stabilize nZVI in order to maximize its activity and utilization. These methods include carbon-supported,13 phosphorylation,14 sulfidation,15 bimetallization,16 encapsulation.17 In recent years, the formation of composites with nFe3O4 has received significant attention due to the capability of nZVI to transfer electrons to the surface of Fe3O4, which can regenerate Fe(III) to Fe(II) and improve electron transfer.18–23 However, most of these methods involve a two-step process starting with the preparation of nFe3O4 using co-precipitation, nZVI is typically ready by reducing Fe(II) to Fe(0) using NaBH4 or high-temperature reduction with C and H2.24,25 Some studies have used the disproportionation reaction of Fe(II) to prepare Fe@Fe3O4 composites, but these typically involve complicated precursors like calcite (FeO) and have not been widely used for contaminant removal applications.26,27
In this study, we used a very inexpensive and simple procedure to get rid of the expensive and complicated reduction process. nZVI@Fe3O4 was synthesized through a one-step process, using ferrous chloride precursors and allowing Fe(II) disproportionation to occur in hot concentrated lye. The NaOH concentration and reaction time of the process were investigated. The fine features and physical/chemical properties of the products were studied by performing FESEM, HRTEM, EDS, XRD, XPS, BET, VSM, FTIR characterization. Following that, the removal efficiency was evaluated under varying initial pH levels. Kinetics, thermodynamics, and adsorption isotherms were analyzed by studying the effect of different initial Cr(VI) concentrations, dosing levels, and temperature on removal efficiency. These analyses helped to elucidate the removal process, the capacity of removal, and the spontaneity of the reaction. Furthermore, the capability of nZVI@Fe3O4 to treat real electroplating wastewater was examined. Finally, based on the identification of the reaction products and the assessment of the adsorption behavior, possible reaction mechanisms were further suggested. The outcomes of this study could potentially broaden the range of applications for nZVI and Fe3O4 composites, particularly in the treatment of Cr(VI)-containing wastewater.
2. Materials and methods
2.1. Materials
Ferrous chloride tetrahydrate (FeCl2·4H2O), potassium dichromate (K2Cr2O7), sodium hydroxide (NaOH), and all the other chemical agent were purchased from the Sinopharm Group Chemical Reagent Co., Ltd, China. In all experiments, deionized water was utilized, and the water used to prepare the adsorbent was deoxygenated by charging it with N2 gas for 0.5 h. The real plating wastewater is taken from a chrome metal plating line in the Fanchang Plating Center in Wuhu, China.2.2. Preparation of nZVI@Fe3O4
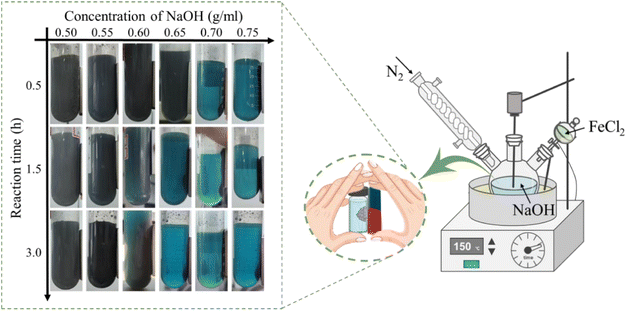
The synthesis of the material was performed in a multi-necked flask which was in an oil bath, the temperature was programmed to 150 °C and the oxygen-free environment was strictly controlled. Briefly, 200 ml of NaOH solutions with various concentrations (0.5, 0.55, 0.6, 0.65, 0.7, 0.75 g ml−1) were made, and when the temperature of the NaOH solution increased to 145 °C, the prepared FeCl2 solution (In 20 ml of deionized water, FeCl2·4H2O dissolved with a mass of 9.941 g) was added dropwise to the high temperature NaOH solution, the reaction times were set to 0.5, 1.5, and 3 h, respectively, and a gradual change of the solution from grey to black could be observed. Once the reaction was completed, the products were promptly separated using magnets and rinsed multiple times with oxygen-free water, dried under vacuum and then used.2.3. Analysis methods
The detail of analytical methods are shown in ESI.†2.4. Adsorbent characterization
To prepare a stock solution of Cr(VI), 2.829 g of K2Cr2O7 was dissolved in water and then diluted to 1 L, resulting in a 1 g L−1 solution of Cr(VI), and the simulated wastewater with varying concentrations of Cr(VI) was prepared by diluting the stock solution. Batch experiments were conducted in open flasks at 25 °C by dispensing a certain concentration of Cr(VI) (500 ml per flask), adjusting the pH range using 0.1 M HCl or NaOH, and then adding a predetermined amount of nZVI@Fe3O4 to each flask, which was mixed immediately by shaker. At regular intervals, 5 mL aliquots of the solution were extracted and the particles were filtered out using a 0.45 μm membrane for measuring the solution concentration. To ensure effectiveness and accuracy of the results, all experiments were performed in triplicate, with consistently reproducible outcomes. The reported data represents the average values of three replicated experiments, with error bars indicating the standard deviation of the averages. The removal efficiency (RE%) of Cr(VI) was calculated using the following eqn (1):
 | (1) |
 | (2) |
3. Results and discussion
3.1. Material synthesis
We investigated the impact of varying NaOH solution concentrations and reaction times on the formation of this material, and the state of the product could be judged using a magnet, as shown in Fig. 1. It was observed that a small amount of black magnetic material was produced when the NaOH concentration reached 0.5 mg ml−1. After further increasing the concentration to 0.6 mg ml−1 and prolonging the reaction time to 3 h, it was observed that most of the precipitation could be attracted to one side of the sample flask by the magnet, more magnetic phases were generated in the reaction system. In order to reduce energy and raw material consumption, subsequent characterization and experiments were conducted using a 0.7 mg per ml NaOH solution with 0.5 h reaction, which was sufficient for complete disproportionation of all the precipitates.Before determining the concentration of NaOH in the Fig. 1, we conducted experiments with low concentrations of NaOH, but unfortunately, no disproportionation reaction occurred and the product was a gray-green ferrous hydroxide precipitate. However, under the conditions of high concentration of OH−, the boiling point of the solution will be increased (the temperature of the reaction system was measured to be 147 °C), and when Fe(II) is added dropwise, Fe(OH)2 is produced under oxygen-free conditions (eqn (3)), but Fe(OH)2 itself is unstable and is converted to FeO under the high temperature of a strong base (eqn (4)). At low temperatures (compared to higher temperatures), FeO is an unstable phase and spontaneously disproportionates, and then Fe3O4 and iron monomers are produced in a 1![[thin space (1/6-em)]](https://www.rsc.org/images/entities/char_2009.gif) :
:![[thin space (1/6-em)]](https://www.rsc.org/images/entities/char_2009.gif) 1 molar ratio (eqn (5)).28
1 molar ratio (eqn (5)).28
| Fe2+ + 2OH− → Fe(OH)2 | (3) |
| Fe(OH)2 → FeO + H2O | (4) |
| 4FeO → Fe + Fe3O4 | (5) |
3.2. Characterization of nZVI@Fe3O4
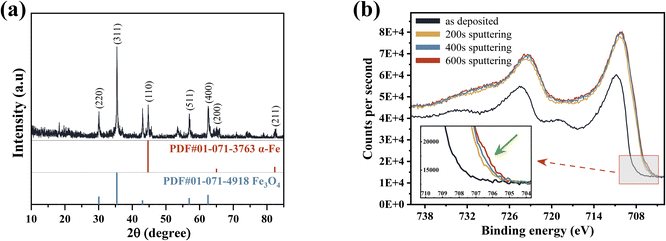 | ||
| Fig. 2 (a) XRD pattern and (b) Fe 2p high-resolution XPS spectra of nZVI@Fe3O4 before and after Ar+ sputtering. | ||
The average crystalline size of α-Fe microcrystals calculated using Scherrer's formula described in the ESI† is 49 nm, which is similar to the already reported size of α-Fe microcrystals prepared by FeO disproportionation decomposition (53 nm).27
Meanwhile, the calculated average size of Fe3O4 microcrystals is 40 nm. It is worth mentioning that the sharp and narrow XRD diffraction peaks of α-Fe confirms the good crystallinity, unlike the nZVI prepared by liquid-phase reduction, whose cores often contain iron with poor crystallinity.18 As per prior studies, good crystallinity can enable the formation of effective electronic networks, which have the potential to improve conductive behavior when dealing with heavy metal ions and enhance material reactivity upon adsorption.29,30
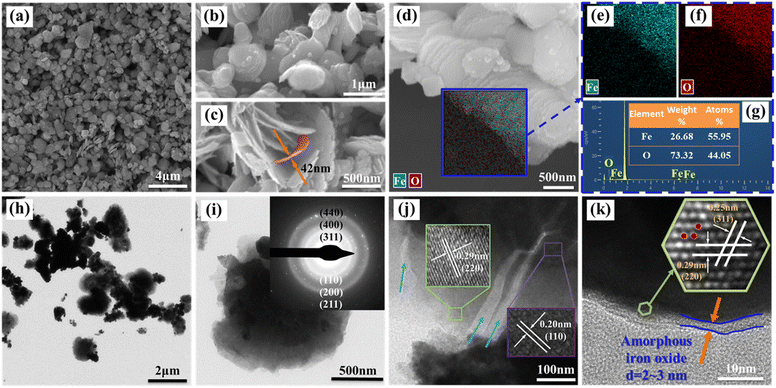
XPS analysis gives a more detailed chemical characterization of the as-synthesized sample. Fig. 2(b) shows that the spin–orbit splitting Fe 2p peaks are observed at 706.8 and 723.5 eV In the pristine nZVI@Fe3O4, and these signals consist of photoelectrons from Fe(III), Fe(II) and Fe(0), respectively.31 The presence of Fe(0) is responsible for the peak observed at 706.8 eV, and after Ar+ sputtering, an increase in the signal of Fe(0) can be observed (green arrow inset in Fig. 2(b)), but the increase is very weak, indicating that α-Fe is not dispersed and precipitated in the matrix of Fe3O4, which is consistent with the result of nZVI@Fe3O4 nanocomposites prepared by FeO decomposition.27 Therefore, the nZVI@Fe3O4 may have a core@shell structure, where Fe(0) is located at the core position, resulting in the failure of the Fe(0) photoelectron to escape. The HRTEM and the slower removal rates of the subsequent batch tests likewise confirm this.
![[thin space (1/6-em)]](https://www.rsc.org/images/entities/char_2009.gif) :
:![[thin space (1/6-em)]](https://www.rsc.org/images/entities/char_2009.gif) O is 55.95
O is 55.95![[thin space (1/6-em)]](https://www.rsc.org/images/entities/char_2009.gif) :
:![[thin space (1/6-em)]](https://www.rsc.org/images/entities/char_2009.gif) 44.05. In addition, the EDS elemental mappings shown in Fig. 3(e) and (f) demonstrate a uniform distribution of Fe and O elements across the surface of the particles.
44.05. In addition, the EDS elemental mappings shown in Fig. 3(e) and (f) demonstrate a uniform distribution of Fe and O elements across the surface of the particles.
The TEM/HRTEM were used to characterize the fine features of the nanosheets contained in the as-synthesized particle. Fig. 3(h) and (i) displays the a TEM images of the nanosheets, and the nanosheets have a darker central part (core) and a lighter outer part (shell), which is also confirm the core–shell structure of as-synthesized nZVI@Fe3O4 nanocomposites. Furthermore, the SAED pattern as inset in Fig. 3(i) shows several diffraction rings from inside to outside, which index to the crystallographic diffraction of (311), (400), and (440) of Fe3O4, as well as α-Fe (110), (200), and (211).34 In addition, the HRTEM image in Fig. 3(j) reveals a high degree of crystallinity of as-synthesized nanosheet, and the core has a calculated lattice spacing of 0.20 nm corresponding to the (110) plane of body-centered cubic α-Fe, while the shell has a observed lattice spacing of 0.29 nm, consistent with the (220) crystal plane of Fe3O4. Fe3O4 possesses an inverse spinel structure that can host Fe(II) and Fe(III) in octahedral sites and enables efficient electron transfer between them. As a result, Fe3O4 is a highly conductive semiconductor and is expected to function as a catalytic surface when deposited onto Fe(0).30 And the large number of fissures and defects between the nanosheets are beneficial for adsorbing heavy metal ions. Moreover, as seen in Fig. 3(k), the edges of the nanosheet display translucent amorphous nano-sized structures with thicknesses between 2 and 3 nm. The extremely thin size of Fe3O4 layers with disordered and defective nature also provide effective adsorbing sites for heavy metal ions.
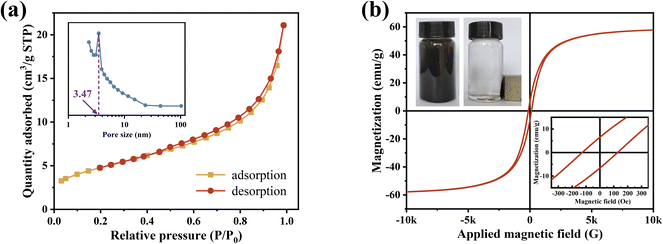
The room-temperature magnetic hysteresis loops obtained from VSM measurements at a maximum magnetic field of 10 kOe are shown in Fig. 4(b). The magnetization curve exhibits a typical hysteresis loop at room temperature, demonstrating the ferromagnetic behavior of as-synthesized nZVI@Fe3O4 adsorbent nanocomposites. The magnetization curve of nZVI@Fe3O4 is very smooth, which suggests that the two magnetic phases (α-Fe and Fe3O4) are exchange-coupled.27 This is in contrast to the presence of a shoulder on the magnetization curves of multiple magnetic phases that lack exchange coupling. The saturation magnetization (MS) of the nZVI@Fe3O4 nanocomposites is 49.84 emu g−1, which is greater than that of nZVI coated with nonmagnetic materials.38 Additionally, nZVI@Fe3O4 has a coercivity (HC) of 127.28 Oe and a residual magnetization strength (Mr) of 6.65 emu g−1. This magnetic characteristic of the as-synthesized nZVI@Fe3O4 nanocomposites enables it to easily separate from aqueous solution using the external magnetic field.
3.3. Study on the adsorption of Cr(VI) by nZVI@Fe3O4
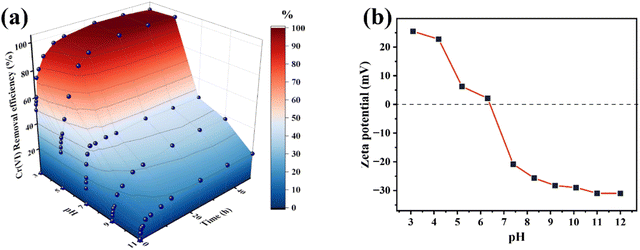 | ||
| Fig. 5 (a) pH-dependent Cr(VI) removal efficiency over the nZVI@Fe3O4 (initial Cr(VI) concentration 50 mg L−1, nZVI@Fe3O4 dosage 1 g L−1, 298.15 K); (b) zeta potential of nZVI@Fe3O4 at different pH. | ||
Explain this phenomenon by the surface chemistry of the aqueous phase, At low pH (1.0–6.5), the main species of Cr(VI) is HCrO4−, while the pH = 6.5–7.5, the species changes to CrO42− and Cr2O72−, and pH > 7.5, CrO42− is the only existing form.18 Compared with CrO42− or Cr2O72−, HCrO4− is advantageous for electrostatic adsorption due to its lower free energy of adsorption at low pH.39 In another light, the surface charge of nZVI@Fe3O4 is determined by the pH. The surface of metal oxides typically contains hydroxyl groups that exhibit different forms depending on the pH of the solution. Fig. 5(b) shows that the zero potential point (pHzpc) of nZVI@Fe3O4 is about 6.5. When the pH is below pHzpc, the surface of nZVI@Fe3O4 is positively charged, making it favorable for adsorption of Cr(VI) anions.
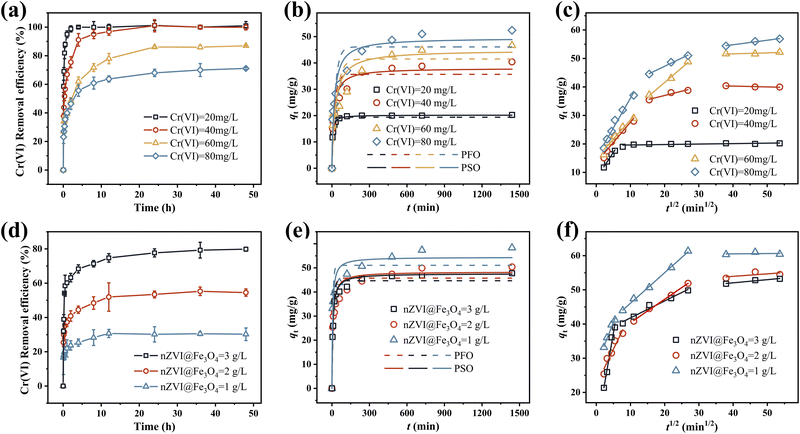
To analyze the adsorption process of Cr(VI) on the surface of nZVI@Fe3O4, two kinetic models, namely the pseudo-first-order (PFO) and pseudo-second-order (PSO) equations, were used (Fig. 6(b) and (e)). The mathematical expressions of the PFO and PSO equations are described in the ESI,† and the Table S1† presents the regression correlation coefficients (R2) computed for the fitted curves. The PSO kinetic model demonstrated better fitting to describe the adsorption of Cr(VI) onto nZVI@Fe3O4 than the PFO, as evidenced by the higher R2 values.24,41 These results suggest that chemisorption, which is driven by valence forces or electron transfer, rather than boundary layer resistance, is the primary mechanism governing Cr(VI) adsorption onto the nZVI@Fe3O4 surface.42,43 The PSO kinetic model are summarized in Table 1. The first five sets of fitted data reveal that as the concentration increases, the adsorption speed of Cr(VI) by nZVI@Fe3O4 decreases, as reflected by the decrease in k2 values. Passivation commonly occurs between high concentration of Cr(VI) and Fe-based materials, where the formation of Cr precipitates can wrap around the active site and reduce the accessibility and/or affinity for Cr(VI) adsorption.44 However, even though the adsorption rate decreases with increasing initial concentration, the qe increases in the process, suggesting that the wrapping on the active site does not affect the final uptake of Cr(VI) by nZVI@Fe3O4. The catalytic surface sites provided by Fe3O4, allowing for a sustained interaction between nZVI@Fe3O4 and Cr(VI), which reduces the passivation effect.18
| Initial Cr(VI) concentration (mg L−1) | nZVI@Fe3O4 dosage (g L−1) | qe (mg g−1) | k2 (g mg−1 min−1) |
|---|---|---|---|
| 20 | 1.0 | 20.19 | 0.0120495 |
| 40 | 39.02 | 0.0017382 | |
| 60 | 45.85 | 0.0008573 | |
| 80 | 50.51 | 0.0006695 | |
| 200 | 1.0 | 54.42 | 0.0002711 |
| 2.0 | 48.35 | 0.0002949 | |
| 3.0 | 47.62 | 0.0003467 |
Moreover, it also can be found in Fig. 6(b) and (e) that the real data points show a step change between 120 min and 720 min which cannot be well captured by the proposed adsorption model, especially with high initial concentrations and low doses. It can be hypothesized that the adsorption of Cr(VI) at high concentrations involves not only electrostatic interactions between nZVI@Fe3O4 and Cr(VI), but also intra-particle diffusion processes.2
To explore the mechanisms of adsorption–diffusion, the intra-particle diffusion model was employed to analyze the kinetic data. Based on the results applied to this model, multistage adsorption of the removal process was noted, suggesting that this process may consist of two steps before reaching equilibrium, as indicated by Fig. 6(c) and (f). Obviously to see that the rate of adsorption is more rapid during the first step because Cr(VI) diffuses through the boundary layer and adsorbs on the nZVI@Fe3O4 surface. While the adsorption rate decreases significantly after 120 min, which is the second step, and intra-particle diffusion may be the main rate-controlling step. Additionally, it should be noted that the fitted curves for both stages did not originate from the origin of the coordinate system, suggesting that the adsorption process is not solely governed by intraparticle diffusion but may also involve some surface complexation reactions. This multistage adsorption indicates that intraparticle diffusion alone cannot be the sole rate-controlling step, and suggests the involvement of multiple mechanisms in the adsorption process.
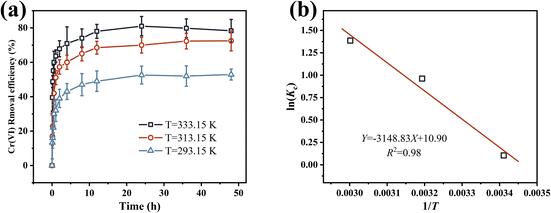 | ||
| Fig. 7 (a) Effect of temperature on Cr(VI) adsorption by nZVI@Fe3O4; (b) plot of KC vs. 1/T for determination of reaction enthalpy and entropy change of Cr(VI) removal by nZVI@Fe3O4. | ||
| T (K) | ΔS (J mol−1 K−1) | ΔH (kJ mol−1) | ΔG (kJ mol−1) |
|---|---|---|---|
| 293.15 | 90.62 | 26.18 | −0.25 |
| 313.15 | −2.50 | ||
| 333.15 | −3.84 |
The calculated ΔG values are consistently negative, indicating the feasibility of the removal process. With increasing temperature, ΔG decreases, suggesting an increase in the spontaneity of the reaction. The positive determine enthalpy change (ΔH) obtained from fitting the data suggest that the removal process is a heat-absorbing chemisorption process, which is consistent with the experimental observations that the removal efficiency increases with temperature. The positive entropy change (ΔS) values suggest that there is a structural change between the adsorbate and the adsorbent, reflecting the strong affinity of nZVI@Fe3O4 for Cr(VI). Such positive ΔS values are often attributed to the dehydration of metal ions and rupture of the hydration shell.47
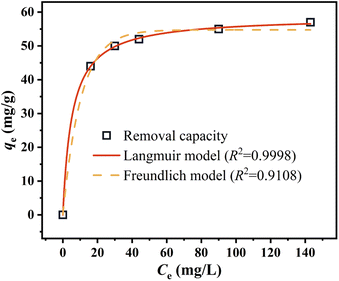
The higher R2 value of Langmuir model in Fig. 8(a) demonstrates that the removal of Cr(VI) by nZVI@Fe3O4 is mainly monolayer adsorption, and the calculated maximum adsorption capacity (qmax) is 58.67 mg L−1. Comparison was made between nZVI@Fe3O4 and other Fe-based adsorbents reported in the literature (Table 3), the as-synthesized nZVI@Fe3O4 has a high adsorption capacity. Considering its cheap raw materials and simple preparation conditions, nZVI@Fe3O4 nanocomposites proved its potential practical value in Cr(VI) removal.
| Number | Adsorbent | Equilibrium time | pH | qmax | References |
|---|---|---|---|---|---|
| 1 | nZVI@Fe3O4 | 24 h | 6.0 | 58.67 | This work |
| 2 | nZVI–Fe3O4 nanocomposites | <2 h | 3.0 | 100.00 | J. Colloid Interface Sci., 2012, 369, 460–469 (ref. 18) |
| 3 | <2 h | 8.0 | 29.43 | ||
| 4 | nZVI–graphene/Fe3O4 | — | 8.0 | 66.20 | J. Colloid Interface Sci., 2014, 417, 51–59 (ref. 43) |
| 5 | Fe3O4 micron-spheres | 60 h | 3.0 | 43.48 | Chem.–Eur. J., 2012, 18, 13418–13426 (ref. 48) |
| 6 | AVT–nZVI | — | 5.0 | 59.17 | Chemosphere, 2019, 218, 458–467 (ref. 49) |
| 7 | nZVI–BC | — | 4.0 | 58.82 | Chemosphere, 2018, 207, 50–59 (ref. 50) |
| 8 | BC–Fe | 24 h | 2.8 | 16.30 | J. Environ. Manage., 2022, 316, 115260 (ref. 51) |
| 9 | nZVI–PCNFs | 6 h | 7.0 | 13.20 | RSC Adv., 2022, 12, 8178–8187 (ref. 52) |
The Langmuir isotherm has a key parameter known as RL, which characterizes the adsorption process of the adsorbent. The computed RL value of 0.016 indicates an advantageous adsorption process.
3.4. Removal of real electroplating wastewater
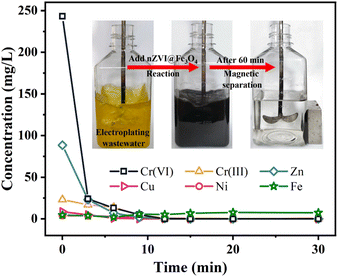
This study explored the effectiveness of nZVI@Fe3O4 in removing Cr(VI) and other heavy metal ions from authentic electroplating wastewater. As showed in Fig. 9 and Table S2,† 1.5 g nZVI@Fe3O4 was added to 300 mL real plating wastewater for treatment, and the reaction was stirred in air to complete the removal process within 30 min. The magnetic properties of nZVI@Fe3O4 allowed for easy separation from the treated electroplating wastewater using a magnet, and it is found that 100% of Cr(VI) and 98.76% of Cr(III) are removed, and the removal of other heavy metals is above 89%. Although the concentration of total Fe increased, it still remained within the desired range. The experimental findings indicate that the application of nZVI@Fe3O4 is highly effective in eliminating heavy metal ions from actual electroplating wastewater.3.5. Reaction mechanism
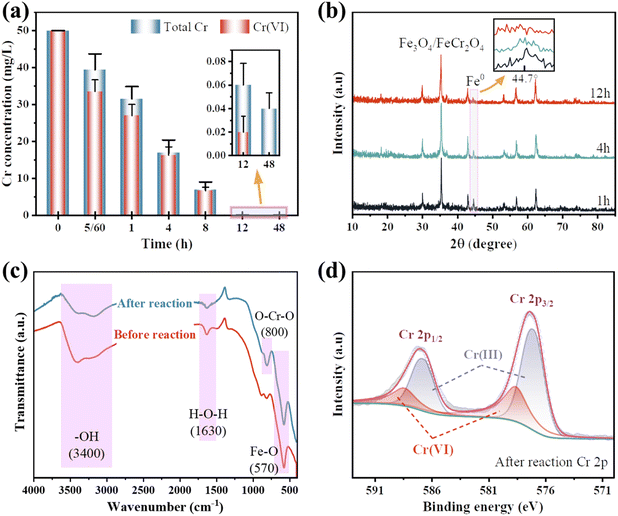
Fig. 10(a) and (b) illustrate the variations in total Cr and Cr(VI) concentrations in solution and the XRD patterns of nZVI@Fe3O4 during adsorption. It can be observed that the total concentration of both total Cr and Cr(VI) decreases with increasing adsorption time. Moreover, the α-Fe diffraction peak keeps weakening (the amplified portion in Fig. 10(b)). This indicates that the reduction of Cr(VI) occurs mainly on the nZVI@Fe3O4 rather than in the solution, and the nZVI has been consumed in the Cr(VI) removal process.Fig. 10(c) displays the absorption peak at 570 cm−1 is believed to be related to the stretching vibration of the tetrahedral group (Fe–O) of nZVI@Fe3O4, while the peaks at 3400 and 1630 cm−1 are caused by the surface –OH.23,53 After the reaction, the peaks at about 800 cm−1 is observed which can be attributed to the antisymmetric Cr–O–Cr stretching, indicating the formation of a Cr-nZVI@Fe3O4 complex.54 This suggests that Cr(VI) has been efficiently captured onto the nZVI@Fe3O4 composites. Furthermore, a detailed XPS investigation of the nZVI@Fe3O4 composites after reaction in the Cr 2p region was performed, as given in Fig. 10(d). The peaks at 588.5 eV for Cr2p 1/2 and 578.6 eV for Cr 2p 3/2 are characteristic of Cr(VI) species, respectively, while the peaks at 586.7 and 577.2 eV belong to the corresponding peaks of Cr(III) species.55 The results indicate that the reaction system involves both the adsorption and reduction of Cr(VI). The reaction can be expressed by eqn (6)–(9):
| 3Fe0 + 2HCrO4− + 14H+ → 3Fe2+ + 2Cr3+ + 8H2O | (6) |
| 3Fe0 + 2CrO42− + 16H+ → 3Fe2+ + 2Cr3+ + 8H2O | (7) |
| 3Fe2+ + HCrO4− + 7H+ → Cr3+ + 3Fe3+ + 4H2O | (8) |
| 3Fe2+ + 2CrO42− + 8H+ → 3Fe3+ + Cr3+ + 4H2O | (9) |
The micrographs and elemental distribution of nZVI@Fe3O4 composite after reaction were characterized. It is evident that the surface roughness of nZVI@Fe3O4 increased and speckled corrosion products were generated after reaction with Cr(VI) (Fig. 11(a)). The EDS point scan displays that the surface of nZVI@Fe3O4 is coated with Fe, O and Cr (Fig. 11(b)), with Fe and Cr being distributed in the same position (Fig. 11(c) and (d)). Previous researches have indicated that the reaction between Cr(VI) and nZVI as well as Fe3O4 produces Fe/Cr oxygen hydroxyl precipitates that stick to the surface (eqn (10)).44,48
| xCr3+ + (1 − x)Fe3+ + 3H2O → CrxFe(1−x)(OH)3 + 3H+ | (10) |
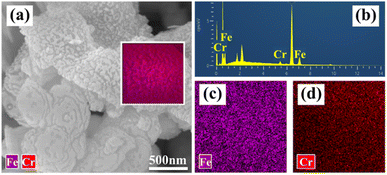 | ||
| Fig. 11 Characterization of nZVI@Fe3O4 after reaction with Cr(VI): (a) FESEM-EDS images, (b) EDS point scan, and EDS mapping of (c) Fe and (d) Cr elemental distribution. | ||
The literature suggests that the combination of nZVI with Fe3O4 has shown improved results compared to using nZVI alone. This is because the Fe3O4 has an octahedral spinel structure, which can serve as a good redox site. On one hand, the surface of Fe3O4 contains Fe(II), which acts as an active reduction site to reduce and detoxify contaminants. During this reaction process, Fe(II) oxidizes itself to Fe(III).19,56 On the other hand, Fe3O4 has a narrow band gap of 0.1 eV and metallic properties, which facilitates the transfer of electrons released by nZVI to the surface of Fe3O4.18 This promotes the regeneration of Fe(III) to Fe(II) and provides an additional channel for the transfer of electrons in addition to direct contact between the contaminant and nZVI.18 Therefore, the combination of nZVI and Fe3O4 ensures continuous reactions between the material and the contaminant, which leads to better results compared to using nZVI alone (eqn (11)).20,57
| 2Fe3+ + Fe0 → 3Fe2+ | (11) |
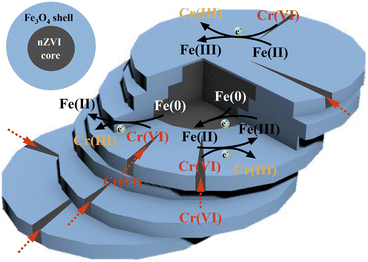
Based on the above discussion and analysis, it can be concluded that the main reaction process of nZVI@Fe3O4 in capturing Cr(VI) in solution can be described in Fig. 12. The as-synthesized nZVI@Fe3O4 has a large surface area, which allows for rapid capture of Cr(VI). Then part of the captured Cr(VI) attaches to Fe3O4 and is reduced and/or immobilized by Fe(II). The cleavage structure of nZVI@Fe3O4 provides more active sites and opportunities for Cr(VI) to intrude inward. After that, Part of the intruded Cr(VI) has the opportunity to be directly reduced to Cr(III) by nZVI. In addition, the nZVI in the core can reduce the oxidized Fe(III) on the surface of Fe3O4 to Fe(II), providing the additional channel for electron transfer. This ensures the long-term reactivity and ideal adsorption capacity of nZVI@Fe3O4 for Cr(VI) removal. Overall, the reaction process of nZVI@Fe3O4 with Cr(VI) is a complex process involving multiple steps of adsorption and reduction, which is facilitated by the unique properties of the material.
4. Conclusions
This study aimed to prepare core@shell structured nZVI@Fe3O4 nanocomposite for its potential application in removing Cr(VI) from aqueous solutions. The method involves a simple and low-cost process of Fe(II) disproportionation reaction using NaOH at 150 °C for 0.5 h, which produced larger particles composed of nanosheets of Fe3O4 wrapped around nZVI. The resulting material exhibits excellent magnetic separation properties, as well as large surface area of fissure structures. The kinetic and thermodynamic studies indicate that the adsorption process follows the pseudo-second-order and Langmuir models, respectively, suggesting a spontaneous, heat-absorbing, and chemisorption process. The qmax of nZVI@Fe3O4 for Cr(VI) was calculated by the model to be 58.67 mg g−1 at pH = 6.0.Moreover, the main mechanism of Cr(VI) removal by nZVI@Fe3O4 is attributed to adsorption, reduction, and co-precipitation reactions. The cleavage structure provides active sites for Cr(VI) immobilization and reduction, and the reduction of Cr(VI) to Cr(III) is also facilitated by the electrons in nZVI through Fe3O4, which may be the main pathway for electron transfer and Cr(VI) detoxification. In conclusion this study demonstrate that nZVI@Fe3O4 prepared by Fe(II) disproportionation reaction is a promising, cost-effective material for environmental and industrial wastewater treatment due to its excellent magnetic recovery properties and efficient removal of Cr(VI) and other heavy metal ions.
Author contributions
Chuan He: conceptualization, methodology, material preparation, data analysis, writing – original draft; Yarong Ding: investigation, visualization; Canhua Li: supervision & project administration; Wang Yan: data analysis; Aiqin Mao: writing – review & editing; Shuxian Wei: investigation; Minghui Li: supervision.Conflicts of interest
There are no conflicts to declare.Acknowledgements
This work was supported by the Natural science research project of colleges and universities in Anhui Province (Project No. YJS20210333).References
- P. J. Landrigan, R. Fuller, N. Acosta, O. Adeyi, R. Arnold, N. N. Basu, A. B. Balde, R. Bertollini, S. Bose-O'Reilly, J. I. Boufford, P. N. Breysse, T. Chiles, C. Mahidol, A. M. Coll-Seck, M. L. Cropper, J. Fobil, V. Fuster, M. Greenstone, A. Haines, D. Hanrahan, D. Hunter, M. Khare, A. Krupnick, B. Lanphear, B. Lohani, K. Martin, K. V. Mathiasen, M. A. McTeer, C. Murray, J. D. Ndahimananjara, F. Perera, J. Potocnik, A. S. Preker, J. Ramesh, J. Rockstrom, C. Salinas, L. D. Samson, K. Sandilya, P. D. Sly, K. R. Smith, A. Steiner, R. B. Stewart, W. A. Suk, O. van Schayck, G. N. Yadama, K. Yumkella and M. Zhong, Lancet, 2018, 391, 462–512 CrossRef PubMed.
- Y. Wei, R. Chu, Q. Zhang, M. Usman, F. U. Haider and L. Cai, RSC Adv., 2022, 12, 26953–26965 RSC.
- K. E. Ukhurebor, U. O. Aigbe, R. B. Onyancha, W. Nwankwo, O. A. Osibote, H. K. Paumo, O. M. Ama, C. O. Adetunji and I. U. Siloko, J. Environ. Manage., 2021, 280, 111809 CrossRef CAS PubMed.
- L. Qian, X. Shang, B. Zhang, W. Zhang, A. Su, Y. Chen, D. Ouyang, L. Han, J. Yan and M. Chen, Chemosphere, 2019, 215, 739–745 CrossRef CAS PubMed.
- J. J. Coetzee, N. Bansal and E. M. N. Chirwa, Exposure Health, 2020, 12, 51–62 CrossRef.
- Y. Wu, H. Pang, Y. Liu, X. Wang, S. Yu, D. Fu, J. Chen and X. Wang, Environ. Pollut., 2019, 246, 608–620 CrossRef CAS PubMed.
- Y. Chen, D. Liu and J. Lee, Phys. Chem. Miner., 2018, 45, 907–913 CrossRef CAS.
- L. Di Palma, M. T. Gueye and E. Petrucci, J. Hazard. Mater., 2015, 281, 70–76 CrossRef CAS PubMed.
- S. C. N. Tang and I. M. C. Lo, Water Res., 2013, 47, 2613–2632 CrossRef CAS PubMed.
- E. Lefevre, N. Bossa, M. R. Wiesner and C. K. Gunsch, Sci. Total Environ., 2016, 565, 889–901 CrossRef CAS PubMed.
- M. Stefaniuk, P. Oleszczuk and Y. S. Ok, Chem. Eng. J., 2016, 287, 618–632 CrossRef CAS.
- K. Wei, H. Li, H. Gu, X. Liu, C. Ling, S. Cao, M. Li, M. Liao, X. Peng, Y. Shi, W. Shen, C. Liang, Z. Ai and L. Zhang, Adv. Funct. Mater., 2022, 32, 2200498 CrossRef CAS.
- W. Liang, G. Wang, C. Peng, J. Tan, J. Wan, P. Sun, Q. Li, X. Ji, Q. Zhang, Y. Wu and W. Zhang, J. Hazard. Mater., 2022, 426, 127993 CrossRef CAS PubMed.
- M. Li, H. Shang, H. Li, Y. Hong, C. Ling, K. Wei, B. Zhou, C. Mao, Z. Ai and L. Zhang, Angew. Chem., 2021, 133, 17252–17259 CrossRef.
- L. Liang, X. Li, Y. Guo, Z. Lin, X. Su and B. Liu, J. Hazard. Mater., 2021, 404, 124057 CrossRef CAS PubMed.
- F. He, Z. Li, S. Shi, W. Xu, H. Sheng, Y. Gu, Y. Jiang and B. Xi, Environ. Sci. Technol., 2018, 52, 8627–8637 CrossRef CAS PubMed.
- L. Honetschlägerová, P. Janouškovcová, M. Velimirovic, M. Kubal and L. Bastiaens, Silicon, 2018, 10, 2593–2601 CrossRef.
- X. Lv, J. Xu, G. Jiang, J. Tang and X. Xu, J. Colloid Interface Sci., 2012, 369, 460–469 CrossRef CAS PubMed.
- J. D. Akoto, F. Chai, E. Repo, Z. Yang, D. Wang, F. Zhao, Q. Liao and L. Chai, J. Environ. Chem. Eng., 2022, 10, 108589 CrossRef CAS.
- X. Lv, W. Prastistho, Q. Yang and C. Tokoro, Appl. Organomet. Chem., 2020, 34, e5592 CrossRef CAS.
- L. Tan, S. Lu, Z. Fang, W. Cheng and E. P. Tsang, Appl. Catal., B, 2017, 200, 200–210 CrossRef CAS.
- W. Li, F. Fu, Z. Ding and B. Tang, J. Taiwan Inst. Chem. Eng., 2018, 85, 155–164 CrossRef CAS.
- L. Wang, J. Li, Z. Wang, L. Zhao and Q. Jiang, Dalton Trans., 2013, 42, 2572–2579 RSC.
- Z. Lv, S. Yang, L. Chen, A. Alsaedi, T. Hayat and C. Chen, J. Environ. Sci., 2019, 76, 377–387 CrossRef PubMed.
- H. Gu, H. Lou, D. Ling, B. Xiang and Z. Guo, RSC Adv., 2016, 6, 110134–110145 RSC.
- S. Yamamuro and T. Tanaka, J. Ceram. Soc. Jpn., 2018, 126, 152–155 CrossRef CAS.
- S. Yamamuro and T. Tanaka, Mater. Lett., 2021, 290, 129468 CrossRef CAS.
- W. K. Jozwiak, E. Kaczmarek, T. P. Maniecki, W. Ignaczak and W. Maniukiewicz, Appl. Catal., A, 2007, 326, 17–27 CrossRef CAS.
- T. B. Scott, M. Dickinson, R. A. Crane, O. Riba, G. M. Hughes and G. C. Allen, J. Nanopart. Res., 2010, 12, 1765–1775 CrossRef CAS.
- R. A. Crane and T. B. Scott, J. Hazard. Mater., 2012, 211–212, 112–125 CrossRef CAS PubMed.
- X. Ma, D. He, A. M. Jones, R. N. Collins and T. D. Waite, J. Hazard. Mater., 2016, 303, 101–110 CrossRef CAS PubMed.
- R. Fu, Y. Yang, Z. Xu, X. Zhang, X. Guo and D. Bi, Chemosphere, 2015, 138, 726–734 CrossRef CAS PubMed.
- K. Tokumitsu and T. Nasu, Scr. Mater., 2001, 44, 1421–1424 CrossRef CAS.
- C. Wang, D. R. Baer, J. E. Amonette, M. H. Engelhard, J. Antony and Y. Qiang, J. Am. Chem. Soc., 2009, 131, 8824–8832 CrossRef CAS PubMed.
- L. Dai, K. Meng, W. Zhao, T. Han, Z. Lei, G. Ma, X. Tian and J. Ren, Nanomaterials, 2022, 12, 1591 CrossRef CAS PubMed.
- E. M. Abd El-Monaem, A. M. Omer, G. M. El-Subruiti, M. S. Mohy-Eldin and A. S. Eltaweil, Biomass Convers. Biorefin., 2022 DOI:10.1007/s13399-022-02362-y.
- C. Sangwichien, G. L. Aranovich and M. D. Donohue, Colloids Surf., A, 2002, 206, 313–320 CrossRef CAS.
- A. S. Eltaweil, H. Ali Mohamed, E. M. Abd El-Monaem and G. M. El-Subruiti, Adv. Powder Technol., 2020, 31, 1253–1263 CrossRef CAS.
- J. Hu, G. Chen and I. M. C. Lo, Water Res., 2005, 39, 4528–4536 CrossRef CAS PubMed.
- Z. Fang, X. Qiu, R. Huang, X. Qiu and M. Li, Desalination, 2011, 280, 224–231 CrossRef CAS.
- M. Fazlzadeh, K. Rahmani, A. Zarei, H. Abdoallahzadeh, F. Nasiri and R. Khosravi, Adv. Powder Technol., 2017, 28, 122–130 CrossRef CAS.
- M. Deng, X. Wang, Y. Li, F. Wang, Z. Jiang, Y. Liu, Z. Gu, S. Xia and J. Zhao, Sci. Total Environ., 2020, 743, 140722 CrossRef CAS PubMed.
- X. Lv, X. Xue, G. Jiang, D. Wu, T. Sheng, H. Zhou and X. Xu, J. Colloid Interface Sci., 2014, 417, 51–59 CrossRef CAS PubMed.
- X. Huang, L. Ling and W. Zhang, J. Environ. Sci., 2018, 67, 4–13 CrossRef CAS PubMed.
- D. Liu, Z. Liu, C. Wang and Y. Lai, J. Radioanal. Nucl. Chem., 2016, 310, 1131–1137 CrossRef CAS.
- M. Arshadi, M. Soleymanzadeh, J. W. L. Salvacion and F. SalimiVahid, J. Colloid Interface Sci., 2014, 426, 241–251 CrossRef CAS PubMed.
- H. K. Boparai, M. Joseph and D. M. O Carroll, J. Hazard. Mater., 2011, 186, 458–465 CrossRef CAS PubMed.
- G. Liu, Q. Deng, H. Wang, S. Kang, Y. Yang, D. H. L. Ng, W. Cai and G. Wang, Chem.–Eur. J., 2012, 18, 13418–13426 CrossRef CAS PubMed.
- R. Zhao, Z. Zhou, X. Zhao and G. Jing, Chemosphere, 2019, 218, 458–467 CrossRef CAS PubMed.
- S. Zhu, X. Huang, D. Wang, L. Wang and F. Ma, Chemosphere, 2018, 207, 50–59 CrossRef CAS PubMed.
- J. Dobrzyńska, A. Wysokińska and R. Olchowski, J. Environ. Manage., 2022, 316, 115260 CrossRef PubMed.
- Q. Niu, M. Liu, L. Fang, Y. Yu, L. Cheng and T. You, RSC Adv., 2022, 12, 8178–8187 RSC.
- M. J. Carrera Espinoza, K. Lin, M. Weng, S. C. Kunene and S. S. S. Wang, Eur. Polym. J., 2021, 153, 110504 CrossRef CAS.
- G. Wei, J. Qu, T. Qi, Y. Zheng and Q. Guo, J. Therm. Anal. Calorim., 2014, 117, 741–745 CrossRef CAS.
- W. Zhang, L. Qian, D. Ouyang, Y. Chen, L. Han and M. Chen, Chemosphere, 2019, 221, 683–692 CrossRef CAS PubMed.
- G. Qu, D. Zeng, R. Chu, T. Wang, D. Liang and H. Qiang, Environ. Sci. Pollut. Res., 2019, 26, 5176–5188 CrossRef CAS PubMed.
- H. Lu, J. Wang, H. Hao and T. Wang, Nanomaterials, 2017, 7, 303 CrossRef PubMed.
Footnote |
| † Electronic supplementary information (ESI) available. See DOI: https://doi.org/10.1039/d3ra03133k |
| This journal is © The Royal Society of Chemistry 2023 |

