 Open Access Article
High-performance sorbents from ionic liquid activated walnut shell carbon: an investigation of adsorption and regeneration
Liu Yang ,
Wang Yungang
 *,
Liu Tao,
Zou Li,
Bai Yanyuan and
Xiu Haoran
Key Laboratory of Thermo Fluid Science and Engineering (Ministry of Education), Xi'an Jiaotong University, Xi'an 710049, Shannxi, China. E-mail: ygwang1986@xjtu.edu.c
First published on 27th July 2023
Abstract
In this paper, walnut shells were selected to make activated charcoal using ionic activators. Based on the physical/chemical activation process and the properties of activated carbon products, the Fourier Transform Infrared reflection and Brunauer–Emmett–Teller analysis methods were adopted to comparatively analyse activation principles and pore-structure parameters. Also ciprofloxacin adsorption was compared among various activated carbon. Then, an absence of microporous structure in both walnut shells and their carbonized derivatives was found. Moreover, the specific surface area of activated carbon, prepared via KOH wet activation within physical/chemical procedures, attains a noteworthy 1787.06 m2 g−1, underlining its commendable adsorption performance. The specific surface areas of five distinct activated carbons, processed via ionic activation, extend from 1302.01 to 2214.06 m2 g−1. Concurrently, the micropore volumes span from 0.47 to 0.93 cm3 g−1. Obviously, the adsorption proficiency of ion-activated carbon markedly exceeds that of carbons activated physically or chemically. Of all materials investigated in this paper, ion-activated carbon D consistently exhibits superior performance, maintaining a ciprofloxacin removal rate nearing 100% at 40 °C. Remarkably, the maximum regeneration frequency of ion-activated carbons can reach up to 10 cycles. In conclusion, these five ion-activated carbons, demonstrating superior pore-structure parameters and adsorptive capacities, outperform those prepared through physical/chemical methods. They emerge as promising contenders for new, high-performing adsorbents.
1 Introduction
Activated carbon, with its unique pore structure and functional groups, possesses commendable thermal stability, chemical stability, high mechanical strength, and reproducibility.1 As a versatile functional material, it finds widespread applications in various domains such as electrochemistry and environmental protection.2 Recently, in line with China's rapid development across multiple sectors, the performance requirements and demand for activated carbon have risen, leading to extensive research on the activation and performance of activated carbon.3Zhang and colleagues activated tobacco stem using a physical method, creating activated carbon with several mesopores and micropores via the H2O and CO2 methods respectively, with mesopores representing a scant 3.85%.4 On the other hand, Wolfgang and team carried out a physical activation study on diverse agricultural and sideline products, finding the activation effect of the H2O method to be superior to that of the CO2 method.5 Further investigations were conducted by González et al. who performed thermal analysis on biomass samples and prepared activated carbon through water vapor gasification. Their results indicated that four types of biomass materials could be employed to create adsorbent materials with differing structural features.6 In a CO2 and N2 atmosphere, Magdziarz et al. examined the activation of walnut shell and discovered that the micropores of activated carbon prepared under CO2 atmosphere were more developed.7 Román and colleagues activated olive shell by using CO2, H2O, or their mixtures, preparing multiple series of activated carbon. They found that CO2 produced narrow micropores on the olive shell charcoal, a characteristic that amplified over time.8 Deng et al. prepared activated carbon from pineal shell at different KOH/C mass ratios and activation temperatures, reporting that the carbon dioxide adsorption capacity peaked at 7.7 and 5 mmol g−1 at 73 K and 298 K, respectively.9 Alonso et al. analyzed the activation of biomass at different proportions of KOH and observed an increase in activated micropores when the agent/material ratio was less than 3. Additionally, they found an increase in the proportion of mesopores in the activated carbon when the ratio was raised.10 Yu et al. evaluated the impact of KOH dosage and other activation factors on the specific surface area and other properties of bamboo chip-activated carbon. They reported that the pore area of the product reached 1490 m2 g−1, achieved under specific conditions: an agent/material ratio of 0.7, a temperature of 800 °C, and a duration of 20 min.11 A similar study by Zhang et al. on activated walnut shell using KOH found that at an agent/material ratio of 4, the activated carbon procured at 800–900 °C exhibited optimal performance, boasting a total pore volume of 1.46 mL g−1.12 Wu and colleagues prepared porous carbon by employing fir wood and pistachio shell as raw materials and activated carbon using water vapor and KOH. They determined that the content of mesopores in activated carbon by water vapor and KOH ranged between 9–15% and 33–49% respectively.13 Juang et al. studied the impact of KOH dosage on the activation of bramble charcoal, revealing that micropores increased when the agent/material ratio was less than 5. However, both micropores and mesopores increased when the ratio exceeded 5.14 Bardhan et al. prepared areca shell-activated carbon via chemical activation and found the adsorption capacity of activated carbon to be 381.6, 339.8 and 235.2 mg g−1 at 30 °C, 40 °C and 50 °C respectively.15 Hayashi and team conducted experiments on various types of fruit shells using the K2CO3 method and discovered that the activated carbon from all shells performed best at 800 °C.16 Kim and colleagues examined the adsorption characteristics of trimethoprim onto powdered activated carbon and granular activated carbon, and found that both types of activated carbon reached adsorption equilibrium after 30 and 40 min, respectively.17 Lastly, Maria et al. studied the adsorption capacity of sugarcane bagasse for the removal of ciprofloxacin from water using batch experiments and a fixed bed column. They compared its adsorption performance with a powdered activated commercial carbon and found that both adsorbents achieved a similar percentage removal of about 78%.18 Pal et al. utilized KOH for chemical activation to synthesize activated carbon with a large specific surface area. They also evaluated the thermal conductivity, particle size distribution, pore size distribution, specific surface area, and pore volume of the activated carbon.19 These studies offer insightful and varied perspectives on the activation of carbon using different raw materials and methods, leading to diverse results in adsorption performance.20–22
Given the wealth of research and diverse methods employed in preparing activated carbon, there remains a gap in the use of agricultural and forestry wastes, particularly fruit shells, as raw materials for carbonization. Furthermore, while the main activation methods include physical and chemical processes, they often result in environmental damage, serious equipment corrosion, extensive activator usage, poor economy, and largely produce mesoporous and macroporous activated carbons, with relatively few micropores. Therefore, a pressing need exists for a cost-effective, environment-friendly, and recyclable activation method.23,24 Ionic liquids, as a new class of green reagents, have seen widespread application in the chemical industry, but their potential in the activation field remains largely unexplored. This paper addresses this gap by employing ionic reagents as activators to activate walnut shells. We compare ionic activated carbon in terms of pore structure parameters, activation mechanisms, and adsorption performance with physically/chemically activated carbon, aiming to identify environment-friendly activation methods and activated carbons with optimal adsorption/regeneration performance.
2 Material and methods
The production process of biomass-activated carbon is typically segmented into two steps: carbonisation and activation. As the surface and internal pores of carbonised biomass charcoal are not properly developed, and the material exhibits almost negligible adsorption capability, the activation of biomass charcoal thus becomes a crucial step in this process.252.1 Source of raw materials
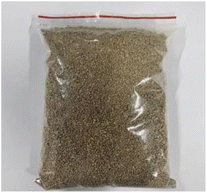
In this paper, we utilised walnut shells sourced from Weinan, Shaanxi Province, as our primary raw material. Based on response surface analysis, the carbonisation of walnut shell is performed under the following conditions: heating time of 14.8 min, final temperature of 324.7 °C, and holding time of 55.5 min. The particle size of the material used is 2 mm. Subsequent to this, the walnut shell charcoal was activated (Fig. 1).2.2 Materials and devices
The activated material used in the experiment is the walnut shell charcoal prepared under the optimal carbonisation condition. Carbon particles, of 2 mm size, were ground and screened through a 100-mesh sieve to produce walnut shell charcoal powder. The activated materials of different sizes are then placed in a drying oven and subsequently removed for activation-related experiments to create activated carbon. The primary equipment used in the experiment is detailed in Table 1.| Instrument | Model | Manufacturer |
|---|---|---|
| Air blast drying oven | DHG-9070A | Shanghai Xinyi Instrument Co., Ltd |
| Constant temperature stirring water bath | HH-1 | Shanghai Heheng Instrument Co., Ltd |
| Electronic analytical balance | ME-55 | Mettler Toledo International Limited |
| pH meter | PHS-2F | Shanghai Yidian Instrument Co., Ltd |
| Diaphragm vacuum pump | GM-0.5B | Tianjin Jinteng Instrument Co., Ltd |
| Deionized water machine | AK-RO-C2 | Shanghai Yidian Instrument Co., Ltd |
| BET | BELSORP-Max | McChibeer Co., Japan |
| Reciprocating thermostatic oscillator | SHZ-C | Shanghai Chuanhong Experimental Instruments Co., LTD |
| UV/VIS spectrophotometer | UV-3600 | Beijing Timesun Measurement and Control Technology Co., Ltd |
The nitrogen and carbon dioxide utilized in the experiment are standard gases with a purity of 99.99%. For activation purposes, high-purity chemical reagents including KOH, [Bmim]PF6, [Bmim]BF4, [Bmim]Cl, and [Hnmp]CH3SO3, all with a purity exceeding 99%, are primarily employed.
2.3 Physical/chemical activation conditions
Currently, the primary activation methods include physical and chemical approaches. During chemical activation, chemicals are introduced to the carbon powder, which is then heated under an inert atmosphere. Chemical activation methods can be classified broadly into dry and wet activation. On the other hand, physical methods utilize appropriate gases to oxidize the biomass charcoal. The gas reacts with the biomass charcoal at temperatures ranging from 800–1000 °C, consequently leading to the formation of a multitude of complex pore structures.26–28The specific route of chemical activation involves the following steps: (1) dry walnut shell charcoal particles are ground to 100 meshes. (2) A KOH solution with a mass fraction of approximately 85% is prepared. Subsequently, 1 g of charcoal powder is combined with 3 g of KOH powder and KOH reagent. (3) The raw materials for the wet method are sealed with plastic wrap and stirred in a water bath at room temperature. Then the raw materials for the dry/wet method are placed in a drying oven and subjected to a 105 °C heat treatment for 24 h. (4) The dry carbon powder is placed in a tubular furnace under a nitrogen atmosphere and activated at 600 °C for 50 min. (5) The activated carbon is repeatedly washed with deionised water and dried in an air blast drying oven at 105 °C for 12 h to yield C-DKOH and C-WKOH.
The specific route of physical activation involves the following steps: (1) during carbon dioxide activation, 5 g of walnut shell charcoal particles are placed into a tubular furnace. The gas flow is set to 40 mL min−1. Under a nitrogen atmosphere, the temperature is raised to 850 °C at a rate of 20 °C min−1. After maintaining the carbon dioxide temperature for 120 min, it is switched to nitrogen for cooling, producing C-CD. (2) During water vapor activation, the nitrogen flow is set to 150 mL min−1, and the flow of water vapor to 0.2 g min−1. The tubular furnace temperature rises to 850 °C at a rate of 20 °C min−1. After maintaining this temperature for 90 min, the water vapor is turned off, producing C-V. (3) During carbon dioxide/water vapor mixed activation, the carbon dioxide flow is set to 40 mL min−1, and the water vapor flow to 0.41 g min−1. The tubular furnace temperature initially rises to 850 °C at a rate of 20 °C min−1 under a nitrogen atmosphere. After switching to mixed gas activation for 60 min, it is again switched to nitrogen. After cooling, C-Mix is obtained (Table 2).
| Symbol | Abbreviation | Sample |
|---|---|---|
| a | WS | Walnut shell |
| b | WSC | Walnut shell charcoal |
| c | C-DKOH | KOH dry-method activated carbon |
| d | C-WKOH | KOH wet-method activated carbon |
| e | C-CD | CO2 activated carbon |
| f | C-V | Vapour activated carbon |
| g | C-Mix | CO2&vapour activated carbon |
2.4 Ionic activation conditions
Ionic reagents required for ionic activation is a research hotspot in green chemistry. In general, ionic liquid is salt composed of specific organic cations (imidazole, pyrrolidone, pyridine ion, etc.) with a large volume of asymmetric structure and inorganic or organic anions (BF4−, PF6−, CF3SO3−, CF3CO2−, etc.) with small volume. Ionic liquid has unique properties, such as non-flammable, non-volatile, recyclable, low water vapor pressure, difficult to have evaporative boiling, good solubility in most compounds and stable chemical properties. Thus, it is widely used in various fields. Dehydration and carbonisation reactions occur in the catalytic hydrolysis of three elements by ionic liquid.29 At present, no research has been conducted on ionic activation. This paper aims to analyse the activation effect by using a variety of ion activators.Ionic reagents employed in this study include [Bmim]BF4, [Bmim]PF6, [Bmim]Cl, and [Hnmp]CH3SO3, whose structural formulas are illustrated in Fig. 2. Considering the dearth of research on biomass activated by ionic liquid and no report on activation by fruit shell, five feasible experimental schemes were selected after multiple preliminary experiments, based on comprehensive understanding of the aforementioned four ionic liquids. The ionic reagents and their dosages are presented in Table 3.
| Sample | Ionic reagents | Dosage |
|---|---|---|
| Ion-A | [Hnmp]CH3SO3 | 7.5 g |
| Ion-B | [Bmim]BF4 | 2 g |
| Ion-C | [Bmim]PF6 | 1 g |
| Ion-D | [Bmim]BF4![[thin space (1/6-em)]](https://www.rsc.org/images/entities/char_2009.gif) : :![[thin space (1/6-em)]](https://www.rsc.org/images/entities/char_2009.gif) [Bmim]PF6 = 3 [Bmim]PF6 = 3![[thin space (1/6-em)]](https://www.rsc.org/images/entities/char_2009.gif) : :![[thin space (1/6-em)]](https://www.rsc.org/images/entities/char_2009.gif) 10 10 |
1 g |
| Ion-E | [Bmim]Cl | 5 g |
Ionic activation process: 10 g of 100-mesh walnut shell charcoal powder is weighed and placed into a beaker, followed by dripping the above ionic reagent and a small amount of deionised water into the beaker, which is then sealed with plastic wrap. The beaker is placed into a water bath mixer at 50 °C and stirred for 300 min. A small amount of deionised water is washed and filtered after impregnation. The ionic liquid is extracted from the filtered liquor with ethyl acetate, collected, and reused after centrifugal drying. After being dried in a blast drying oven at 105 °C, the charcoal powder is placed into a tubular furnace. The temperature is increased from room temperature to 600 °C at a rate of 10 °C min−1 in a nitrogen atmosphere. The temperature is maintained for 180 min, resulting in the products Ion A–E.
2.5 Ciprofloxacin adsorption experiments
Adsorption experiments on the adsorbents were carried out as follows:Briefly, 0.01 g of each adsorbent is weighed and placed into a 50 mL conical flask. Then, 20 mL of the CIP (Ciprofloxacin) solution is added to each conical flask at a concentration of 100 mg L−1, and the flask is sealed with plastic wrap and a rubber band. The CIP solution is shaken in a reciprocating thermostatic oscillator at temperatures of 20 °C, 30 °C, 40 °C, 50 °C, and 60 °C and at a speed of 120 rpm. After absorption for 180 min, all the conical flasks are removed, the supernatant is extracted with an injector, and about 10 mL of the solution is filtered into a sample tube via a 0.45 μm filter membrane. Variations in concentration are measured using a UV/VIS spectrophotometer.
In these experimental schemes, absorption is measured with a UV/VIS spectrophotometer at a wavelength of 275 nm. Changes in the concentration of the CIP solution are analysed by comparing them to the standard curves. The adsorption capacity of each activated carbon and the corresponding adsorption capacity of the CIP solution are calculated using the following formulas:
 | (1) |
 | (2) |
2.6 Experiment on the regeneration times of activated carbon
Regeneration of activated carbon involves the removal of adsorbed substances from saturated activated carbon while maintaining the carbon structure, thereby restoring its adsorption capacity and facilitating its reuse. Thermal regeneration of activated carbon is feasible on a large scale, environmentally friendly, exhibits low energy consumption, has a short processing time, and boasts high regeneration efficiency, thereby making it a promising strategy. In the regeneration experiment, the activated carbon with the highest CIP removal rate among Ion A–E was used to investigate the regeneration efficiency and the degradation of regeneration quality with repeated regenerations.Experimental method: sturated activated carbon was situated in a Buchner funnel lined with filter paper and rinsed several times with deionized water until a neutral pH was reached. Then, it was transferred to a blast drying oven and dried at 105 °C for 24 h. After drying, the activated carbon was weighed, positioned in an alumina boat, and subjected to high-temperature treatment at 350 °C for 2 h in a tube furnace under a nitrogen atmosphere. The regenerated activated carbon was weighed, and adsorption experiments were performed under identical conditions. The adsorption and regeneration experiments were repeated until the activated carbon became completely ineffective.
The formula for calculating the loss rate of regeneration quality of activated carbon is as follows:
 | (3) |
The formula for calculating the regeneration rate of walnut shell activated carbon is:
 | (4) |
3 Results and discussion
3.1 Analysis of physical/chemical activation
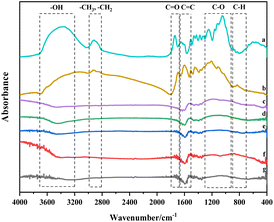
Walnut shell's cellulose, hemicellulose, and lignin are composed of various functional groups found in olefins, esters, aromatics, ketones, and alcohols. Yang et al. investigated the three components using FTIR, revealing distinct infrared structures for each. Cellulose demonstrates the highest infrared absorbance for –OH and C–O, while hemicellulose comprises –OH, C–O, and C![[double bond, length as m-dash]](https://www.rsc.org/images/entities/char_e001.gif) O compounds.30 Compared to cellulose and hemicellulose, lignin shows significant differences in the infrared spectrum within the characteristic range (730–1830 cm−1). Lignin is a compound rich in –O–CH3, C–O–C, C
O compounds.30 Compared to cellulose and hemicellulose, lignin shows significant differences in the infrared spectrum within the characteristic range (730–1830 cm−1). Lignin is a compound rich in –O–CH3, C–O–C, C![[double bond, length as m-dash]](https://www.rsc.org/images/entities/char_e001.gif) C, and C–H. Carbonisation involves breaking C–O–C and C–H and transforming aromatic rings. As lignin is rich in the mentioned functional groups within its characteristic area, its transformation and reactions primarily influence the formation of the graphite structure during carbonisation and activation.31
C, and C–H. Carbonisation involves breaking C–O–C and C–H and transforming aromatic rings. As lignin is rich in the mentioned functional groups within its characteristic area, its transformation and reactions primarily influence the formation of the graphite structure during carbonisation and activation.31
The histogram in Fig. 4 displays the normalized changes in functional groups within each characteristic area across the seven samples. The normalization process for all data is as follows: The integral area of the spectral peak associated with the functional group of the walnut shell is set as 1, and normalization is carried out on the integral area of the spectral peaks of functional groups of other samples.
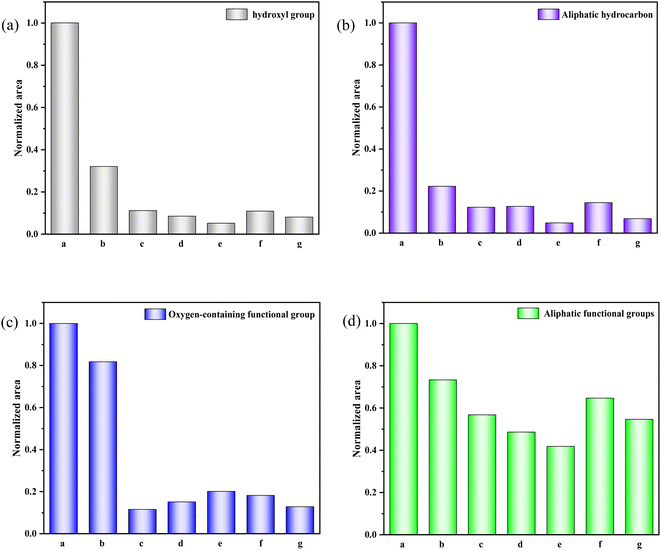 | ||
| Fig. 4 Evolution of various functional groups during physical/chemical activation of walnut shells. (a) 400–1300 cm−1. (b) 1300–2000 cm−1. (c) 2000–3000 cm−1. (d) 3000–4000 cm−1. | ||
Fig. 4(a) provides a quantitative analysis of each sample's hydroxyl group. Examining the change in hydroxyl content during carbonisation and activation reveals that with increasing temperature, significant evaporation of water in the walnut shell sample occurs during carbonisation, and the bound hydroxyl decomposes. This leads to a marked reduction in hydroxyl content and the formation of pore structure. Hydroxyl content slightly decreases during activation, which is due to the decomposition of the majority of bound hydroxyl groups.
Aliphatic functional groups, primarily composed of –CH3 and –CH2, fall within the 2800–3000 cm−1 range. The histograms in Fig. 4(b) illustrate changes in these aliphatic functional groups. During carbonization, –CH3 and –CH2 as highly active functional groups exhibit strong reactivity, resulting in significant consumption. During activation, the content of these aliphatic functional groups diminishes slightly as aliphatic hydrocarbons are essentially depleted.
The variation in oxygen-containing functional groups during carbonization is marginal, as depicted in Fig. 4(c). These functional groups exhibit low activity during carbonization at lower temperatures, and other functional groups transform into oxygen-containing functional groups in this stage. During activation, the differences in the content of oxygen-containing functional groups among activated carbon samples are not significant. However, this content profoundly affects the chemical adsorption and other properties of activated carbon.32
Fig. 4(d) presents the decline in aromatic functional groups during both carbonization and activation. A minor difference in the content of aromatic compounds can be observed among activated carbon samples. The content of aromatic compounds in the C-Mix sample is the lowest, suggesting that the greatest burst size of aromatic functional groups occurs during the activation of mixed gas. Consequently, the formed activated carbon exhibits a stable structure and a high degree of graphitization.
| Activated carbon | Specific surface area/m2 g−1 | Pore volume/cm3 g−1 | Micropore volume/cm3 g−1 | Average pore size/nm |
|---|---|---|---|---|
| C-DKOH | 885.23 | 0.46 | 0.32 | 2.03 |
| C-WKOH | 1787.06 | 0.76 | 0.56 | 1.79 |
| C-CD | 807.90 | 0.43 | 0.38 | 1.86 |
| C-V | 512.08 | 0.27 | 0.14 | 2.30 |
| C-Mix | 1214.06 | 0.63 | 0.51 | 2.11 |
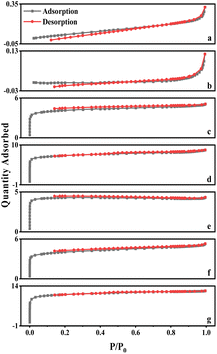
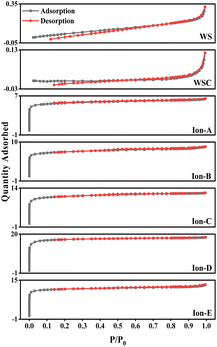
The curves for walnut shell and walnut shell charcoal, shown in Fig. 5, are indicative of typical non-porous material curves, demonstrating minimal adsorption and desorption. Activated carbon samples c and d, activated via dry and wet chemical methods, were further analyzed. When P/P0 is less than 1, the nitrogen adsorption capacity increases rapidly, suggesting a microporous structure in the chemically activated carbon. When P/P0 exceeds 0.1, capillary condensation is observed in both curves, suggesting that the adsorption and desorption curves do not overlap and a hysteresis loop is evident.
The C-WKOH and C-DKOH samples showed that the specific surface area, pore volume, and micropore volume of C-WKOH are higher than those of C-DKOH. The average pore size of activated carbon by the chemical method is 1.79 and 2.03 nm. Thus, C-WKOH has a rich microporous structure with fewer, smaller mesopores and robust adsorption. Conversely, while C-DKOH also shows strong adsorption, its average pore size slightly exceeds 2 nm, indicating significant mesopore production during activation, and the activation degree of C-DKOH is much lower than that of C-WKOH.
When comparing C-CD, C-V, and C-Mix, it can be seen that C-CD has a specific surface area of 807.9 m2 g−1, with more micropores, and the average pore size is only 1.86 nm. The CO2 activation process produces a significant quantity of micropores. C-V has the smallest specific surface area of 512.08 m2 g−1, and its average pore size is 2.3 nm. During the H2O activation process, pore formation and expansion lead to a larger pore size and poorer adsorption capacity. The specific surface area of C-Mix is 1214.06 m2 g−1, and its adsorption capacity is good. This suggests that the mixed gas activation process, involving pore formation by CO2 and pore expansion by H2O, results in some micropores being oxidized and expanded to mesopores.
3.2 Analysis of ionic activation
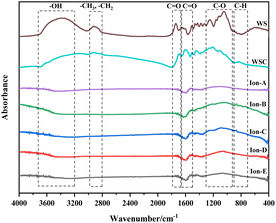
The curve fitting and analysis of Ion A–E materials were conducted using PeakFit, and the results normalised for the areas of multiple fitting peaks in the characteristic region. The analysis and comparisons are shown in Fig. 7.
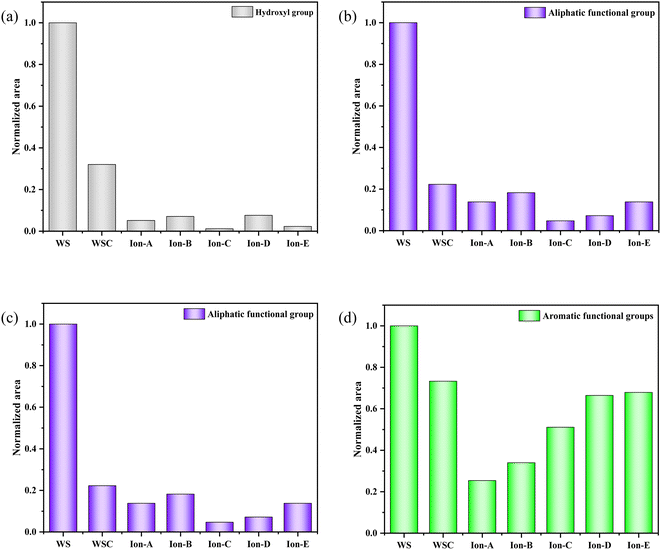 | ||
| Fig. 7 Evolution of various functional groups during ion activation in walnut shells. (a) 400–1300 cm−1. (b) 1300–2000 cm−1. (c) 2000–3000 cm−1. (d) 3000–4000 cm−1. | ||
Fig. 7(a) shows a quantitative analysis of the hydroxyl group of each sample using the FTIR spectrum. The analysis of the hydroxyl group content change during carbonisation and activation indicates a rapid decrease in the walnut shell sample with increasing temperature. A small difference in the content of the hydroxyl group is observed in the activated carbon samples Ion A–E. Hydroxyl has high reactivity, with its consumption and production processes occurring simultaneously. The primary decomposition process of hydroxyl is carbonisation. Its decline during the activation stage slows, but it is still evident. The ionic activated carbon shows a lower hydroxyl content than that of physical–chemical activated carbon, suggesting a high degree of hydroxyl decomposition. The pore structure forms as hydroxyl produces water vapor, creating a high specific surface area.
Fig. 7(b) presents a histogram of the change in aliphatic functional groups. The trend is similar to that of the hydroxyl group. The consumption of aliphatic hydrocarbons is high during the carbonisation stage, and the content of its functional group drops significantly. During activation, the change in the aliphatic functional group content is minimal, and aliphatic hydrocarbons are completely decomposed at 300–400 °C.
Fig. 7(c) shows a histogram of the change in the total quantity of oxygen-containing functional groups. As the reaction progresses, the content of oxygen-containing functional groups displays a decreasing trend. The decomposition and production reactions of oxygen-containing functional groups occur simultaneously during carbonisation and activation. The normalised area of oxygen-containing functional groups is only 0.18 during the carbonisation stage. The reaction activity at low temperatures is low, causing slow decomposition of the functional groups and production of oxygen-containing functional groups. As the activation reaction temperature increases, the reaction activity also increases, leading to a significant decrease in oxygen-containing functional groups.
Fig. 7(d) demonstrates the change in the normalised area of aromatic functional groups with the ionic activation of walnut shell. The aromatic functional groups show a decreasing trend during activation and carbonisation. However, their changes vary greatly under different activation techniques. The content of aromatic compounds is high, being the primary component of lignin and the structural backbone of the walnut shell material. The reaction of aromatic compounds will form the structural body of carbon and activated carbon. Ionic activation of walnut shell leads to the creation of activated carbon with a stable structure and a high degree of graphitisation. When compared with physical and chemical activation, ionic activated carbon exhibits a significant difference in the normalised area of aromatic hydrocarbons but is slightly superior to activated carbon created by physical and chemical activation.
| Ionic activated carbon | Specific surface area/m2 g−1 | Pore volume/cm3 g−1 | Micropore volume/cm3 g−1 | Average pore size/nm |
|---|---|---|---|---|
| Ion-A | 1302.01 | 0.67 | 0.47 | 2.14 |
| Ion-B | 1817.92 | 0.77 | 0.62 | 1.82 |
| Ion-C | 1974.04 | 1.05 | 0.83 | 2.04 |
| Ion-D | 2214.06 | 1.16 | 0.93 | 1.81 |
| Ion-E | 2007.90 | 1.04 | 0.88 | 1.93 |
As seen in Table 5, ionic activation results in a rich microporous structure, with an average pore size between 1.81 and 2.14 nm. This suggests that mesopores resulting from ionic activation are fewer and relatively smaller. The small average pore size indicates a robust adsorption capacity. The specific surface area of ionic activated carbon ranges from 1302.01 to 2214.06 m2 g−1, and the micropore volume spans from 0.47 to 0.93 cm3 g−1. Generally, these structural parameters of ionic activated carbon outperform those of carbon activated by traditional methods. Common market-available biomass-activated carbon has a specific surface area between 500 and 1700 m2 g−1.
Among all, Ion-D, prepared using a mixture of [Bmim]PF6/[Bmim]BF4 ionic liquids, demonstrates excellent structural parameters. It boasts a specific surface area of 2214.06 m2 g−1, a micropore volume of 0.93 cm3 g−1, and an average pore size of 1.81 nm. Considering its exceptional adsorption effect, low production cost, and superior adsorption performance, Ion-D can be effectively used as activated carbon for treating waste smoke and wastewater.
Fig. 8 also displays the isotherms for Ion A–E. When the relative pressure P/P0 is less than 1, the nitrogen adsorption capacity rapidly increases, signifying a microporous structure in Ion A–E. When P/P0 is more than 0.1, adsorption curves align with desorption curves, with capillary condensation observed, similar to earlier physical/chemical methods. Interestingly, no hysteresis loop is present. The analysis reveals that the physical adsorption properties of ionic activated carbon follow the order from largest to smallest: Ion-D > Ion-E > Ion-C > Ion-B > Ion-A.
The adsorption capability of Ion-D exceeds that of other ionic carbons. Furthermore, the adsorption isotherm for Ion B–E surpasses that of the optimal method used in physical/chemical activation. While Ion-A's activation effect is somewhat inferior, it is still considerably better than those achieved through general physical/chemical activation methods.
3.3 SEM analysis of activated carbon
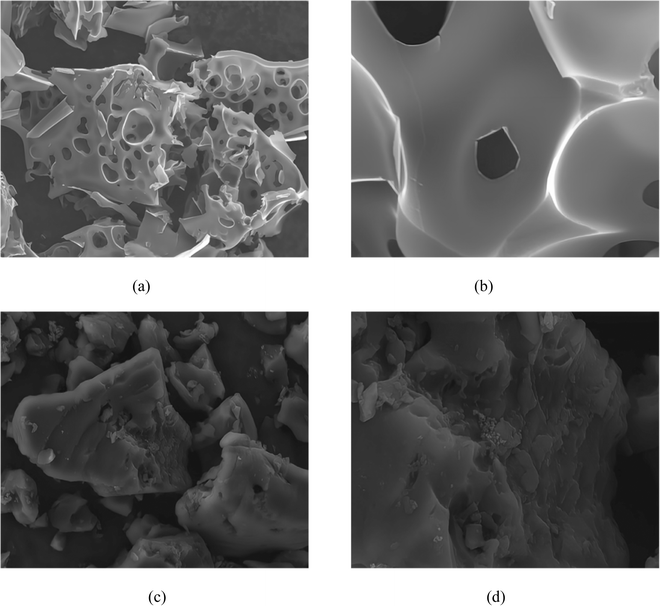
Fig. 9 showcases the surface morphology of samples produced by both conventional activation and ionic activation methods. Specifically, Fig. 9(a) and (b) correspond to carbon activated by the KOH wet method (referred to as C-WKOH), while Fig. 9(c) and (d) represent Ion-D.As observed in Fig. 9, the surface of C-WKOH exhibits a honeycomb-like structure due to etching, with a relatively rough surface hosting a large number of mesopores. Upon closer examination, a channel structure is visible on the activated carbon's surface. These channels connect to the internal microporous structure, which is found to be abundant based on pore parameter analysis, consequently contributing to a large specific surface area.
Contrarily, the surface of Ion-D appears relatively dense with fewer visible pores. Upon analysis, a considerable quantity of micropores and a minimal number of mesopores are discovered. Furthermore, a complex microporous structure is detected inside the activated carbon. Complementary BET results suggest that these mesopores, upon extending into the activated carbon, reduce in size and contribute to forming a complex micropore network structure, thereby increasing the specific surface area.
In comparison to activated carbon prepared via physical/chemical methods, ionic activated carbon showcases a denser surface with fewer mesopores yet larger micropore volume and quantity. Additional microporous structures are also found internally. This results in a larger specific surface area and superior adsorption performance, particularly towards small-molecular gas/liquid substances.
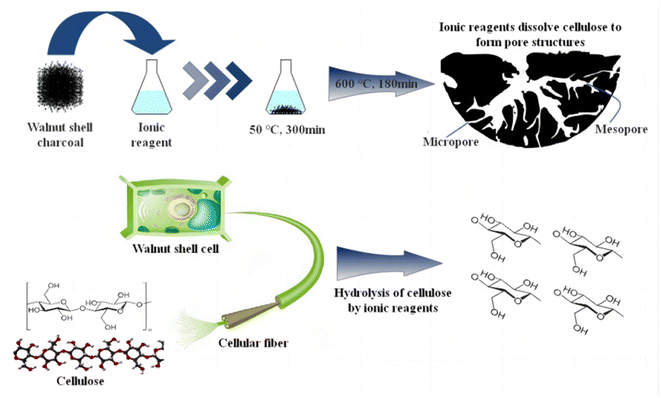
3.4 Ionic activation mechanism analysis
Fig. 10 outlines the main principles of ionic activation, which play a crucial role in the treatment of cellulose, especially in the context of walnut shell-based biomass char. This process comprises three key steps:Firstly, at room temperature, ionic reagents are capable of hydrolyzing the residual cellulose in walnut shell-based biomass char. This hydrolysis is rather comprehensive, as inferred from infrared analysis, resulting in the creation of pores and a minor quantity of glucose. Therefore, when dealing with walnut shell-based biomass, the ideal final temperature during carbonization should be approximately 324.7 °C, close to the threshold for complete cellulose decomposition. This approach permits the partial decomposition of remaining cellulose by ionic reagents, contributing to micropore formation. Selecting this temperature prevents an excessive amount of cellulose in the biomass char if the carbonization temperature is too low, which could lead to an overabundance of mesopores and macropores and even pore collapse.
Furthermore, as depicted in Fig. 7's hydroxyl decomposition analysis, ionic reagents aid in the decomposition of hydroxyl groups in walnut shell-based biomass, surpassing the degree of decomposition attainable by physical/chemical activation methods. Water vapor generated during this decomposition process assists in pore formation, leading to an increased pore count in ionic activated carbon.
Lastly, ionic reagents facilitate the decomposition and transformation of aromatic functional groups. This results in a significant portion of lignin being converted into a carbon structure. The conversion degree is high, leading to the formation of ionic activated carbon exhibiting a high graphitization degree and structural stability, and the pore structure is less likely to incur damage.
Cellulose, a vital component of walnut shells, decomposes into gas at high temperatures during physical/chemical activation. After the walnut shell undergoes low-temperature carbonization, some cellulose persists. At this juncture, the residual cellulose can be hydrolyzed by ionic reagents at 50 °C for 300 min, leading to the formation of activated carbon pores. Following this, at 600 °C for 180 min, unstable substances in the walnut shell carbon undergo decomposition or transformation into physically/chemically stable substances, yielding activated carbon that is both stable and rich in micropores.
3.5 CIP adsorption experimental results and analysis
Fig. 11(a) illustrates changes in adsorption capacity as a function of temperature, while Fig. 11(b) shows the rate of CIP solution removal at various temperatures. These figures indicate that temperature plays a significant role in the adsorption capacity of the activated carbons studied.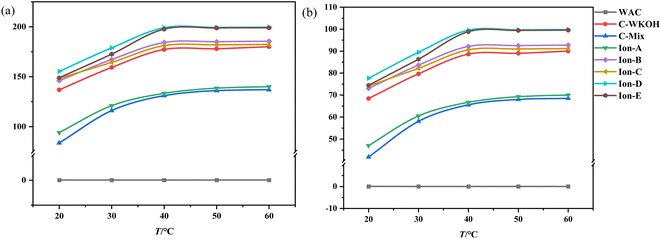 | ||
| Fig. 11 Effects of temperature on the adsorption of activated carbon. (a) Effects of temperature on the adsorption capacity. (b) Effects of temperature on the removal rate. | ||
When temperature was held constant, the adsorption capacity of WSC remained near zero. Below 40 °C, significant differences in adsorption capacity were observed between all types of activated carbon. As the temperature increased, the adsorption capacity of all except WSC increased noticeably. WSC's adsorption capacity showed minimal growth after 40 °C.
Meanwhile, the adsorption capacities of ionic activated carbons (Ion A–E) continued to rise with temperature and maintained a high level. Ion-D, in particular, consistently demonstrated the highest adsorption capacity within the studied temperature range. Between 20 °C and 40 °C, the removal rate of the CIP solution with Ion A–E was above 73%, and it was as high as 77.65% with Ion-D. The performance of the activated carbons sorted by their adsorption capacity follows this pattern: Ion-D > Ion-E > Ion-B > Ion-C > C-WKOH > Ion-A > C-Mix. This suggests that the adsorption process by activated carbons is highly influenced by temperature within the investigated range. An increase in temperature can enhance adsorption by accelerating the motion of small CIP molecules in fluid, leading to more frequent contact with WSC and subsequently increasing adsorption capacity.
In the temperature range of 40–60 °C, the adsorption capacity of activated carbon began to stabilize, and the removal rate of the CIP solution with Ion-B–E was above 90%. Remarkably, the removal rate with Ion-D or Ion-E reached up to 99.5% or 98.83%, almost completely removing the CIP solution. The removal rate with C-WKOH was 88.62%, and the performance of C-Mix or Ion-A was relatively poor. The removal rate did not increase significantly with temperature, indicating effective adsorption at 40 °C and suggesting that high temperatures causing heat loss can be avoided.
Regarding the pore structure, it is formed by etching both the surface and interior, and controlling the activation process can be challenging. The activation process can easily generate mesopores, which can impact the volume and adsorption performance of micropores. Due to the distinct activation principles, ionic activated carbon features more micropores and fewer mesopores. Thus, it can potentially be used as a new high-performance adsorbent.
3.6 Experimental results analysis of regeneration
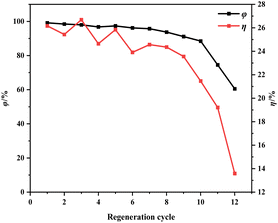 | ||
| Fig. 12 Effect of regeneration cycles on regeneration efficiency and mass loss rate of ion-activated carbon. | ||
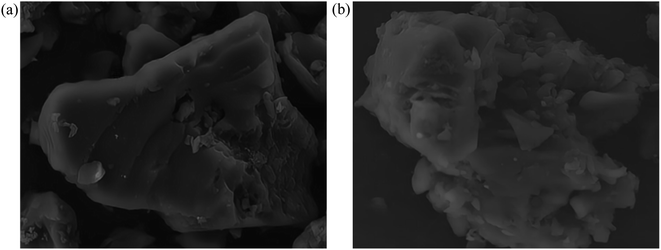
Fig. 13 shows morphological images of ion-activated carbon D before and after eleven regeneration cycles. There's a notable transformation in the surface morphology of the activated carbon. Before regeneration, the activated carbon displays a rather dense surface with visible micro-pores, pointing to a primarily intact structure. However, after eleven successive regeneration cycles, the activated carbon undergoes particle aggregation and pulverization. The surface of the activated carbon displays an increased number of larger pores and particles, resulting in a significant reduction in specific surface area, indicative of a severe loss of activity and substantial degradation of the activated carbon.
During the regeneration process of shell-based ion-activated carbon post-CIP adsorption, the residual CIP within the interstitial spaces decomposes, generating water vapor and volatile gases. These react with carbon molecules, causing surface corrosion and damage to the pore structure of the ion-activated carbon, significantly impacting its lifespan. As shown in Fig. 13, the shell-based ion-activated carbon exhibits an impressive regeneration cycle capacity of up to 10 cycles, with an initial regeneration efficiency of 98.64% and a final regeneration efficiency of 88.04%. However, during the 11th regeneration cycle, the pore structure of the ion-activated carbon collapses, while still achieving a regeneration efficiency of 74.55%.
The outstanding regenerative performance of shell-based ion-activated carbon can be attributed to its underlying mechanism. The key contributing factors to this mechanism are the use of ion reagents, which enhance the decomposition of aromatic functional groups, leading to almost complete conversion of lignin into the fixed carbon component of the activated carbon. This positive aspect results in a higher yield of activated carbon and reduces the effect of mass loss during the regeneration process. Additionally, as depicted in Fig. 7, shell-based ion-activated carbon exhibits a higher degree of graphitization and a more stable structure. This increased stability of the pore structure during the heat-driven regeneration process decreases the propensity to collapse. Consequently, even after the regeneration treatment, the regeneration efficiency of the activated carbon continues to be maintained at a high level.
4 Conclusion
This paper delves into the impact of physical/chemical/ionic activation on walnut shells and contrasts their activation mechanisms, pore structure parameters and regeneration mechanisms. The following conclusions have been deduced:(1) In the case of carbon activated via physical/chemical techniques, the wet method of activation treatment for walnut shell emerges as the most optimal choice. Given its ideal specific surface area, micropore volume, and average pore size, it is well-suited for use as an adsorbent. The mixed gas activation technique comes in second, with its physical adsorption capacity being only marginally lesser than that of wet activation.
(2) The specific surface area of the ion-activated carbon fluctuates in the range of 1302.01–2214.06 m2 g−1, and the micropore volume varies from 0.47 to 0.93 cm3 g−1. Among them, the specific surface area of Ion-D stands at 2214.06 m2 g−1, the micropore volume is 0.93 cm3 g−1, and the average pore size is 1.73 nm. It showcases an excellent adsorption effect and lower production cost.
(3) Ionic activators can generate activated carbon with a high/ultra-high specific surface area. The adsorption effect of ion-activated carbons are substantially more efficient than that of physically or chemically activated carbons. Among the materials studied, Ion-D is the best, demonstrating a consistently high CIP removal rate nearing 100% at 40 °C.
(4) The shell-based ion-activated carbon exhibits an impressive regeneration cycle capacity of up to 10 cycles, with an initial regeneration efficiency of 98.64% and a final regeneration efficiency of 88.04%.
Conflicts of interest
There are no conflicts to declare.Acknowledgements
This research was supported by National Key R&D Program of China (No. 2021YFC3001803), Key Research and Development Program of Shaanxi Province (No. 2018ZDXM-SF-033), Hubei market supervision bureau technical support project. Thanks for the support of Wang Kuancheng Foundation.References
- G. Xiao, R. Wu and H. Zhou, et al., Preparation and Characterization of Activated Carbons Based Alkali Lignin by KOH Chemical Activation, J. Combust. Sci. Technol., 2014,(8), 7–11 CAS
.
- N. E. Williams, O. A. Oba and N. P. Aydinlik, Modification, Production, and Methods of KOH-Activated Carbon, ChemBioEng Rev., 2022, 9(2), 164–189 CrossRef CAS
.
- A. Sasmita and S. D. Edward, CO adsorption performance of rubber wood activated carbon, Mater. Today, 2022, 63, 26–31 Search PubMed
.
- L. B. Zhang, J. H. Peng and H. Y. Xia, et al., Preparation of high specific surface area activated carbon from tobacco stem with potassium carbonate activation by microwave heating, J. Funct. Mater., 2018,(01), 136–138 Search PubMed
.
- H. Wolfgang and E. Klose, On the suitability of agricultural by-products for the manufacture of granular activated carbon, Fuel, 2019, 74(12), 1786–1791 Search PubMed
.
- J. F. González, S. Román and J. M. Encinar, et al., Pyrolysis of various biomass residues and char utilization for the production of activated carbons, J. Anal. Appl. Pyrolysis, 2009, 85(1–2), 134–141 CrossRef
.
- A. Magdziarz and M. Wilk, Thermal characteristics of the combustion process of biomass and sewage sludge, J. Therm. Anal. Calorim., 2018, 114(2), 142–145 Search PubMed
.
- S. Román, J. F. González and C. M. González-García, et al., Control of pore development during CO2 and steam activation of olive stones, Fuel Process. Technol., 2018, 89(8), 715–720 CrossRef
.
- S. Deng, H. Wei and T. Chen, et al., Superior CO2 adsorption on pine nut shell-derived activated carbons and the effective micropores at different temperatures, Chem. Eng. J., 2014,(08), 132–135 Search PubMed
.
- A. Alonso, V. Ruiz and C. Blanco, et al., Activated carbon produced from Sasol-Lurgi gasifier pitch and its application as electrodes in supercapacitors, Carbon, 2016,(3), 236–240 Search PubMed
.
- M. F. Yu, X. B. Hu and K. C. Wang, et al., KOH activation and preparation of high specific surface area of bamboo activated carbon research, J. Zhejiang For. Sci. Technol., 2006, 26(3), 17–20 CAS
.
- X. X. Zhang and S. C. Guo, The new technique to prepare high surface area activated carbon, J. Mater. Sci. Eng., 2016, 14(4), 4 Search PubMed
.
- F. C. Wu, R. L. Tseng and R. S. Juang, Comparisons of porous and adsorption properties of carbons activated by steam and KOH, J. Colloid Interface Sci., 2015, 283(1), 49–56 CrossRef PubMed
.
- R. S. Juang, F. C. Wu and R. L. Tseng, Characterization and use of activated carbons prepared from bagasses for liquid-phase adsorption, Colloids Surf., A, 2012, 201(1), 191–199 Search PubMed
.
- M. Bardhan, T. M. Novera and M. Tabassum, et al., Adsorption of methylene blue onto betel nut husk-based activated carbon prepared by sodium hydroxide activation process, Water Sci. Technol., 2020, 82(9), 1932–1949 CrossRef CAS PubMed
.
- J. Hayashi, T. Horikawa and I. Takeda, et al., Preparing activated carbon from various nutshells by chemical activation with K2CO3, Carbon, 2002, 40(13), 2381–2386 CrossRef CAS
.
- S. H. Kim, H. K. Shon and H. H. Ngo, Adsorption characteristics of antibiotics trimethoprim on powdered and granular activated carbon, J. Ind. Eng. Chem., 2010, 16(3), 344–349 CrossRef CAS
.
- E. Maria, M. José and V. Eulalia, et al., Comparative adsorption of ciprofloxacin on sugarcane bagasse from Ecuador and on commercial powdered activated carbon, Sci. Total Environ., 2021, 750 Search PubMed
.
- A. Pal, K. Thu and S. Mitra, et al., Study on biomass derived activated carbons for adsorptive heat pump application, Int. J. Heat Mass Transfer, 2017, 110, 7–19 CrossRef CAS
.
- A. Pal, K. Uddin and B. B. Saha, et al., A benchmark for CO2 uptake onto newly synthesized biomass-derived activated carbons, Appl. Energy, 2020, 264, 114720 CrossRef CAS
.
- B. B. Saha, K. Uddin and A. Pal, et al., Emerging sorption pairs for heat pump applications: an overview, JMST Adv., 2019, 1, 161–180 CrossRef
.
- A. Pal, H. S. Kil and S. Mitra, et al., Ethanol adsorption uptake and kinetics onto waste palm trunk and mangrove based activated carbons, Appl. Therm. Eng., 2017, 122, 389–397 CrossRef CAS
.
- D. C. Dumitrache, B. D. Schutter and A. Huesman, et al., Modeling, analysis, and simulation of a cryogenic distillation process for 13C isotope separation, J. Process Control, 2022, 22(4), 798–808 CrossRef
.
- M. Soleimani and T. Kaghazchi, Agricultural Waste Conversion to Activated Carbon by Chemical Activation with Phosphoric Acid, Chem. Eng. Technol., 2010, 30(5), 649–654 CrossRef
.
- M. Inagaki, E. Beguin and E. Frackowiak, Carbons for Electrochemical Energy Storage and Conversion Systems, CRC press, 2010, pp. 37–76 Search PubMed
.
- S. Liu, Study on adsorption of trace ethane by activated carbon with potassium hydroxide, Dalian University of Technology, 2020 Search PubMed
.
- E. Schroeder, K. Thomauske and C. Weber, et al., Experiments on the generation of activated carbon from biomass, J. Anal. Appl. Pyrolysis, 2017, 79(2), 106–111 Search PubMed
.
- S. Román, J. F. González and C. González-García, et al., Control of pore development during CO2 and steam activation of olive stones, Fuel Process. Technol., 2008, 89(8), 715–720 CrossRef
.
- J. P. Feng, M. Liu and S. Y. Jia, et al., Prrolidone acid ionic liquid efficiently catalyzes cellulose hydrolysis to produce glucose, Acta Pet. Sin., 2012, 28(05), 775–782 CAS
.
- H. P. Yang, R. Yan and H. P. Chen, et al., Characteristics of hemicellulose, cellulose and lignin pyrolysis, Fuel, 2017, 86(12), 1781–1788 Search PubMed
.
- Q. Liu, S. Wang and Y. Zheng, et al., Mechanism study of wood lignin pyrolysis by using TG-FTIR analysis, J. Anal. Appl. Pyrolysis, 2018, 82(1), 170–177 CrossRef
.
- F. M. Mei, C. C. Fu and Q. L. Yang, et al., The effect of acid functional groups of modified activated carbon on formaldehyde absorption, Environ. Pollut. Control, 2010, 32(03), 18–22 CAS
.
- P. Márquez, A. Benítez and A. F. Chica, et al., Evaluating the thermal regeneration process of massively generated granular activated carbons for their reuse in wastewater treatments plants, J. Cleaner Prod., 2022, 366, 132–139 CrossRef
.
- M. Z. M. Nasir, G. Indiran and M. A. A. Zaini, Assessment of thermal regeneration of spent commercial activated carbon for methylene blue dye removal, Part. Sci. Technol., 2020, 39(04), 503–510 Search PubMed
.
| This journal is © The Royal Society of Chemistry 2023 |

