 Open Access Article
Creative Commons Attribution 3.0 Unported Licence
The mineral manaksite, KNaMnSi4O10, as a supercapattery-type electrochemical energy storage material†
Gregarious Muungani ,
Michael N. Pillay
 and
Werner E. van Zyl
 *
*
School of Chemistry and Physics, University of KwaZulu-Natal, Westville Campus, Durban, 4000, South Africa. E-mail: vanzylw@ukzn.ac.za; Tel: +27 31 260 3199
First published on 6th September 2023
Abstract
The manaksite mineral KNaMnSi4O10 was synthesized and used to fabricate electrodes, which were investigated for electrochemical energy storage (EES) application using cyclic voltammetry (CV), galvanostatic charge and discharge (GCD), and electrochemical impedance spectroscopy (EIS). Optimum weight percentages (wt%) of electrode components were established as 10 wt% polytetrafluoroethylene (PTFE) binder, 15 wt% RuO2 and 5 wt% carbon black. RuO2 was added to improve electrical conductivity. A ratio of 13![[thin space (1/6-em)]](https://www.rsc.org/images/entities/char_2009.gif) :
:![[thin space (1/6-em)]](https://www.rsc.org/images/entities/char_2009.gif) 3 for KNaMnSi4O10
3 for KNaMnSi4O10![[thin space (1/6-em)]](https://www.rsc.org/images/entities/char_2009.gif) :
:![[thin space (1/6-em)]](https://www.rsc.org/images/entities/char_2009.gif) RuO2 was used in the fabrication of the electrode. A study of the suitable electrolyte and corresponding concentration to use was done using NaOH and KOH, both at concentrations of 1 M, 3 M and 6 M, with 3 M NaOH as the optimum electrolyte and concentration. The KNaMnSi4O10 yielded a specific capacity of 106 mA h g−1. An investigation into the energy storage mechanism from a plot of log
RuO2 was used in the fabrication of the electrode. A study of the suitable electrolyte and corresponding concentration to use was done using NaOH and KOH, both at concentrations of 1 M, 3 M and 6 M, with 3 M NaOH as the optimum electrolyte and concentration. The KNaMnSi4O10 yielded a specific capacity of 106 mA h g−1. An investigation into the energy storage mechanism from a plot of log![[thin space (1/6-em)]](https://www.rsc.org/images/entities/char_2009.gif) I(ν) vs. log
I(ν) vs. log![[thin space (1/6-em)]](https://www.rsc.org/images/entities/char_2009.gif) ν, where I is current and ν is the scan rate gave a b value parameter of 0.8; that is, in-between 0.5 obtained for a pure battery material and 1.0 for a pure capacitor material. Accordingly, KNaMnSi4O10 exhibited a battery-supercapacitor duality phenomenon consistent with supercapattery materials. The KNaMnSi4O10 electrochemical system involved both capacitive and diffusion-controlled processes and was found to have good cyclic stability. It is concluded that KNaMnSi4O10 is a potential electrochemical energy storage material.
ν, where I is current and ν is the scan rate gave a b value parameter of 0.8; that is, in-between 0.5 obtained for a pure battery material and 1.0 for a pure capacitor material. Accordingly, KNaMnSi4O10 exhibited a battery-supercapacitor duality phenomenon consistent with supercapattery materials. The KNaMnSi4O10 electrochemical system involved both capacitive and diffusion-controlled processes and was found to have good cyclic stability. It is concluded that KNaMnSi4O10 is a potential electrochemical energy storage material.
1 Introduction
The demand for sustainable energy solutions is on the rise due to increased energy consumption resulting from global population explosion, urbanization, industrialization, and advanced technological development. This occurs against the backdrop that continued overconsumption of fossil fuels as an unclean and limited resource facilitates its depletion. Clean and efficient energy storage materials were proposed to mitigate both energy demand and energy supply challenges.1–4 A prominent type of energy storage material is the electrical double layer capacitor (EDLC), which is a purely capacitive material as it stores charge electrostatically. Another type of material stores energy through redox processes. Each of these two types of energy storage materials has its pros and cons. The EDLC type of material has the advantage of high-power density, which results from fast charge storage and fast charge release since no phase transformations are involved such as those occurring through chemical reactions. On the other hand, the redox type energy storage material has a comparatively low-power density5 due to chemical reactions occurring in redox-based materials being slow compared to the electrostatic mechanism obtained in the EDLC. However, redox-type materials have a higher energy density than EDLC type materials. Besides these two traditional and opposed energy storage materials, a hybrid type material exists that exploits both the power capability of an EDLC and also the high energy storage capacity of a redox type material.6,7 This material has so-called supercapattery attributes8,9 and the need to investigate such innovative energy storage materials has emerged.10–12Both organic and inorganic materials are being explored as potential electrochemical energy storage (EES) materials. Inorganic materials, in particular phyllosilicates, were explored both in supercapacitor application13–17 and battery applications.18–24 The choice for the use of phyllosilicates is attributed to their good mechanical and chemical properties, high specific surface area, cation exchange capacity, abundance, ready availability, cost-effectiveness, and eco-friendliness. In this work, KNaMnSi4O10 (manaksite), which is a member of the litidionite group comprising KNaCuSi4O10 (litidionite), KNaFeSi4O10 (fenaksite), KNaMnSi4O10 (manaksite)25,26 and KNa[Ca(H2O)][Si4O10] (calcinaksite),27,28 was synthesized and investigated for electrochemical energy storage application. The general formula of these litidionite group minerals is AA'M[Si4O10], where A and A′ are alkali cations (K+, Na+) and M is a bivalent cation (typically a transition-metal).28 The litidionite-group minerals have a heteropolyhedral framework of infinite silicate tubes [Si8O20]8− with a hexagonal cross-section28 and they extend parallel to the a axis being connected by M2O8 dimeric units.29 The structure of these silicates is composed of continuous wall layers formed by edge-sharing octahedra and seven vertex polyhedra polyhedra30 with the tubular Si–O chains [Si8O20]8− located between the walls. The presence of large cavities in tubes is generally occupied by large low-valent cations such as K+. These attributes are crucial in achieving desirable electrochemical energy storage performance.
On the other hand, certain transition metal oxides (TMOs), which are pseudocapacitive materials such as MnO2 and RuO2 were incorporated into electrochemical energy storage (EES) materials due to their variable oxidation states31–33 to improve the energy capability of the material through faradaic charge storage. In this work, ruthenia, RuO2, was added to KNaMnSi4O10 to improve electrical conductivity and the material was investigated for electrochemical energy storage application. Though RuO2 is a metal oxide, it has metallic-type conductivity that results from its Fermi level that is positioned in the middle of a conduction-band density-of-states curve.34,35 Furthermore, RuO2 is an n-type metal since electrons are the main charge carriers, unlike Ru which is a p-type metal.36,37 RuO2 has fast charge transfer, excellent reversible redox transitions,38 wide potential window (1.2 V), high proton conductivity,35,39 and has a high specific capacitance (900–1400 F g−1), with a theoretical capacitance of 2000 F g−1.38,40,41 RuO2 was extensively studied because of its ultra-large theoretical specific capacitance40,42 and high metallic electrical conductivity (105 S cm−1), as well as excellent chemical stability at room temperature.43–45
In this work, KNaMnSi4O10 was synthesised hydrothermally and RuO2 was added to improve electrical conductivity. The KNaMnSi4O10 electrodes included 10 wt% polytetrafluoroethylene (PTFE) binder, 15 wt% RuO2 and 5 wt% carbon black. The KNaMnSi4O10 electrodes were investigated for electrochemical performance in 3 M NaOH and 3 M KOH electrolytes using a three-electrode configuration. This is the first-time electrochemical tests were conducted on KNaMnSi4O10. The KNaMnSi4O10 electrode exhibited a supercapattery phenomenon and the one electrochemically tested in NaOH had a relatively high specific capacity of 106 mA h g−1.
2 Experimental
2.1 Chemicals and materials
Sodium silicate solution (Na2O 8 wt%, SiO2 27 wt%); KOH, KCl, MnSO4·4H2O, polytetrafluoroethylene (PTFE), 1-methyl-2-pyrrolidinone (NMP), carbon black, HCl, ethanol and Ni foam (150 mm × 150 mm) were purchased from Merck and used without further purification. Copper tape was purchased from BASi and used as received.2.2 Characterisation methods
An X-ray diffractometer (Bruker AXS D8 Avance, Germany) fitted with a Cu Kα radiation source (wavelength = 0.154 nm) operating at 40 kV and 40 mA XRD was employed for powder X-ray analysis of the sample for 2θ values ranging from 5–90° at room temperature. Electrochemical studies were conducted using a Princeton Applied Research VersaSTAT 3 – Potentiostat Galvanostat. A three-electrode setup consisting of an Ag/AgCl electrode (reference electrode), working electrode (KNaMnSi4O10), and platinum wire (counter electrode) was utilized. The morphological information for KNaMnSi4O10 were established using a Transition Electron Microscopy (TEM) with a JEOL 1010 (Japan) Transmission Electron Microscope (TEM). Surface topography and composition of the samples were performed by a Zeiss Ultra Plus Field Emission Gun Scanning Electron Microscope (FEGSEM) equipped with an energy dispersive X-ray (EDX) detector (Germany). TEM imaging samples were prepared by adding them to ethanol in sonication tubes after which the sample was sonicated for 15 minutes. For SEM imaging, the samples were deposited each on a conductive carbon tape that was stuck to aluminum stubs. The samples were then coated three times with gold using a sputter coater to minimize charging during SEM imaging. The FTIR spectra of the samples were obtained using a Spectrum 100 infrared spectrometer equipped with a universal diamond crystal attenuated total reflection (ATR) accessory (PerkinElmer, USA) in the wavenumber range 380–4000 cm−1 at a resolution of 4 cm−1. The Raman spectra of the samples were obtained using a DeltaNu Advantage 532 high-performance Raman spectrometer fitted with a 532 nm solid-state frequency-doubled Nd:YAG laser that has a peak power of 200 mW and a 35 μm diameter focused beam. Its resolution ranges from 8–10 cm−1 and the spectral range from 200–3400 cm−1.2.3 Synthesis of manaksite, KNaMnSi4O10
Manaksite was synthesized hydrothermally using a Teflon-lined autoclave according to literature.25 Briefly, two aqueous solutions were prepared (i) an alkaline solution comprising sodium silicate solution (sodium and silica source), KCl, KOH, and H2O and (ii) an aqueous solution of dissolved MnSO4·4H2O. The two solutions were added together and stirred to homogeneity to give a mixture of the following molar ratio 1MnO![[thin space (1/6-em)]](https://www.rsc.org/images/entities/char_2009.gif) :
:![[thin space (1/6-em)]](https://www.rsc.org/images/entities/char_2009.gif) 5.74SiO2
5.74SiO2![[thin space (1/6-em)]](https://www.rsc.org/images/entities/char_2009.gif) :
:![[thin space (1/6-em)]](https://www.rsc.org/images/entities/char_2009.gif) 1.75Na2O
1.75Na2O![[thin space (1/6-em)]](https://www.rsc.org/images/entities/char_2009.gif) :
:![[thin space (1/6-em)]](https://www.rsc.org/images/entities/char_2009.gif) 5.87K2O
5.87K2O![[thin space (1/6-em)]](https://www.rsc.org/images/entities/char_2009.gif) :
:![[thin space (1/6-em)]](https://www.rsc.org/images/entities/char_2009.gif) 355.32H2O. The homogenous mixture was transferred into a Teflon-lined autoclave and the reaction was carried out under static hydrothermal conditions at 230 °C for 7 days.
355.32H2O. The homogenous mixture was transferred into a Teflon-lined autoclave and the reaction was carried out under static hydrothermal conditions at 230 °C for 7 days.
2.4 Fabrication of electrode and electrochemical measurements
Ni foam was used as a current collector on which the active material was loaded. First, the Ni foam (0.2 mm thick, 1 cm2 area) was cleaned by sonicating in 0.1 M HCl for 5 minutes, thrice rinsed with deionized water, sonicated in deionized water for 30 minutes, and then sonicated in ethanol for 1 h. The cleaned Ni foam was dried overnight in an oven at 110 °C after which it was loaded with the active material, KNaMNSi4O10. The KNaMnSi4O10 working electrode was fabricated in the ratio KNaMnSi4O10![[thin space (1/6-em)]](https://www.rsc.org/images/entities/char_2009.gif) :
:![[thin space (1/6-em)]](https://www.rsc.org/images/entities/char_2009.gif) RuO2
RuO2![[thin space (1/6-em)]](https://www.rsc.org/images/entities/char_2009.gif) :
:![[thin space (1/6-em)]](https://www.rsc.org/images/entities/char_2009.gif) PTFE
PTFE![[thin space (1/6-em)]](https://www.rsc.org/images/entities/char_2009.gif) :
:![[thin space (1/6-em)]](https://www.rsc.org/images/entities/char_2009.gif) CB as 36.5
CB as 36.5![[thin space (1/6-em)]](https://www.rsc.org/images/entities/char_2009.gif) :
:![[thin space (1/6-em)]](https://www.rsc.org/images/entities/char_2009.gif) 7.5
7.5![[thin space (1/6-em)]](https://www.rsc.org/images/entities/char_2009.gif) :
:![[thin space (1/6-em)]](https://www.rsc.org/images/entities/char_2009.gif) 5
5![[thin space (1/6-em)]](https://www.rsc.org/images/entities/char_2009.gif) :
:![[thin space (1/6-em)]](https://www.rsc.org/images/entities/char_2009.gif) 1. The components were mixed to homogeneity after which 1-methyl-2-pyrrolidinone (NMP) was added to make a slurry. The slurry was sonicated for 1 hour and then coated on one side of a pre-treated Ni foam, as above. The coated Ni foam was then dried overnight in an oven at 110 °C and then densified at a pressure of 0.4 MPa. Cyclic voltammetry (CV), galvanostatic charge and discharge (GCD), and electrochemical impedance spectroscopy (EIS) measurements were carried out using a conventional three-electrode configuration. The nickel foam coated with KNaMnSi4O10 as the working electrode, the platinum electrode as the counter electrode and the Ag/AgCl (1.0 M KCl) electrode served as a reference electrode. Optimization experiments of the weight percentages (wt%) of the electrode components, in particular, the PTFE binder, RuO2 and the carbon black conductive additive were done using cyclic CV, EIS, and GCD. Experiments to determine the electrolyte to use between NaOH and KOH and what concentration (1 M, 3 M or 6 M) were performed. The AC EIS measurements were performed between 1 Hz and 100 kHz.
1. The components were mixed to homogeneity after which 1-methyl-2-pyrrolidinone (NMP) was added to make a slurry. The slurry was sonicated for 1 hour and then coated on one side of a pre-treated Ni foam, as above. The coated Ni foam was then dried overnight in an oven at 110 °C and then densified at a pressure of 0.4 MPa. Cyclic voltammetry (CV), galvanostatic charge and discharge (GCD), and electrochemical impedance spectroscopy (EIS) measurements were carried out using a conventional three-electrode configuration. The nickel foam coated with KNaMnSi4O10 as the working electrode, the platinum electrode as the counter electrode and the Ag/AgCl (1.0 M KCl) electrode served as a reference electrode. Optimization experiments of the weight percentages (wt%) of the electrode components, in particular, the PTFE binder, RuO2 and the carbon black conductive additive were done using cyclic CV, EIS, and GCD. Experiments to determine the electrolyte to use between NaOH and KOH and what concentration (1 M, 3 M or 6 M) were performed. The AC EIS measurements were performed between 1 Hz and 100 kHz.
2.5 Electrochemical equations
The following equations were used to calculate specific parameters. The Scherrer equation, eqn (1)46,47
Dhkl = Kλ/(Bhkl![[thin space (1/6-em)]](https://www.rsc.org/images/entities/char_2009.gif) cos cos![[thin space (1/6-em)]](https://www.rsc.org/images/entities/char_2009.gif) θ) θ)
| (1) |
The specific capacitance from the cyclic voltammogram,  , was calculated by using the integrated voltammetric charge according to eqn (2)47
 | (2) |
Specific capacitance from the GCD was calculated using eqn (3)20
 | (3) |
3 Results and discussion
3.1 Physical characterization
The PXRD diffractogram of the synthesized KNaMnSi4O10 sample is shown in Fig. 1(a) and compared against a standard AMCSD 0019814. The diffractogram obtained matches the American Mineralogist Crystal Structure Database reference standard, AMCSD 0019814 for KNaMnSi4O10 confirming successful synthesis. The sharp peaks of the PXRD diffractograms indicate that the material is crystalline, the crystallite size was calculated from the Scherrer equation using the diffraction data for the most intense peak and was found to be 47.40 nm. The full width at half maximum (FWHM) was first determined and was obtained as 2.655 × 10⁻³ radians denoting the formation of nano-crystallite size KNaMnSi4O10, which has the potential to increase the surface area exposed for electrostatic and electrochemical energy storage. The PXRD diffractogram of the RuO2 that was added to the KNaMnSi4O10 material to improve electrical conductivity is shown in Fig. S1.†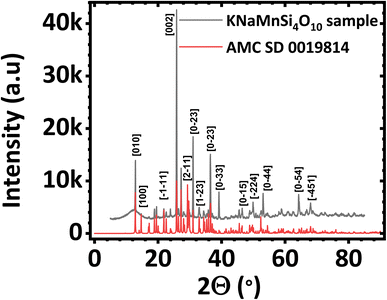 | ||
| Fig. 1 Powder X-ray diffractogram (PXRD) of (a) KNaMnSi4O10 sample compared against (b) KNaMnSi4O10 standard (AMCSD 0019814). | ||
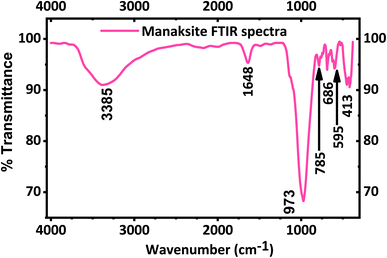
The FT-IR spectrum of KNaMnSi4O10 is shown in Fig. 2. A strong peak appears at 973 cm−1 in agreement with the literature49 and is a result of Si–O asymmetric stretching. Bands at 785, 686 and 595 cm−1 are due to Si–O bending vibrations of the tubular silicate radical Si4O10. The peaks at 452 and 416 cm−1 are due to the Na–O and K–O stretching vibrations, and Si–O bending vibrations. The band at 1638 cm−1 corresponds to H–O–H bending vibrations, as also observed for calcinaksite.28 The bands at 3340 and 3540 cm−1 correspond to weaker hydrogen bonds and, consequently, to longer O⋯O distances. Manaksite and fenaksite are regarded as anhydrous minerals, but the appearance of very weak water bands in their spectra shows the presence of minute amounts of water.27 It is also noted that KNaMnSi4O10 has some traces of water as shown by the peak at 1648 cm−1 and a broad peak around 3385 cm−1 even though the mineral is considered anhydrous. This research suggests that KNaMnSi4O10 contains traces of water, and this finding confirms other reports that KNaMnSi4O10 contains traces of water.27,28,49
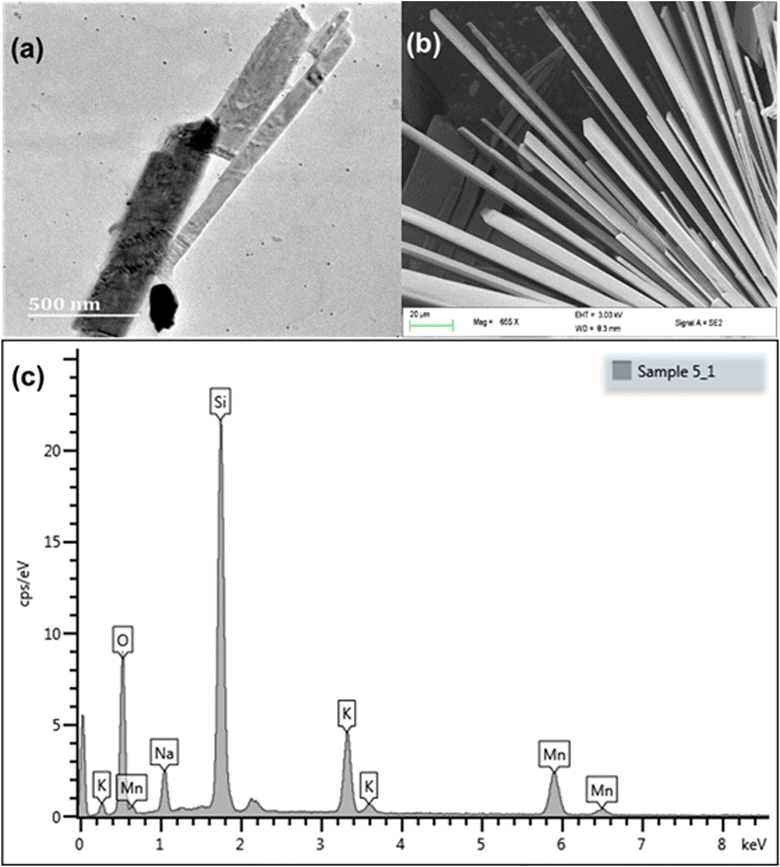
Tubes of different sizes can be seen in the TEM image, Fig. 3(a). The SEM analysis showed that KNaMnSi4O10 was both layered and tubular, Fig. 3(b). The SEM image clearly showed the hexagonal cross-section of the tubes,28,50 which was attributed to the linking of the Si-tetrahedra through common vertices. The SEM-EDX showed the constituent elements of KNaMnSi4O10, which showed the material was pure and without contamination, Fig. 3(c). The finding corroborated the X-ray diffractogram, which only showed the presence of a single phase that matched the pattern for KNaMnSi4O10 in the database. Furthermore, the elements showed up as expected from their characteristic X-rays, which are at 3.312, 1.041, 5.894, 1.739, and 0.525 keV for K, Na, Mn, Si and O, respectively, for their spectral peak Kα and 0.637 keV for Mn Lα.51 The peak at 0 keV is a noise peak associated with the electronics of the detector and is stable with the temperature of the detector. The SEM and TEM images of the RuO2 that was added to the KNaMnSi4O10 material to improve electrical conductivity are shown in Fig S2 and S3,† respectively.
3.2 Optimization of electrode components
The effect of RuO2, PTFE and carbon black on the specific capacity (Cs) of the electrode was investigated, and it was found that 10 wt% PTFE binder was optimum. It was also observed that the addition of RuO2 to KNaMnSi4O10 improved the electrochemical energy storage performance of the material. The increase in Cs of KNaMnSi4O10 with the addition of RuO2 was a result of both its electrical conductivity and high capacitance whose theoretical value is 2000 F g−1 (ref. 40 and 52) and practically around 1400 F g−1.39 Specifically, 15 wt% RuO2 had a significant effect on the capacitance of the electrode. The results on the effect of the carbon black (CB) conductive additive on the performance of the electrode are shown in Fig. 4. It was established that 5 wt% CB was optimum, and such a low weight percentage can be attributed to the presence of RuO2, which has metallic-type bonding35 and exhibits metallic conductivity.43,44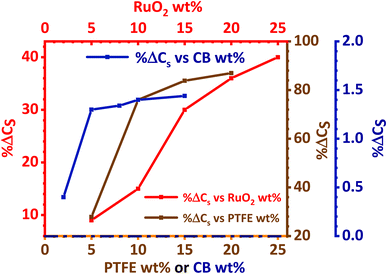 | ||
| Fig. 4 Percentage change of specific capacity (% ΔCs) with wt% variation of PTFE, RuO2 and carbon black. | ||
3.3 Effect of electrolyte
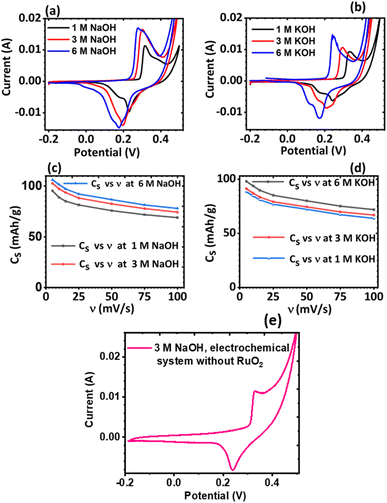
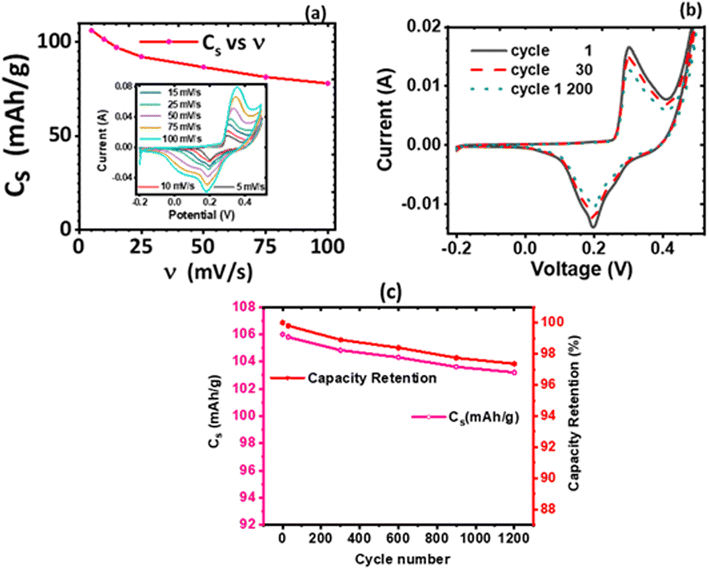
The effect of the electrolyte and scan rates on the current response and the specific capacity (Cs) of KNaMnSi4O10 was investigated and results are presented in Fig. 5. It was observed that for NaOH electrolytes of concentrations 1 M, 3 M and 6 M (Fig. 5(c)), the 3 M NaOH electrolyte was the optimum concentration. This allowed for a satisfactorily performing and cost-effective electrochemical system for electrochemical energy storage, Fig. 5(a). On the other hand, for the KOH electrolytes, comparing the peak currents obtained and the specific capacity associated with the 1 M, 3 M and 6 M KOH (Fig. 5(b) and (d)), the 6 M KOH electrolyte was the optimum electrolyte, Fig. 5(b). Furthermore, it was established that the specific capacity obtained for the 3 M NaOH, which is 106 mA h g−1, was insignificantly less than 106.4 mA h g−1 obtained for the 6 M NaOH electrochemical system. Thus, considering that by comparison 3 NaOH is more economically viable than 6 M NaOH, the 3 M NaOH electrolyte was considered optimum and this solution was therefore used as the electrolyte in subsequent experiments. In addition, the specific capacity obtained for the 3 M NaOH at 106 mA h g−1, was higher than obtained for 6 M KOH at 99.6 mA h g−1 in the electrochemical system. It was expected, however, that the KOH electrochemical system would give a higher specific capacitance than the NaOH electrochemical system owing to the smaller hydration radius of K+ at 2.32 Å, relative to Na+ at 2.76 Å, which should be favourable to a significant degree of electrosorption and increased charge density. It is plausible that the large hydration radius of Na+ could create a larger electrostatic charge area that contributed to increased charge storage.It was also noted that there was a slight current peak shift to less positive values, Fig. 5(a) and (b). This may have been a result of pH variations due to electrochemical reactions involving charge storage as proposed for possible reactions occurring in the system in Section 3.4.1. It was observed that the specific capacity decreases with an increase in scan rate though at a gradual rate, see Fig. 5(c) and (d). The cyclic voltammogram of the KNaMnSi4O10 without RuO2 electrochemical system in 3 M NaOH is shown in Fig. 5(e) and has an anodic current of comparatively small peak height compared to the KNaMnSi4O10 electrochemical system where RuO2 was added to improve conductivity. The capacitance for the KNaMnSi4O10 without RuO2 electrochemical system in 3 M NaOH was 71 mA h g−1 at 5 mV s−1 compared to 106 mA h g−1 obtained for the KNaMnSi4O10 with RuO2 electrochemical system. Therefore, despite RuO2 improving conductivity of the KNaMnSi4O10 electrode, it also contributed towards increased capacitance of the electrochemical system.
3.4 Electrochemical analysis of the optimized electrode
 and
and  , was plotted, see Fig. 6(b). The current response was normalized against peak current obtained at a scan rate of 5 mV s−1. The current response obtained as a given scan rate was swept across a potential window can be disaggregated into a current that is generated from both the slow diffusion-controlled process (idiff); and either the charge that is needed to charge the double layer at the electrode–electrolyte interface, or charge that is needed to initiate faradaic reactions (icap).55,56 The current response obeys the power law,53,57 eqn (4):
| i(ν) = icap + idiff = aνb | (4) |
log![[thin space (1/6-em)]](https://www.rsc.org/images/entities/char_2009.gif) i(ν) = log i(ν) = log![[thin space (1/6-em)]](https://www.rsc.org/images/entities/char_2009.gif) a + b a + b![[thin space (1/6-em)]](https://www.rsc.org/images/entities/char_2009.gif) log log![[thin space (1/6-em)]](https://www.rsc.org/images/entities/char_2009.gif) ν ν
| (5) |
![[thin space (1/6-em)]](https://www.rsc.org/images/entities/char_2009.gif) i(ν) vs. log
i(ν) vs. log![[thin space (1/6-em)]](https://www.rsc.org/images/entities/char_2009.gif) ν, which in this case is Fig. 6(c), is linear according to eqn (5). The slope of the plot gives the parameter b value, which elucidates the kinetics of the electrochemical reactions, classification of the material, and charge storage mechanism.56 A b value parameter of 1 is characteristic of capacitive or fast surface redox reactions58 whilst a b value parameter of 0.5 is characteristic of slow diffusion-limited faradaic processes. An electrochemical process yielding 0.5 < b < 1 represents a material or an electrochemical system of hybrid characteristics, that is both capacitive and diffusion-controlled processes are obtained to varying degrees. Such material or electrochemical system is said to have supercapattery attributes.
ν, which in this case is Fig. 6(c), is linear according to eqn (5). The slope of the plot gives the parameter b value, which elucidates the kinetics of the electrochemical reactions, classification of the material, and charge storage mechanism.56 A b value parameter of 1 is characteristic of capacitive or fast surface redox reactions58 whilst a b value parameter of 0.5 is characteristic of slow diffusion-limited faradaic processes. An electrochemical process yielding 0.5 < b < 1 represents a material or an electrochemical system of hybrid characteristics, that is both capacitive and diffusion-controlled processes are obtained to varying degrees. Such material or electrochemical system is said to have supercapattery attributes.
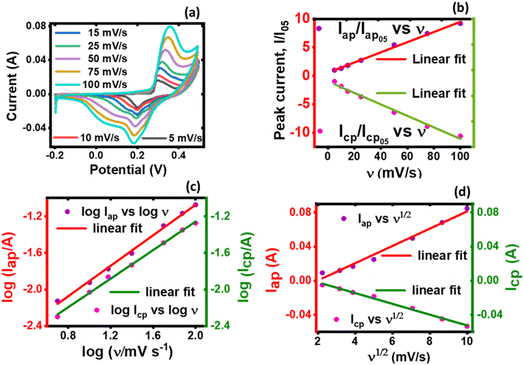 | ||
| Fig. 6 A plot of (a) current vs. potential from the CV, (b) peak current vs. normalized scan rate, (c) log peak current vs. log scan rate, and (d) log peak current vs. square-root of scan rate. | ||
Both the normalized anodic and cathodic peak current responses to the scan rate behave linearly, see Fig. 6(b). Since these linear regression lines do not superimpose each other, it reveals that the redox process obtained in the electrochemical system is not perfectly reversible, although close. This observation has also manifested in the cyclic voltammograms, Fig. 5(a) and (b), where an observable difference in the shape of their current peak curves shows coupled with the notable variance of the magnitudes of the anodic and cathodic peak values, though small. In particular, the linear regression equation for the normalized anodic peak current (Iap/Iap05) vs. ν is Iap = 0.553A + 0.0894ν where the slope is 0.0894, the intercept is 0.553, and the coefficient of correlation is 0.947. The linear regression equation of the normalized cathodic peak current Icp/Icp05 vs. ν is Icp = −0.989A − 0.1010ν where the slope is −0.1010, the intercept is −0.989, and the coefficient of correlation is 0.896. Notably, the two coefficients of correlation obtained for the anodic and cathodic peak current plots against scan rate, respectively, are high, though they exhibit some deviation from linearity. This observation implies that the parameter b value is not 1; if it was, then eqn (4) would be i(ν) = aν and i(ν) vs. ν would be perfectly linear. Consequently, further plots are needed to clarify the source of the current response obtained from the KNaMnSi4O10 electrochemical system as the voltage scan rate is swept across the potential window.
In this respect, a plot of the logarithm of the peak current, either anodic or cathodic, against the logarithm of the scan rate was performed, Fig. 6(c). As expected from the mathematical relationship, eqn (5), a linear relationship between both log![[thin space (1/6-em)]](https://www.rsc.org/images/entities/char_2009.gif) Iap and log
Iap and log![[thin space (1/6-em)]](https://www.rsc.org/images/entities/char_2009.gif) Icp vs. log
Icp vs. log![[thin space (1/6-em)]](https://www.rsc.org/images/entities/char_2009.gif) ν was obtained. A linear regression equation of the anodic processes from Fig. 6(c) was found to be log
ν was obtained. A linear regression equation of the anodic processes from Fig. 6(c) was found to be log![[thin space (1/6-em)]](https://www.rsc.org/images/entities/char_2009.gif) Iap = −2.74 + 0.833
Iap = −2.74 + 0.833![[thin space (1/6-em)]](https://www.rsc.org/images/entities/char_2009.gif) log
log![[thin space (1/6-em)]](https://www.rsc.org/images/entities/char_2009.gif) ν where the intercept is −2.74, the slope is 0.833, and the linear coefficient of correlation is 0.9964. On the other hand, the linear regression equation for the cathodic processes, from Fig. 6(c), is log
ν where the intercept is −2.74, the slope is 0.833, and the linear coefficient of correlation is 0.9964. On the other hand, the linear regression equation for the cathodic processes, from Fig. 6(c), is log![[thin space (1/6-em)]](https://www.rsc.org/images/entities/char_2009.gif) Icp = −2.82 + 0.781
Icp = −2.82 + 0.781![[thin space (1/6-em)]](https://www.rsc.org/images/entities/char_2009.gif) log
log![[thin space (1/6-em)]](https://www.rsc.org/images/entities/char_2009.gif) ν where the slope is 0.781, the intercept is −2.82 and the coefficient of correlation is 0.9986. It should be noted that the slope of the log
ν where the slope is 0.781, the intercept is −2.82 and the coefficient of correlation is 0.9986. It should be noted that the slope of the log![[thin space (1/6-em)]](https://www.rsc.org/images/entities/char_2009.gif) Iap or cp vs. log
Iap or cp vs. log![[thin space (1/6-em)]](https://www.rsc.org/images/entities/char_2009.gif) ν is the parameter b value. The |b| value for both anodic and cathodic reactions lie between 0.5 and 1.0. As explained above, such b values indicate that the material under investigation is characteristic of weighted capacitive or pseudocapacitive and battery-type electrochemical properties. The obtained |b| ≠ 1 reinforces the presence of peaks in the obtained cyclic voltammogram. Otherwise, if |b| = 1, which is ideal for capacitive double layer charging, implying that the electrochemical process is controlled by surface-dominant reactions, then a rectangular-shaped cyclic voltammogram would be expected. As alluded to earlier, the |b| value can be used to characterize materials as pseudocapacitive or battery-type materials or hybrid; that is, supercapattery type of material.
ν is the parameter b value. The |b| value for both anodic and cathodic reactions lie between 0.5 and 1.0. As explained above, such b values indicate that the material under investigation is characteristic of weighted capacitive or pseudocapacitive and battery-type electrochemical properties. The obtained |b| ≠ 1 reinforces the presence of peaks in the obtained cyclic voltammogram. Otherwise, if |b| = 1, which is ideal for capacitive double layer charging, implying that the electrochemical process is controlled by surface-dominant reactions, then a rectangular-shaped cyclic voltammogram would be expected. As alluded to earlier, the |b| value can be used to characterize materials as pseudocapacitive or battery-type materials or hybrid; that is, supercapattery type of material.
Since the electrochemical system also exhibits a semi-infinite diffusion process, a plot of Iap and Icp vs. ν1/2 was done, Fig. 6(d). When semi-infinite diffusion dominates the electrochemical system, Ip(V) ∝ ν (i.e., di/dν1/2 = constant).55,59 The two processes can be expressed mathematically through the equation, eqn (6):
| i(V) = icap + idiff = k1ν + k2ν1/2 | (6) |
| i(V)/ν1/2 = k1ν1/2 + k2 | (7) |
The linear peak currents for both anodic and cathodic peak currents varied linearly with the square root of scan rate, that is Iap or cp ∝ ν1/2 as shown in Fig. 6(d). The linear regression of the response of the anodic peak current to the scan rate that was swept across the voltage window is Iap = −0.01984 + 0.0101ν1/2 where the intercept is −0.01984, the slope is 0.0101, and the coefficient of correlation r is 0.9821. Similarly, the linear regression for the response of the cathodic peak to scan is Icp = 0.01078 + 0.00631ν1/2 where the intercept is, the slope is 0.00631 A V1/2 s−1/2 and the coefficient of correlation is 0.9930.
It was observed that the linear fit of both relations; that is, the anode and cathode peak currents to the square root of the scan rate shows a linear variation to a significant extent, which suggests that the electrode materials participated in redox reactions that were quasi-reversible and of a diffusion-controlled process.60 But a deviation is seen, especially with the peak anodic currents to the square root of the scan rate. This points to the existence of another source of current obtainable in the electrochemical environment that is different from the semi-infinite diffusion process, which Iap or cp ∝ ν1/2 explores, and the presence of a capacitive charge process is observed. This is contributed to RuO2 which is known to have a pseudocapacitive behavior61 whilst KNaMnSi4O10 dominates the semi-infinite diffusion process. The current response varies with ν1/2 in the case of a reaction that is limited by semi-infinite linear diffusion whilst for a capacitive (surface-controlled) process, the current varies directly with v.
The anodic peak at 0.24 V corresponds to reaction,
| Ni + 2OH− → Ni(OH)2 + 2e−, |
| Ni(OH)2 + OH− ↔ NiOOH + H2O + e−.62 |
Nickel foam thus contributes to the specific capacitance of the electrode though to a small extent noting the small peak obtained for the CV of Ni foam and of KNaMnSi4O10 without RuO2 compared to that of KNaMnSi4O10 with RuO2. The capacitance of KNaMnSi4O10 with RuO2 arises from the pseudocapacitance contribution from RuO2 through a faradaic reaction,
| RuO2 + δH+ + δe− ↔ RuO2−δ(OH)δ (1 ≥ δ ≥ 0).63 |
The contribution of RuO2 to the specific capacitance (Cs) of 106 mA h g−1 for the KNaMnSi4O10 with RuO2 was found to be 32.5% suggesting that it contributed 34.45 mA h g−1.
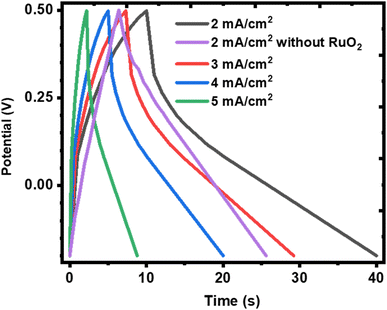
It is also observed that the charge and discharge curves have shapes that deviate from a near perfect triangle as expected of EDLC or pseudocapacitors with surface redox reactions but resembles a pseudocapacitor with intercalation65 and closely depicts supercapattery material.8 This shows that the KNaMnSi4O10 electrode is not purely capacitive since the charge and discharge segments of the plots deviate from linearity. This finding confirms the observation already established above from this work that the KNaMnSi4O10 electrode presents supercapattery attributes, which draw from those of pure capacitive materials and battery material giving it a battery-supercapacitor duality, indicating that the involvement of faradaic reactions is involved.66 Also seen from the charge and discharge curves is that the plots do not exhibit a notable iR drop at the apex at the onset of the discharge process. This reveals that the internal resistance of the KNaMnSi4O10 electrode is low, which is preferable. It is also observed that the GCD curves resemble more a capacitor on charging and a battery on discharging, which shows some slight variation with what is described for materials with a b value parameter between 0.5 and 1. This suggests that there may be subtle variations or sub-categories of materials that are grouped in the aforementioned b value parameter range and yet shows different electrochemical behaviour.
 . Furthermore, an investigation of the cyclic performance of KNaMnSi4O10 electrode was carried out, and the results obtained are shown in Fig. 8(b). The current response of KNaMnSi4O10 electrode decreased to a trivial extent after 1200 cycles, Fig. 8(b), with a downward variation of 2.6% as illustrated on Fig. 8(c), which shows capacity retention vs. cycle number. The relatively small downward variation of specific capacitance as the cycle number increases demonstrated that the KNaMnSi4O10 electrode had an appreciable extent of cyclic stability; Fig. 8(c) also shows capacity retention vs. specific capacitance at 5 mV s−1. As confirmed by capacity retention, the KNaMnSi4O10 electrode has an appreciable cyclic stability.
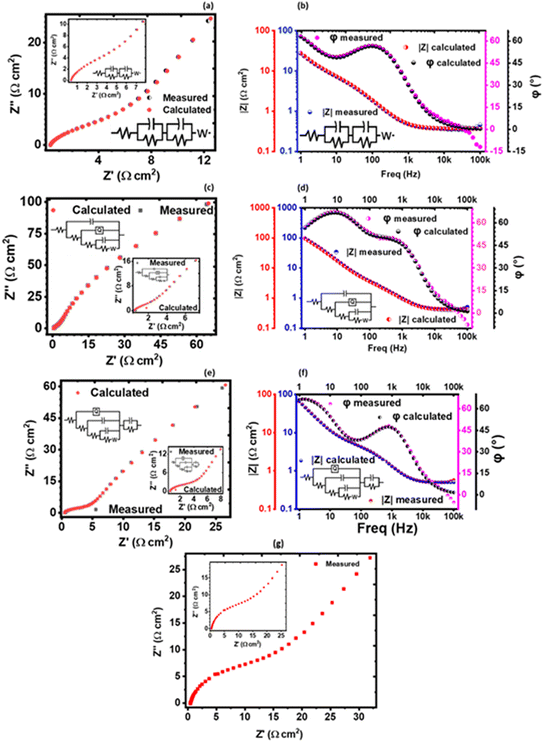
The solution resistance (RS), which is the non-zero intercept of the Nyquist plot to the Z′ axis; that is, the real impedance axis72 was determined to be 0.449, 0.496, and 0.571 Ω cm2 for 1 M, 3 M and 6 M NaOH electrolyte, respectively. In this work, the solution resistance comprises the internal resistance of the active material (the KNaMnSi4O10 electrode) and the ionic resistance of the electrolyte (NaOH), and the contact resistance obtained at the active material/current collector interface.73–75 The relatively low values obtained for both the RS and RCT are attributed to the excellent conductivity of RuO2 and also the penetration ability of the electrolyte ions. A smaller the RS value implies close to perfect reversibility of the process taking place at the electrode/electrolyte solution interface.
The Warburg impedance (W), which is the slope of the line on the Nyquist plot that meets Z′ at 45° was also established. In particular, the Warburg resistance for the KNaMnSi4O10 electrode in 1 M, 3 M, and 6 M NaOH electrolytes was found to be 3.55 Ω cm2, 1.43 Ω cm2 and 3.59 Ω cm2 as shown in Fig. 10 where all the plots are presented on the same graph for comparison. The Warburg impedance is a parameter that demarcates the transition from high to low frequency76 and results from the frequency dependence of ion diffusion/transport in the electrolyte to the electrode surface.77 It was observed that the Warburg impedance obtained in for the 3 M NaOH electrochemical system was lower than the others, and confirmed the initial finding that the 3 M NaOH electrolyte was the optimum. Also noted from the Bode plots, Fig. 9(b), (d) and (f) was that the impedance of the KNaMnSi4O10 electrode in 1 M, 3 M, and 6 M NaOH was similar at high-frequency region.
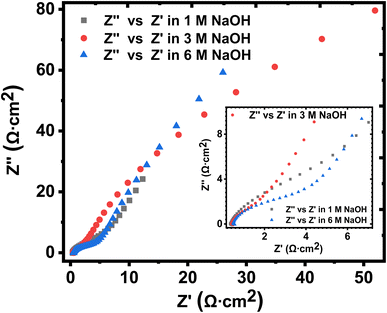 | ||
| Fig. 10 Nyquist plots for the KNaMnSi4O10 electrode in 1 M, 3 M and 6 M NaOH, respectively, drawn on the same axes for comparison. | ||
A plot of phase angle, φ, as a function of frequency, the Bode plot was also done to further characterize the KNaMnSi4O10 electrode in terms of the charge storage mechanism. It was established that the KNaMnSi4O10 electrode had a phase angle of 57°, 67.5° and 48° in 1 M, 3 M and 6 M NaOH electrochemical system, respectively. The 3 M NaOH has the highest phase angle, which value is set at about 3/4 of an ideal capacitor whose phase angle is 90°. This finding corroborates the results from the log![[thin space (1/6-em)]](https://www.rsc.org/images/entities/char_2009.gif) I vs. log
I vs. log![[thin space (1/6-em)]](https://www.rsc.org/images/entities/char_2009.gif) ν plot, Fig. 6(b), that showed the KNaMnSi4O10 electrode is not purely capacitive but also exhibits some redox properties, which affords its supercapattery properties. It was also observed, Fig. 9(d), that the modelled equivalence circuit for the KNaMnSi4O10 electrode in the 1 M, 3 M, and 6 M NaOH electrolyte had a close match to the measured plot.
ν plot, Fig. 6(b), that showed the KNaMnSi4O10 electrode is not purely capacitive but also exhibits some redox properties, which affords its supercapattery properties. It was also observed, Fig. 9(d), that the modelled equivalence circuit for the KNaMnSi4O10 electrode in the 1 M, 3 M, and 6 M NaOH electrolyte had a close match to the measured plot.
The obtained EIS results that gave the Nyquist and Bode plots were modelled to give equivalent model circuits (ECs) for the KNaMnSi4O10 electrochemical system in 1 M, 3 M, and 6 M NaOH electrolytes as shown in Fig. 9. It was observed that all the circuits show Warburg resistance, whose implications were aforementioned. The modelled equivalent circuits were appreciably close to the measured value with most parameters having a standard deviation (σ) from the measured values that were <10%. In particular, the KNaMnSi4O10 electrode in 3 M NaOH, which was the optimum electrochemical system, had an equivalence circuit involving a constant phase element (CPE). A CPE originates from internal factors such as intercalation/deintercalation, active diffusion, homogeneity disorder in an electrode–electrolyte interface, relaxation time distribution, and most decisively nature and porosity of the as-synthesized electrode.78
4 Conclusions
KNaMnSi4O10 was synthesized by a hydrothermal method. The NaOH electrolyte performed comparatively better than KOH in the application of the KNaMnSi4O10 electrode for electrochemical energy storage. For the 3 M NaOH and the 6 M KOH electrolytes, the specific capacity for the two electrochemical systems was almost the same, but with cost considerations, the 3 M NaOH electrolyte was found to be the optimum and more cost-effective electrolyte. The optimum weight percentages (wt%) for the electrode components were found to be 10 wt% PTFE binder, 5 wt% carbon black conductive additive, and 15 wt% for RuO2. The KNaMnSi4O10 electrode in 3 M NaOH electrolyte gave a specific capacity of 106 mA h g−1. Plots from the power law formula revealed that the KNaMnSi4O10 electrode had a parameter b value of 0.833 and 0.781 when characterized using the anodic and cathodic electrochemical process, respectively. Noteworthy is that both anodic and cathodic processes derived parameter b value lies between 0.5 and 1, that is 0.5 < b < 1. This indicated that the KNaMnSi4O10 electrode had properties that encompass both capacitive materials (b = 1) and battery-type materials (b = 0.5), i.e. a battery-supercapacitor duality phenomenon. Hence, the KNaMnSi4O10 electrochemical system is comprised of both capacitive charging and diffusion-limited processes, which gives the KNaMnSi4O10 electrode supercapattery attributes. Further investigations on different types of electrolyte and transition-metal oxides on the specific capacitance of KNaMnSi4O10 and other members of the litidionite series is required to further leverage better fabrication of electrochemical storage materials.Author contributions
Gregarious Muungani: conceptualization, data analysis, methodology, experimental investigation, writing first draft; Michael N. Pillay: conceptualization, data collection; Werner E. van Zyl: conceptualization, supervision, research funding, final editing.Conflicts of interest
The authors declare no conflict of interest.Acknowledgements
We thank the School of Chemistry and Physics, University of KwaZulu-Natal (UKZN), South Africa, for financial support and facilities, and the research supported by the Eskom TESP Program (P677), and in part by the National Research Foundation of South Africa (Grant number: 132014).References
- B. K. Kim, S. Sy, A. Yu and J. Zhang, in Handbook of Clean Energy Systems, John Wiley & Sons, Ltd, 2015, pp. 1–25 Search PubMed.
- R. B. Marichi, V. Sahu, R. K. Sharma and G. Singh, in Handbook of Ecomaterials, Springer International Publishing, Cham, 2018, pp. 1–26 Search PubMed.
- D. Mohapatra, O. Muhammad, M. S. Sayed, S. Parida and J.-J. Shim, Electrochim. Acta, 2020, 331, 135363 CrossRef CAS.
- P. Simon and Y. Gogotsi, in Nanoscience And Technology: A Collection of Reviews from Nature Journals, World Scientific, 2010, pp. 320–329 Search PubMed.
- P. Lu, D. Xue, H. Yang and Y. Liu, Int. J. Smart Nano Mater., 2013, 4, 2–26 CrossRef CAS.
- A. A. Alguail, A. H. Al-Eggiely and B. N. Grgur, J. Saudi Chem. Soc., 2017, 21, 575–582 CrossRef CAS.
- L. Yu and G. Z. Chen, J. Power Sources, 2016, 326, 604–612 CrossRef CAS.
- G. Z. Chen, Int. Mater. Rev., 2017, 62, 173–202 CrossRef CAS.
- L. Guan, L. Yu and G. Z. Chen, Electrochim. Acta, 2016, 206, 464–478 CrossRef CAS.
- Y. Tang, Z. Liu, W. Guo, T. Chen, Y. Qiao, S. Mu, Y. Zhao and F. Gao, Electrochim. Acta, 2016, 190, 118–125 CrossRef CAS.
- H. N. Jia, J. H. Lin, Y. L. Liu, S. L. Chen, Y. F. Cai, J. L. Qi, J. C. Feng and W. D. Fei, J. Mater. Chem. A, 2017, 5, 10678–10686 RSC.
- Y. Yan, P. Gu, S. Zheng, M. Zheng, H. Pang and H. Xue, J. Mater. Chem. A, 2016, 4, 19078–19085 RSC.
- R. Oraon, A. De Adhikari, S. K. Tiwari and G. C. Nayak, ACS Sustain. Chem. Eng., 2016, 4, 1392–1403 CrossRef CAS.
- R. Oraon, A. De Adhikari, S. K. Tiwari and G. C. Nayak, ChemistrySelect, 2017, 2, 8807–8817 CrossRef CAS.
- R. Oraon, A. De Adhikari, S. K. Tiwari and G. C. Nayak, Dalton Trans., 2016, 45, 9113–9126 RSC.
- M. Fatnassi, C. H. Solterbeck and M. Es-Souni, RSC Adv., 2014, 4, 46976–46979 RSC.
- M. Fatnassi and M. Es-Souni, RSC Adv., 2015, 5, 21550–21557 RSC.
- Y. M. Jeon, S. Kim, M. Lee, W. B. Lee and J. H. Park, Adv. Energy Mater., 2020, 10, 2003114 CrossRef CAS.
- X. Q. Zhang, W. C. Li, B. He, D. Yan, S. Xu, Y. Cao and A. H. Lu, J. Mater. Chem. A, 2018, 6, 1397–1402 RSC.
- W. Zhang, Z. Ren, Z. Ying, X. Liu and H. Wan, J. Alloys Compd., 2018, 743, 44–51 CrossRef CAS.
- S. Sasikala, G. Rambabu, A. Shukla, N. Nagaraju and S. D. Bhat, J. Electrochem. Soc., 2018, 165, F1358–F1368 CrossRef CAS.
- R. Prasanth, N. Shubha, H. H. Hng and M. Srinivasan, Eur. Polym. J., 2013, 49, 307–318 CrossRef CAS.
- M. L. Para, D. Versaci, J. Amici, M. F. Caballero, M. V. Cozzarin, C. Francia, S. Bodoardo and M. Gamba, J. Electroanal. Chem., 2021, 880, 114876 CrossRef CAS.
- Q. Zhu, X. Wang and J. D. Miller, ACS Appl. Mater. Interfaces, 2019, 11, 8954–8960 CrossRef CAS.
- P. Brandão, J. Rocha, M. S. Reis, A. M. dos Santos and R. Jin, J. Solid State Chem., 2009, 182, 253–258 CrossRef.
- A. P. Khomyakov, T. A. Kurova and G. N. Nechelyustov, Zapiski RMO, 1992, 121, 112–115 CAS.
- N. V Chukanov, S. M. Aksenov, R. K. Rastsvetaeva, G. Blass, D. A. Varlamov, I. V Pekov, D. I. Belakovskiy and V. V Gurzhiy, Mineral. Petrol., 2015, 109, 397–404 CrossRef.
- S. M. Aksenov, R. K. Rastsvetaeva, N. V Chukanov and U. Kolitsch, Acta Crystallogr., Sect. B: Struct. Sci., Cryst. Eng. Mater., 2014, 70, 768–775 CrossRef CAS PubMed.
- M. Cadoni and G. Ferraris, Rend. Lincei Sci. Fis. Nat., 2011, 22, 225–234 CrossRef.
- I. V. Rozhdestvenskaya and S. V. Krivovichev, Crystallogr. Rep., 2011, 56, 1007–1018 CrossRef CAS.
- V. Augustyn, P. Simon and B. Dunn, Energy Environ. Sci., 2014, 7, 1597 RSC.
- V. Subramanian, S. C. Hall, P. H. Smith and B. Rambabu, in Solid State Ionics, Elsevier, 2004, vol. 175, pp. 511–515 Search PubMed.
- W. Wei, X. Cui, W. Chen and D. G. Ivey, Chem. Soc. Rev., 2011, 40, 1697–1721 RSC.
- L. F. Mattheiss, Phys. Rev. B: Solid State, 1976, 13, 2433–2450 CrossRef CAS.
- C. Yuan, L. Hou, D. Li, L. Yang and J. Li, Int. J. Electrochem., 2012, 2012, 1–7 CrossRef.
- L. F. Mattheiss, Phys. Rev. B: Solid State, 1976, 13, 2433–2450 CrossRef CAS.
- K. M. Glassford and J. R. Chelikowsky, Phys. Rev. B: Condens. Matter Mater. Phys., 1993, 47, 1732–1741 CrossRef CAS.
- C.-C. Hu, W.-C. Chen and K.-H. Chang, J. Electrochem. Soc., 2004, 151, A281 CrossRef CAS.
- Y. Zhang and S. J. Park, Carbon, 2017, 122, 287–297 CrossRef CAS.
- R. K. Das, B. Liu, J. R. Reynolds and A. G. Rinzler, Nano Lett., 2009, 9, 677–683 CrossRef CAS PubMed.
- C. C. Hu, K. H. Chang, M. C. Lin and Y. T. Wu, Nano Lett., 2006, 6, 2690–2695 CrossRef CAS PubMed.
- N. Soin, S. S. Roy, S. K. Mitra, T. Thundat and J. A. McLaughlin, J. Mater. Chem., 2012, 22, 14944–14950 RSC.
- J. Zhang, J. Jiang, H. Li and X. S. Zhao, Energy Environ. Sci., 2011, 4, 4009 RSC.
- J. Wen and Z. Zhou, Mater. Chem. Phys., 2006, 98, 442–446 CrossRef CAS.
- W. E. Van Zyl, L. Winnubst, T. P. Raming, R. Schmuhl and H. Verweij, J. Mater. Chem., 2002, 12, 708–713 RSC.
- U. Holzwarth and N. Gibson, Nat. Nanotechnol., 2011, 6, 534–534 CrossRef CAS.
- P. Scherrer, Math. Phys., 1918, 2, 98–100 Search PubMed.
- H. P. Klug and L. E. Alexander, X-Ray Diffraction Procedures: For Polycrystalline and Amorphous Materials, New York, 1974, 2nd edn, pp. 1–992 Search PubMed.
- N. V Chukanov, Infrared spectra of mineral species, Springer Netherlands, Dordrecht, 2014 Search PubMed.
- O. Karimova and P. C. Burns, in Minerals as Advanced Materials I, Springer Berlin Heidelberg, Berlin, Heidelberg, 2008, pp. 153–156 Search PubMed.
- J. R. Rumble, T. J. Bruno and M. J. Doa, CRC Handbook of Chemistry and Physics: A ready-reference book of chemical and physical data, CRC Press/Taylor & Francis Group, Boca Raton, 2021 Search PubMed.
- G. Q. Zhang, Y. Q. Zhao, F. Tao and H. L. Li, J. Power Sources, 2006, 161, 723–729 CrossRef CAS.
- V. Augustyn, J. Come, M. A. Lowe, J. W. Kim, P. L. Taberna, S. H. Tolbert, H. D. Abruña, P. Simon and B. Dunn, Nat. Mater., 2013, 12, 518–522 CrossRef CAS.
- Y. Jiang and J. Liu, Energy Environ. Mater., 2019, 2, 30–37 CrossRef.
- D. M. MacArthur, J. Electrochem. Soc., 1970, 117, 729 CrossRef.
- J. Liu, J. Wang, C. Xu, H. Jiang, C. Li, L. Zhang, J. Lin and Z. X. Shen, Adv. Sci., 2018, 5, 1700322 CrossRef PubMed.
- V. Kumar, S. Matz, D. Hoogestraat, V. Bhavanasi, K. Parida, K. Al-Shamery and P. S. Lee, Adv. Mater., 2016, 28, 6966–6975 CrossRef CAS PubMed.
- H. Lindström, S. Södergren, A. Solbrand, H. Rensmo, J. Hjelm, A. Hagfeldt and S. E. Lindquist, J. Phys. Chem. B, 1997, 101, 7717–7722 CrossRef.
- T. -C. Liu, W. G. Pell, B. E. Conway and S. L. Roberson, J. Electrochem. Soc., 1998, 145, 1882–1888 CrossRef CAS.
- Z. Zhang, Y. Liu, Z. Huang, L. Ren, X. Qi, X. Wei and J. Zhong, Phys. Chem. Chem. Phys., 2015, 17, 20795–20804 RSC.
- H. Xia, Y. Shirley Meng, G. Yuan, C. Cui and L. Lu, Electrochem. Solid-State Lett., 2012, 15, A60 CrossRef CAS.
- K. Chen and D. Xue, J. Nanoeng. Nanomanuf., 2014, 4, 50–55 CrossRef CAS.
- R. B. Rakhi, W. Chen, M. N. Hedhili, D. Cha and H. N. Alshareef, ACS Appl. Mater. Interfaces, 2014, 6, 4196–4206 CrossRef CAS.
- J. Di, X. Fu, H. Zheng and Y. Jia, J. Nanopart. Res., 2015, 17, 255 CrossRef.
- Y. Gogotsi and R. M. Penner, ACS Nano, 2018, 12, 2081–2083 CrossRef CAS PubMed.
- B. Pandit, G. K. Sharma and B. R. Sankapal, J. Colloid Interface Sci., 2017, 505, 1011–1017 CrossRef CAS PubMed.
- B. Pandit, S. S. Karade and B. R. Sankapal, ACS Appl. Mater. Interfaces, 2017, 9, 44880–44891 CrossRef CAS PubMed.
- S. A. Pande, B. Pandit and B. R. Sankapal, Mater. Lett., 2017, 209, 97–101 CrossRef CAS.
- J. Zhang and X. S. Zhao, ChemSusChem, 2012, 5, 818–841 CrossRef CAS PubMed.
- S. Pande, B. Pandit and B. Sankapal, Mater. Lett., 2017, 209, 97–101 CrossRef CAS.
- J. Yan, T. Wei, B. Shao, F. Ma, Z. Fan, M. Zhang, C. Zheng, Y. Shang, W. Qian and F. Wei, Carbon, 2010, 48, 1731–1737 CrossRef CAS.
- B. Pandit, D. P. Dubal and B. R. Sankapal, Electrochim. Acta, 2017, 242, 382–389 CrossRef CAS.
- B. Pandit, S. R. Dhakate, B. P. Singh and B. R. Sankapal, Electrochim. Acta, 2017, 249, 395–403 CrossRef CAS.
- B. R. Sankapal, H. B. Gajare, S. S. Karade, R. R. Salunkhe and D. P. Dubal, Electrochim. Acta, 2016, 192, 377–384 CrossRef CAS.
- J. Yan, T. Wei, B. Shao, F. Ma, Z. Fan, M. Zhang, C. Zheng, Y. Shang, W. Qian and F. Wei, Carbon, 2010, 48, 1731–1737 CrossRef CAS.
- S. S. Karade, P. Dwivedi, S. Majumder, B. Pandit and B. R. Sankapal, Sustainable Energy Fuels, 2017, 1, 1366–1375 RSC.
- M. D. Stoller, S. Park, Y. Zhu, J. An and R. S. Ruoff, Nano Lett., 2008, 8, 3498–3502 CrossRef CAS PubMed.
- B. Pandit, L. K. Bommineedi and B. R. Sankapal, J. Energy Chem., 2019, 31, 79–88 CrossRef.
Footnote |
| † Electronic supplementary information (ESI) available. See DOI: https://doi.org/10.1039/d3ra03629d |
| This journal is © The Royal Society of Chemistry 2023 |

