 Open Access Article
Tailoring two white chromatographic platforms for simultaneous estimation of ritonavir-boosted nirmatrelvir in their novel pills: degradation, validation, and environmental impact studies†
Haydi S. Elbordiny *a,
Nourah Z. Alzoman
 b,
Hadir M. Maher
 c and
Sara I. Aborasc
aPharmaceutical Chemistry Department, Faculty of Pharmacy, Damanhour University, Damanhour, Egypt. E-mail: haydi.elbordiny@pharm.dmu.edu.eg
bCollege of Pharmacy, Department of Pharmaceutical Chemistry, King Saud University, P.O. Box 22452, Riyadh, 11495, Saudi Arabia
cPharmaceutical Analytical Chemistry Department, Faculty of Pharmacy, Alexandria University, Alexandria, Egypt
First published on 6th September 2023
Abstract
As the COVID-19 pandemic is not yet over, Pfizer has launched the novel pill Paxlovid® (Nirmatrelvir (NMV) co-packaged with ritonavir (RIT)) as an effective medication for hospitalized and non-hospitalized patients. Making pharmaceutical analysis greener and more sustainable has lately become the main direction of the research community. In this context, two fast, green, and stability-indicating chromatographic methods were designed for the neat quantitative determination of NMV and RIT in their bulk and dosage forms. Method I is deemed the first electro-driven attempt for the assay of Paxlovid®. Herein, the optimized conditions of the Micellar Electrokinetic Chromatographic (MEKC) method were 50 mM borate buffer at pH 9.2 with 25 mM sodium lauryl sulfate (SDS) being used as the background electrolyte (BGE) on a deactivated fused silica capillary (50 cm effective length × 50 μm id). Method II was an isocratic reversed-phase HPLC separation method using Zorbax-Eclipse C18 (4.6 × 250 mm, 5 μm particle size) column and 50 mM ammonium acetate buffer at pH 5 and acetonitrile as mobile phase constituents at a flow rate of 1 mL min−1. For the sake of simplicity and increasing sensitivity, a single wavelength of 210 nm was used for the two methods to assay both drugs. Linear correlations between peak areas and concentration were observed in the ranges of 10–200 μg mL−1 for NMV and 5–100 μg mL−1 RIT in both methods. The impact of versatile stress conditions such as hydrolysis, oxidation, and photolysis on the stability of NMV and RIT was studied. Fortunately, both methodologies were able to separate both drugs from their degradants. Thus, the stability indicating power of the methods was proved. The derived methods were statistically validated in agreement with the ICH guidelines. Furthermore, the environmental friendliness and sustainability of these methods were investigated and compared with the cited methods using the holistic multicriteria evaluation tools namely Hexagon, AGREE, and RGB12 metrics. Conclusively, the proposed methods offered reliable, feasible, economic, white, and stability-indicating alternatives to the cited chromatographic methods.
1 Introduction
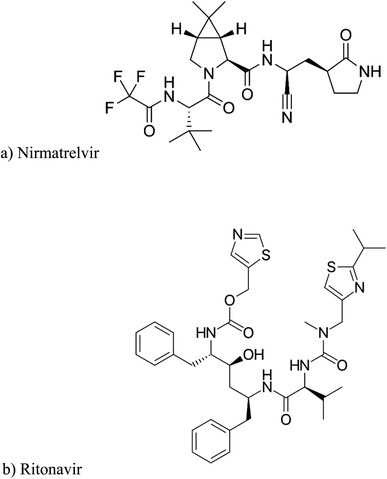
Since 2019, the severe acute respiratory syndrome coronavirus 2 (SARS-CoV-2) has spread as the global respiratory outbreak COVID-19. Ranging from no symptoms at all to moderate symptoms to severe hypoxia, multiorgan failure, and even death, the SARS-CoV-2 pandemic has caused 6.7 million deaths as of the end of December 2022. After two years of the pandemic, COVID-19 is still considered a global threat due to the continuous development of different variants. After the SARSCoV-2 variations of concern (VOCs) alpha, beta, gamma, and delta, the most recent B.1.1.529 variant (called Omicron), which was categorized as a VOC by the WHO on 26 November 2021, emerged as a fresh threat globally.1–5Hitherto, numerous novel medications have been studied or authorized to tackle COVID-19 in addition to vaccinations. The highlights of 2022 were the first announcement of Paxlovid® (Nirmatrelvir co-packaged with Ritonavir), Fig. 1, as an efficient and secure oral antiviral medication developed by Pfizer, at the dawn of 2022. Nirmatrelvir (NMV) is an antiviral medication that specifically targets the 3-chymotrypsin-like cysteine protease enzyme found in SARS-CoV-2. Across a variety of coronaviruses, NMV efficiently inhibits enzymatic activity, which in turn prevents virus growth. Since ritonavir (RIT) is a CYP3A4 inhibitor, it has been discovered that coadministration of 300 mg NMV and a low dose (100 mg) of the pharmacokinetic enhancer RIT twice daily improves NMV pharmacokinetics (1, 6). NMV/RIT offers the most encouraging and potent therapeutic result with an 89% decrease in the risk of hospitalization or death within five days after the beginning of symptoms. Moreover, it can potentially be used by outpatients in addition to hospitalized patients because of its strong oral availability. It has been anticipated that NMV and RIT will alter the COVID-19 pandemic's trajectory.1,6,7
By the end of 2022, the main event was the 27th Conference of the Parties to the United Nations Framework Convention on Climate Change (COP 27) held in Egypt, which focused on how to deal with all aspects of pollution and global warming.8 This act is intended to motivate everyone in their place to think green and encourages recycling and pollution reduction. Moreover, the implementation of the concept of preventing rather than controlling the resulting hazards increased and thus there is a worldwide direction toward green chemistry and sustainability. Undoubtedly, the design of Earth-friendly analytical methods implies substantial improvement in the quality and validity of results, fostering working staff safety and health, reinforcing socio-economic aspects and ecological responsibility. All these issues encouraged us to get involved with green analytical chemistry and to implicate the green analytical chemistry postulates in our study.
The crucial purpose of good manufacturing practices (GMP) in pharmaceutical industries is to monitor the safety, stability, and efficacy of the drug throughout the production steps within quality control units (QCU). Starting from the screening of bulk form, passing by in-process quality control, and final dosage form, in addition to, stability testing of the drug throughout its shelf-time are the multiple analyses required in the QCU.9 Drug stability has an impact on product effectiveness and safety since degradation products can cause potency loss and potentially hazardous effects. As a result, chemical and physical stability are critical for ensuring the efficacy and safety of active substances.10
Therefore, the establishment of rapid, green, sustainable, and economic analytical methods that provide short analysis time, ensure stability, reduce analysis cost and downsize the environmental impact is deeply needed in the pharmaceutical analysis workflow.
After reviewing the scientific databases meticulously, only three reported methods for the neat estimation of NMV and RIT in plasma and their co-packed tablet, namely LC-MS, HPLC-DAD, and HPTLC, respectively were found.11–13 Regarding RIT, there are only two published capillary zone electrophoresis (CZE) methods for its separation either from other protease inhibitors14 or from its impurities.15 Furthermore, few LC methods dealing with the degradation studies of RIT were found.16,17 Additionally, the literature had only two LC-MS reports for the degradation study of standalone NMV18,19 and lacks any CZE method for its quantitation. To date, there is neither electro-driven analysis nor forced degradation studies were reported for Paxlovid®.
CZE is regarded as an effective alternative and complementary technique to chromatographic methodologies. It has numerous merits over LC such as high separation power, minute solvents and sample consumption, nearly negligible waste and high ease of operation.20 Noticeably, MEKC is an important capillary electromigration mode that relies on a suitable charged surfactant, such as sodium dodecyl sulphate (SDS) added to the buffer in concentrations above its critical micellar concentration (CMC), forming micelles. These can behave as a pseudo-stationary phase which can interact with neutral or charged analytes according to partitioning mechanisms, just like in a chromatographic method. The micelles–analytes interactions are hydrophobic and/or electrostatic. On the other hand, HPLC is considered the gold standard apparatus in all quality control and research units, offering rapid and sensitive means of separation of different samples.21
As per our endeavour in the field of sustainability and green analytical chemistry21–23 together with the GMP, two green, rapid, and stability-indicating methodologies MEKC and HPLC were implemented for the neat analysis of NMV and RIT. The devised methods are regarded as the first stability-indicating attempt for NMV-RIT simultaneous estimation.
2 Experimental
2.1. Materials and chemicals
Nirmatrelvir (NMV) was kindly supplied from KU Leuven Research & Development, Belgium with a purity of 94%. Ritonavir (RTV) (98%) were acquired from the Haoyuan Chemexpress Co., Ltd (Shanghai, China).Both acetonitrile (ACN) and methanol (MeOH) were acquired from Baker's and were HPLC-grade (Ireland). Ultrapure, China, provided the 0.2 m 25 mm PTFE syringe filters.
Deionized water was used throughout the experimental work. Sodium hydroxide from El-Nasr Chemical Ind. Co. (Egypt) and sodium dodecyl sulfate (SDS) (extra pure, min. 85.0%) and boric acid (extra pure, 99.5%) from Oxford Lab Chem (Mumbai, India) were used.
The background electrolyte was borate buffer prepared by adding 0.309 g of boric acid and 0.1 g of sodium hydroxide in 100 mL deionized water, pH was adjusted using 0.1 M HCl or 0.1 M NaOH. In addition, 0.722 g SDS was added to 100 mL of the prepared buffer and sonicated for 10 min to get 25 mM of SDS. All buffers and assays were prepared with fresh deionized water. Running buffer and samples were sonicated for 5 min and then filtered through 0.45 μm filters before use.
2.2. Apparatus
2.3. Chromatographic conditions
At the kickoff of the CZE working day, the activation of the capillary inner wall was performed firstly using 0.5 M NaOH for 15 min followed by washing with water for 15 min. Afterwards, it was rinsed with 0.1 M NaOH for 300 s, then a 150 s waiting period to ensure complete activation of the inner capillary wall, washed with water for 300 s, and then equilibrated with the BGE for 600 s. Between two consecutive injections, the capillary was flushed with BGE for 120 s. To maintain the reproducibility of injections from run to run, buffer vials were refilled after every 5 successive runs.
![[thin space (1/6-em)]](https://www.rsc.org/images/entities/char_2009.gif) :
:![[thin space (1/6-em)]](https://www.rsc.org/images/entities/char_2009.gif) 50, v/v, respectively. Water was filtered using a 0.45 μm Millipore membrane filter at a temperature of 25 °C. DAD's detection wavelength was set to 210 nm. With a flow rate of 1 mL min−1 and a 20 μL injection volume, the entire run time was 7 min.
50, v/v, respectively. Water was filtered using a 0.45 μm Millipore membrane filter at a temperature of 25 °C. DAD's detection wavelength was set to 210 nm. With a flow rate of 1 mL min−1 and a 20 μL injection volume, the entire run time was 7 min.2.4. Preparation of stock standard solutions and construction of calibration graphs
2.4.2.1 MEKC method & HPLC method. Aliquots of the stock solutions were quantitatively transferred into a set of 10 mL calibrated flasks targeting the specified concentration ranges mentioned in the validation section. The flasks were completed to volume with deionized water. Triplicate injections were performed for each solution. Peak areas were plotted versus the matching concentrations to construct the calibration graphs.
2.5. Forced degradation and stability-indicating study
Forced degradation studies were applied to NMV and RIT synthetic mixtures under different stress conditions. One mL of NMV and RIT stock solutions (1000 μg mL−1) were used for the degradation study. Following degradation, the solutions were neutralized, if needed, then completed in a 10 mL volumetric flask with deionized water to reach a final concentration of 100 μg mL−1 for each degradation case according to the following conditions.2.6. Assay of dosage forms
The single dose of PAXLOVID® is two 150 mg tablets NMV co-packed with one 100 mg tablet RIT. Therefore, four tablets of NMV and two tablets of RIT were weighed, put in the same mortar, and finely crushed. A portion of 50 mL MeOH was added to a weight of the powdered dosage forms equivalent to 300 mg NMV and 100 mg RIT, the solution was sonicated for 10 min. Then, the solution was filtered into a 100 mL volumetric flask, the leftovers were washed with 2 × 10 mL portions of MeOH and at last the filtrate was completed to the mark with MeOH. The final concentration of the stock solution was 3 & 1 mg mL−1 NMV & RIT, respectively. The stock solution was then diluted with the mobile phase in the HPLC method and water in the MEKC method to obtain final concentrations of NMV and RIT within the given linearity ranges by applying the previously described methods. The corresponding concentrations were then calculated from the obtained regression equation.3 Results and discussion
3.1. Method development and optimization
Various trials and experimental conditions were studied and optimized to achieve the best compromise between symmetric peak shapes and lower migration times. The main driving separation factors are buffer pH, buffer ionic strength, capillary length, applied voltage, injection time, and detection wavelength.
Generally, if CZE mode failed to separate a mixture of drugs simply by variation of buffer pH, we should shift to MEKC mode. This mode is a hybridization of chromatographic and electrophoretic methods of analysis. The chief concept is entrenched in the addition of surfactants such as SDS above its critical micelle concentration (CMC) to the buffer solution. In MEKC, the electro-osmotic flow (EOF) plays the role of chromatographic mobile phase.24,25 The pros of this mode are the separation of neutral drugs not only the ionic drugs as in the case of conventional CZE, solubilization of the poorly soluble drugs in addition to minimizing band broadening. Moreover, the improvement of both the resolution and peak shapes of the studied drugs is quite noticed.
3.1.1.1 The influence of buffer pH. Preliminarily trials were done using CZE mode with 50 mM of either acetate buffer pH 4.7, phosphate buffer pH 7.4, or borate buffer pH 9.2, undesirably, these trials resulted in the co-elution of NMV and RIT with the EOF as in case of the acetate buffer or the peak overlap between NMV and RIT as in case of phosphate and borate buffer as illustrated in Fig. S1 in the ESI File.† Furthermore, the pH of each of these three buffers was adjusted to ±1 pH unit and tried, to cover the whole suitable pH range for CZE mode (3–10). Regretfully, neither resolution nor peak shape was improved.
The achievements of green analytical chemistry and sustainability goals are always set as a priority. To decrease the optimization time, the structural features and the pKa of the cited drugs are studied carefully. As these physicochemical characteristics side by side with the buffer pH are the driving force for the electrophoretic separation. Concerning the pKa of the studied drugs, NMV had an acidic pKa 7.1 and a basic pKa −1.6,26 while RIT had an acidic pKa 13.68 and a basic pKa 2.84.26 This indicated that RIT was found to be unionized over the suitable pH range of CZE pH 3–10 whilst NMV was found to be completely ionized in pH 9–10, according to Manuel web calculator.18 All these data-oriented us to shift to the MEKC mode using borate buffer pH 9.2.
3.1.1.2 The rationalized explanation of migration order in MEKC mode. Logically, the anionic surfactant will be directed towards the anode by electrostatic attraction while the EOF directed the entire solution to the cathode due to the negatively charged silica on the inside capillaries wall. However, practically, micelles also move towards the cathode but with slower velocity than the EOF, as the EOF has the upper hand over the micelle's electrophoretic mobility. The main factor affecting the migration time is typically the solute partitioning between micelles and bulk solution. The higher the affinity of the drug to micelles, the slower the migration is and vice versa.25,27
These findings explain the migration order of anionic, cationic, and neutral analytes. According to the charge on the analyte, electrostatic repulsion exists between anions and SDS micelles due to the similarity of negative charge on both of them, so anionic samples move with the bulk solution, and their migration times are nearby the EOF. On the contrary, cations are strongly attracted to the micelle, so they are eluted at close proximity to the slow micelle electrophoretic mobility. Furthermore, the hydrophobicity of the analytes affects their elution order. It was quite noticed that hydrophobic drugs will be incorporated into the surfactant micelles, so they migrate with the slower micelles' velocity. While hydrophilic drugs will elute first with the EOF. The hydrophobicity basis is the key factor controlling the neutral compounds separation.25,27
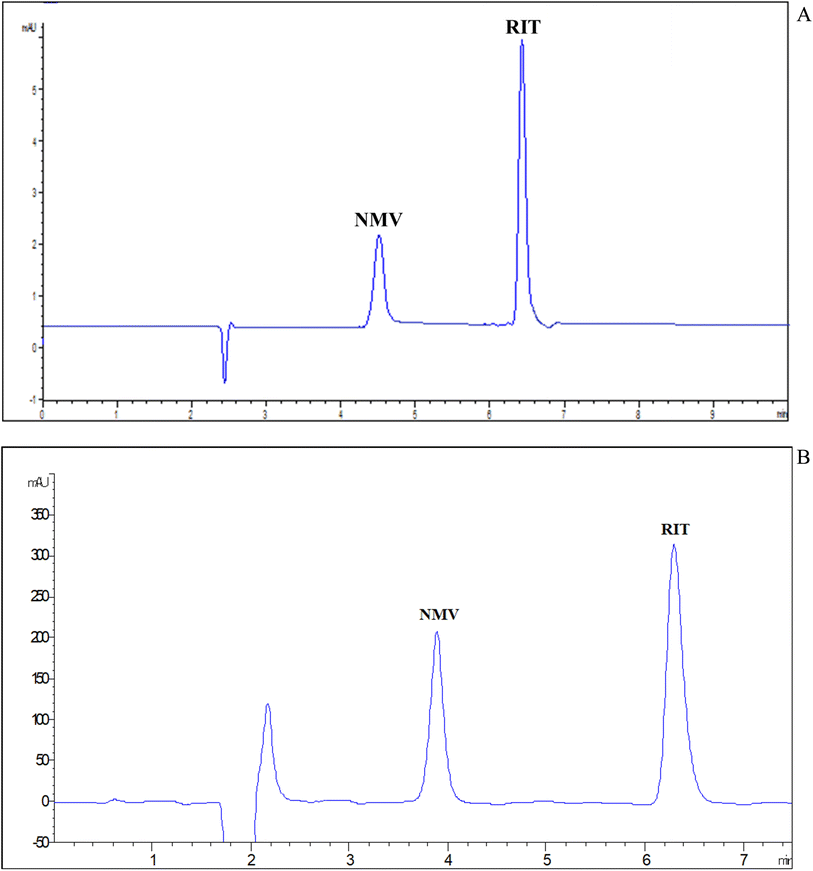
Applying the aforementioned postulates in our case, the migration order is NMV at 4.51 min followed by RIT at 6.43. This may be mainly attributed to the hydrophobicity basis that NMV is more water soluble than RIT (NMV 0.0277 mg mL−1 (ref. 26) and RIT 0.00126 mg mL−1 (ref. 18)). Moreover, at the selected buffer pH, NMV is negatively charged due to loss of amide proton and RIT is unionized, so the NMV appeared first in the electropherogram.
3.1.1.3 Buffer concentration. High buffer and SDS ionic strength should be avoided as they lead to high viscosities and currents, which may deteriorate the capillary inner surface.28 Band broadening and poor peak shape were remarked with lower ionic strength of buffer such as 10 and 25 mM. The optimum concentration that gives an acceptable peak shape was 50 mM.
3.1.1.4 SDS concentration. The outcome of different SDS concentrations such as (15, 25, 35, and 50 mM) was studied on the separation of the binary mixture. The results revealed that 25 mM SDS in the BGE in 50 cm capillary showed excellent compromise between separation pattern and migration times.
3.1.1.5 Selection of diluting solvent. Water is the first choice for dilution in the CZE separation method which is why it is considered a top green solvent. However, many trials were examined to improve peak symmetry. When dilution is done using totally BGE or containing 1 mL of organic modifier (such as methanol or acetonitrile) together with water, peak distortion of both drugs and longer migration of RIT result as shown in Fig. S2 in the ESI File.† Water gave the best separation profile with an acceptable peak shape and reasonable migration time. The main reason is water's lower ionic strength provides sample high-field stacking, causing ions faster migration and stacking as sharp peaks.29
3.1.1.6 Effect of applied voltage and injection time. As anticipated, as the voltage increases the EOF increases too, showing a better separation profile in a shorter migration time and keeping the peak resolution unaffected.30 Different values of applied voltage were studied ranging from 15–30 kV using the optimized BGE. The selected voltage was 30 kV as it showed optimum run time and separation efficiencies.
Concerning the hydrodynamic injection, the injection time is directly proportional to peak width and height. The optimum injection time that provided the best response with the best peak shape was 17 s. This value was selected after studying the injection time ranging from 5–20 s.
3.1.1.7 Selection of detection wavelengths. DAD has many advantages such as increasing the sensitivity of measurement by assessing each compound at its maximum absorption wavelength. Besides, it can confirm peak purity. As shown in the ESI File Fig. S3,† NMV has an absorption band with a maximum of about 210 nm. RIT has two maxima at 210 and 240 nm. For the sake of simplicity as well as sensitivity, 210 nm was selected as a common wavelength for the measurement of both drugs. Finally, the proposed MEKC method permitted the synchronized separation of NMV-RIT in less than 8 min as illustrated in the electropherogram in Fig. 2(A).
To find the optimal compromise between symmetric peak shapes, short retention times, and sufficient separation between NMV, RIT, and their degradation products, several trials and experimental settings were investigated and optimized. The main leading separation factors were the type of organic modifier, percentage of organic modifier, buffer pH, buffer concentration, type of column, column length, and detection wavelength.
As stated in the MEKC section, sustainability is always given top priority to shorten the optimization time. Hence, concerning the pKa of the studied drugs,12,26 using pH 5 was the best for this study to be 2 pH units away from the pKa values of the drugs and still be in the acceptance pH range for the used columns, 2–9 pH. Again, for the sake of sustainability and eco-friendliness, we used ammonium acetate buffer at pH 5 which was near the ammonium acetate buffer capacity.31
The effect of variable columns on the efficiency of the resolution was studied. Agilent Zorbax eclipse-C18 (150 × 4.6 mm, 5 μm) showed bad resolution between NMV, RIT, and their degradation products, whereas eclipse-C18 (250 × 4.6 mm, 5 μm) showed better separation between the two drugs and their degradation products. Therefore, the long column was used in the subsequent optimization.
The type of organic modifiers in the mobile phase experimented with water, pH 5. MeOH gave broadener and lately eluted peaks than ACN and hence the latter was selected for the subsequent trials.
After trials of different ratios between ammonium acetate at pH 5 and ACN, NMV, RIT, and their degradation products were best resolved and symmetrically eluted using 50/50, v/v.
The examination of different concentrations of ammonium acetate (10, 20, 50 mM) showed suitable symmetry with acceptable back pressure upon using 50 mM ammonium acetate.
The detection wavelength was studied to choose the best λ that would give the highest sensitivity with minimum interference from the organic modifier. Three λ were studied, 210, 225 & 240 nm. The first one yielded the highest peak area for the low-UV absorbing NMV and for RIT with the least interference from ACN (UV cutoff = 190 nm), Fig. S4 in the ESI File.†
In less than 8 min, the peaks were separated under optimal chromatographic conditions, with high resolution and tolerable shapes. A conventional chromatogram was shown in Fig. 2(B) where NMV and RIT were eluted at 3.89 and 6.29 min, respectively. The system suitability characteristics (Table 1) were examined for both methods, MEKC and HPLC, revealing satisfactory and indicative applicability and efficacy of the suggested procedures.
| Parameter | MEKC | HPLC | ||
|---|---|---|---|---|
| NMV | RIT | NMV | RIT | |
| tR ± SD (min) | 4.35 ± 0.15 | 6.30 ± 0.10 | 3.89 ± 0.10 | 6.29 ± 0.10 |
| Retention factors (k′) | 3.50 | 5.40 | 1.95 | 0.85 |
| Theoretical plates (N) | 5030 | 21![[thin space (1/6-em)]](https://www.rsc.org/images/entities/char_2009.gif) 753 753 |
4268 | 3827 |
| USP tailing factor | 1.09 | 1.51 | 1.01 | 0.85 |
| Selectivity (α) | — | 1.42 | — | 2.29 |
| Resolution (Rs) | — | 8.90 | 4.17 | 8.74 |
DAD was used to verify the purity plots of NMV and RIT peaks under varied stress conditions. Purity factors within the proper automatically determined noise acceptable limit, shown in Fig. S5 in the ESI File,† were used to identify pure peaks.
3.2. Forced degradation and stability-indicating study
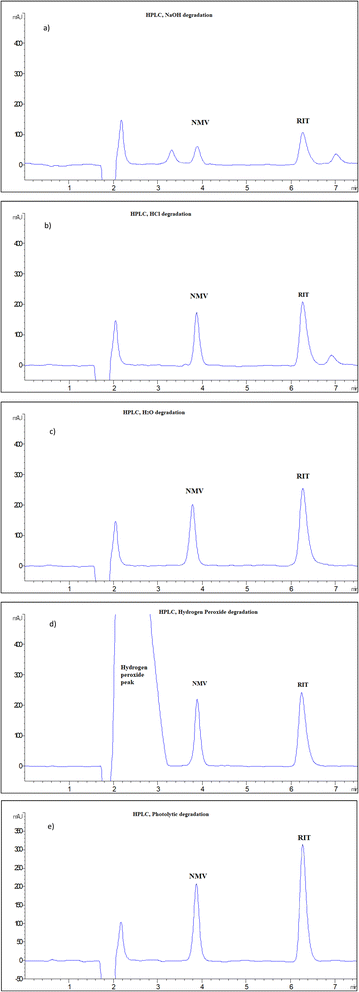
NMV and RIT mixtures were subjected to a variety of stress conditions, including acid, base, neutral, oxidative, and photolytic degradation, as per ICH guidelines.32 It is important to note that finding the right circumstances for degradation requires “trial and error” in order to get a reasonable degradation percentage of the intact drug, between 30 and 70%. The stability-indicating power of the developed techniques is then assessed by its ability to separate the intact drug from its degradation products. The proposed HPLC and MEKC approaches were used to track simultaneously the degradation of NMV, and RIT.Table 2 shows the stress conditions that were tried and the % recovery of NMV and RIT in both methods. It was found that NMV remained stable with nearly 100% recovery under the following conditions: oxidative hydrolysis with 25% H2O2 at 70 °C for 0.5 h, neutral hydrolysis with H2O, 70 °C for 1 h, and photolytic degradation at sunlight for 4 h, Fig. 3. However, under alkaline and acidic degradation conditions using 0.1 M NaOH at 70 °C for 0.5 h and 1 M HCl at 70 °C for 1 h, excessive degradation of NMV was noticed, with the recovery of 33.52% and 88.10%, respectively, Fig. 3. For RIT, under the same stress conditions, it was found that RIT was more susceptible to degradation with NaOH, then HCl followed by hydrogen peroxide and finally neutral hydrolysis as shown in Table 2 & Fig. 3. However, RIT was found to be stable in sunlight, Fig. 3. The illustrative HPLC chromatograms were presented in Fig. 3, while MEKC electropherograms were demonstrated in Fig. S6 in the ESI File.†
| Degradation conditions | Percentage recovery | |||
|---|---|---|---|---|
| MEKC | HPLC | |||
| NMV | RIT | NMV | RIT | |
| Alkaline degradation (0.1 M NaOH, 70 °C, 0.5 h) | 31.6 | 35.5 | 32.1 | 34.88 |
| Acidic degradation (1 M HCl, 70 °C, 1 h) | 86.7 | 66.3 | 88.1 | 65.97 |
| Neutral degradation (H2O, 70 °C, 1 h) | 99.25 | 85.2 | 101.25 | 82.79 |
| Oxidative degradation (25% H2O2, 70 °C, 0.5 h) | 99.5 | 75.23 | 101.52 | 74.42 |
| Photolytic degradation (sunlight, 4h) | 100.12 | 100.53 | 99.65 | 101.23 |
These results were in accordance with other published papers studying the degradation of RIT or NMV keeping in mind the differences in the used stress conditions.16,18
From previously reported degradation results, it was easy to observe that NMV was vulnerable to alkaline hydrolysis and a less extent to acid hydrolysis. This may be attributed to the presence of amide and nitrile bonds in the NMV structure, Fig. 1a.18 The alkaline hydrolysis of these bonds forms the carboxylate anion which pulls the reaction to completion unlike acid hydrolysis.33
On the other side, RIT was more highly prone to alkaline than acid followed by oxidative and finally neutral hydrolysis, Table 2, due to the presence of carbamate and urea moiety in its structure which were liable to alkaline hydrolysis, Fig. 1b.16
After checking the fundamentals of organic chemistry, it was found that the amide linkage is the most stable and the least susceptible to hydrolysis among the carboxylic acid derivatives (esters and carbamates). However, the presence of an electron-withdrawing group such as CF3 (trifluoromethyl) attached to the carbonyl group, as found in NMV, greatly accelerates the alkali-catalyzed hydrolysis. This makes the amide linkage nearly as susceptible as the carbamate to hydrolysis. Concerning the carbamates exemplified in RIT, their alkaline hydrolysis predominates over acidic hydrolysis.16 Additionally, the IUPAC nomenclatures of both drugs in Fig. 1 illustrate that the parent function in NMV is the amide whilst in RIT is the carbamate. Hence, the abovementioned arguments explain the practically found % recoveries after applying the different hydrolysis, oxidation, and photolysis conditions. Both drugs had approximately equal percentage degradation and the same degradation behaviour as demonstrated in Table 2.
3.3. Method validation
According to the International Conference on Harmonization (ICH) requirements, the proposed methods were verified in terms of linearity, detection and quantitation limit, accuracy, precision, selectivity, stability, and robustness.34| Parameter | MEKC | HPLC | ||
|---|---|---|---|---|
| NMV | RIT | NMV | RIT | |
| a Standard deviation of the intercept.b Standard deviation of the slope.c Standard deviation of residuals.d Variance ratio, equals the mean of squares due to regression divided by the mean of squares about regression (due to residuals).e Limit of detection.f Limit of quantification. | ||||
| Wavelength (nm) | 210 | 210 | 210 | 210 |
| Concentration range (μg mL−1) | 10–200 | 5–100 | 10–200 | 5–100 |
| Intercept (a) | −0.440 | −0.222 | −12.837 | 33.501 |
| Saa | 0.182 | 0.463 | 20.081 | 18.657 |
| Slope (b) | 0.412 | 0.900 | 23.074 | 47.953 |
| Sbb | 0.003 | 0.008 | 0.179 | 0.400 |
| RSD% of the slope (Sb%) | 0.68 | 0.68 | 0.77 | 0.834 |
| Correlation coefficient (r) | 0.9998 | 0.9998 | 0.9999 | 0.9992 |
| Sy/xc | 0.718 | 0.837 | 31.557 | 33.975 |
| Fd | 19![[thin space (1/6-em)]](https://www.rsc.org/images/entities/char_2009.gif) 383.8 383.8 |
14![[thin space (1/6-em)]](https://www.rsc.org/images/entities/char_2009.gif) 265.51 265.51 |
16![[thin space (1/6-em)]](https://www.rsc.org/images/entities/char_2009.gif) 530.94 530.94 |
14![[thin space (1/6-em)]](https://www.rsc.org/images/entities/char_2009.gif) 344.83 344.83 |
| Significance F | 8.17 × 10⁻⁷ | 1.29 × 10⁻⁶ | 2.19 × 10⁻⁸ | 2.9 × 10⁻⁸ |
| LODe (μg mL−1) | 1.34 | 0.59 | 0.67 | 0.37 |
| LOQf (μg mL−1) | 2.78 | 1.95 | 2.22 | 1.23 |
![[thin space (1/6-em)]](https://www.rsc.org/images/entities/char_2009.gif) :
:![[thin space (1/6-em)]](https://www.rsc.org/images/entities/char_2009.gif) 1, whereas the ratio for the LOQ is set to be 10
1, whereas the ratio for the LOQ is set to be 10![[thin space (1/6-em)]](https://www.rsc.org/images/entities/char_2009.gif) :
:![[thin space (1/6-em)]](https://www.rsc.org/images/entities/char_2009.gif) 1. Both of the described methods could measure the NMV and RIT at concentrations as low as 2.78 and 1.95 μg mL−1 using MEKC and 2.22 and 1.23 μg mL−1 using HPLC, respectively.
1. Both of the described methods could measure the NMV and RIT at concentrations as low as 2.78 and 1.95 μg mL−1 using MEKC and 2.22 and 1.23 μg mL−1 using HPLC, respectively.3.4. Application of the validated methods in the assay of tablets dosage forms
The developed MEKC and HPLC procedures were successfully applied for the quantitation of NMV and RIT in PAXLOVID® tablets. In either MEKC or HPLC analysis, no peculiar peaks were observed from any of the excipients or the tablet matrix. Fig. S9 and S10 in the ESI File† represent MEKC electropherograms and HPLC chromatogram for NMV/RIT tablets assay. Acceptable percentage recoveries, standard deviation, and RSD% values proved the precision and accuracy of the assay results. Table 4 compiles the results of the MEKC and HPLC analyses. The verified MEKC and HPLC techniques' sufficient analytical performance as indicated above demonstrates their suitability for the routine analysis of NMV and RIT in their co-packed pills with little sample preparation and reasonable analytical results. Moreover, the results of the proposed MEKC and HPLC methods were compared. The statistical t-values (−1.55 and −0.89) and statistical F-values (18.6 and 17.3) for NMV and RIT, respectively, didn't exceed the theoretical ones n = 3 (2.77 and 19), demonstrating that, at p = 0.05, there were no significant differences between the methods.3.5. Comprehensive environmental impact, sustainability assessment, and comparison of the proposed methods versus the published ones
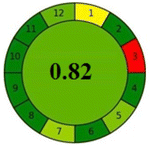
As a consequence of the recent advances in metrics used for the assessment of greenness exemplified by AGREE metric,35 analysts worldwide are seeking perfection by finding a comprehensive global assessment of the whole analytical method concerning validation criteria, economic aspects, and the fundamentals of green analytical chemistry (GAC). In the last four years till present, many efforts by Caudet et al.36 and Nowak et al.37 have been done to provide a multicriteria assessment of the analytical performance, to give a quantitative mean for the evaluation, and to justify the claimed environmental benefits. These approaches are the hexagon evaluation tool and red-green-blue (RGB) 12 model. Accordingly, the description of the analytical best-performing technique with excellent economic and environmental aspects and improved sustainability is recently called “white”.Briefly, AGREE is the latest version of greenness assessment metrics. It is an open-access downloadable software, based on the twelve principles of GAC (significance). The ideal method had a score of 1 taking the dark green color.35
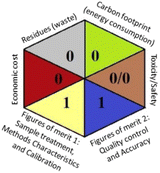
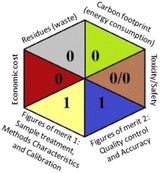
As the final assessment information of greenness, validation criteria fulfilment, and sustainability are summarized in a hexagon pictogram, this multicriteria tool is named the hexagon tool. It implicates the penalization technique with a final score from 0 to 4 corresponding to the best and worst performance, respectively. Additionally, the assessment tables and the overall qualification table of the examined parameters relative to penalty point ranges are found in the original manuscript.36
Regarding the RGB 12 model, it is a readymade free excel spreadsheet and it is subdivided into three primary colours regions red, green, and blue. The essence of whiteness is the evaluation of the whole methodology from various perspectives namely validation parameters (red region), GAC principles (green region), and sustainability (blue region). Following the fact that white is the result of the amalgamation of red, green, and blue, the whiteness% is the arithmetic mean of the 3 regions' total scores.37
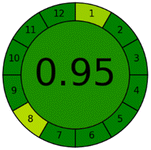
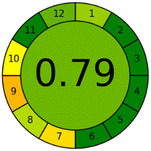
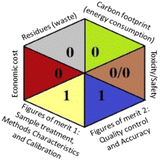
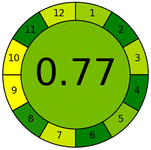
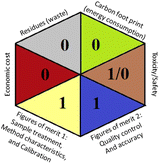
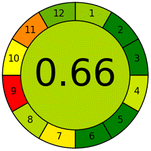
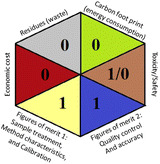
Applying the abovementioned concepts of evaluation, the MEKC method expectedly outperformed the LC methods in terms of greenness and whiteness. The scores were 0.95, 5 zeros/2 ones, and 99.6 using AGREE, hexagon, and RGB12 algorithms, respectively. Although the LC technique is controversial and swinging between the GAC and classical analytical chemistry using harmful solvents and producing a vast amount of waste, the results of the evaluation of the proposed method versus the cited ones11–13 revealed the great tendency of the research groups to use green solvents and to downsize the residues. The collective Table 5 ranks the method in descending order according to their whiteness%. It illustrates that the proposed and the reported HPLC-DAD assay12 of the mixture under investigation had a typical hexagon profile and approximately the same AGREE (0.79, 0.82 respectively) and the same whiteness% around 93. However, the proposed HPLC offers a feasibility study for the stability of Paxlovid pills under different stress conditions. Concerning the HPTLC13 and LC-Ms11 reported methods, they still cover the green scope of analysis with AGREE SCORE (0.77, 0.66, respectively) and whiteness% (91.9, 91.1, respectively). The hexagon profile for both methods showed good green and sustainable performance with 4 zeros and 3 ones. The variation in scores according to different tools is based on the different parameters of evaluation of each metric.19
| Method name | Whiteness (%) | RGB12 MODEL | AGREE | Hexagon |
|---|---|---|---|---|
| a (run time x flow rate) For HPLC methods, (number of samples on TLC plate/volume of mobile phase per run) for HPTLC method. | ||||
| Proposed MEKC | 99.6 | 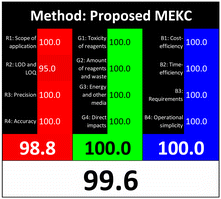 |
 |
 |
| BGE: 50 mM borate buffer containing 25 mM SDS | ||||
| Number of analytes: 4 | ||||
| Run time: 7 min | ||||
| Waste/run: --- | ||||
| Proposed HPLC | 93.1 | 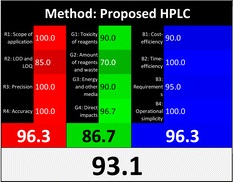 |
 |
 |
Mobile phase: ACN![[thin space (1/6-em)]](https://www.rsc.org/images/entities/char_2009.gif) : :![[thin space (1/6-em)]](https://www.rsc.org/images/entities/char_2009.gif) ammonium acetate buffer (50 ammonium acetate buffer (50![[thin space (1/6-em)]](https://www.rsc.org/images/entities/char_2009.gif) : :![[thin space (1/6-em)]](https://www.rsc.org/images/entities/char_2009.gif) 50 v/v) 50 v/v) |
||||
| Number of analytes: 2 | ||||
| Run time: 7 min | ||||
| Flow rate: 1 mL min−1 | ||||
| Waste/runa: 7 mL | ||||
| Reported HPLC12 | 92.6 | 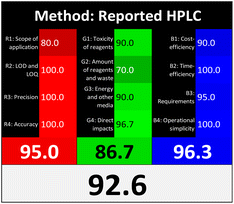 |
 |
 |
Mobile phase: ethanol![[thin space (1/6-em)]](https://www.rsc.org/images/entities/char_2009.gif) : :![[thin space (1/6-em)]](https://www.rsc.org/images/entities/char_2009.gif) water (80 water (80![[thin space (1/6-em)]](https://www.rsc.org/images/entities/char_2009.gif) : :![[thin space (1/6-em)]](https://www.rsc.org/images/entities/char_2009.gif) 20 v/v) 20 v/v) |
||||
| Number of analytes: 2 | ||||
| Run time: 7 min | ||||
| Flow rate: 1 mL min−1 | ||||
| Waste/runa: 7 mL | ||||
| Reported HPTLC13 | 91.9 | 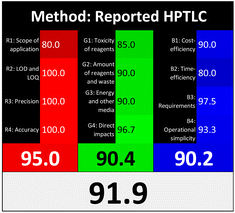 |
 |
 |
Mobile phase: methanol–water −2% urea solution of β-cyclodextrin (40![[thin space (1/6-em)]](https://www.rsc.org/images/entities/char_2009.gif) : :![[thin space (1/6-em)]](https://www.rsc.org/images/entities/char_2009.gif) 10 10![[thin space (1/6-em)]](https://www.rsc.org/images/entities/char_2009.gif) : :![[thin space (1/6-em)]](https://www.rsc.org/images/entities/char_2009.gif) 5, by volume) 5, by volume) |
||||
| Number of analytes: 2 | ||||
| Run time: around 20 min | ||||
| Waste/runa: around 1 mL | ||||
| Reported LC-MS11 | 91.1 | 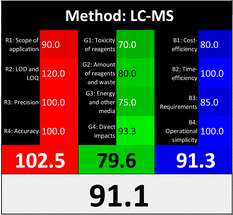 |
 |
 |
Mobile phase: 0.1% v/v formic acid in water and methanol (36![[thin space (1/6-em)]](https://www.rsc.org/images/entities/char_2009.gif) : :![[thin space (1/6-em)]](https://www.rsc.org/images/entities/char_2009.gif) 64, v/v) 64, v/v) |
||||
| Number of analytes: 2 | ||||
| Flow rate: 0.8 mL min−1 | ||||
| Run time: 7 min | ||||
| Waste/runa: 5.8 mL | ||||
Obviously, the common advantage of the proposed methods is their largest scope of application (stability indicating methods). They kept the pros of the reported methods in terms of short run time and small volume of waste and mainly avoided the disadvantage of high energy expenditure of LC-MS. Besides, the MEKC method is markedly the topmost green method among the others due to the minute amount of sample consumed, almost no waste produced and water is the main solvent used.
4 Conclusion
The proposed methods are considerably an initiative work for the concurrent estimation of the newly FDA approved Paxlovid®. It is worth mentioning that both methods were deemed as the first stability-indicating report for NMV and RIT whilst the MEKC method is regarded as the first attempt at electrophoretic separation of these drugs. Additionally, both methodologies were selective enough to separate the cited drugs from their degradants in 7 min. Implicating the greenness, functionality, and sustainability perspectives, the two techniques were investigated and ranked using AGREE, Hexagon, and RGB12 algorithms. They showed excellent greenness, whiteness, and sustainability scores. All the exquisite performance profiles of the suggested MEKC and HPLC methodologies powerfully endorsed them for application in the routine analysis of Paxlovid pills in quality control units.Author contriutions
Haydi S. Elbordiny: conceptualization, methodology, data curation, formal analysis, validation, writing – original draft. Nourah Z. Alzoman: conceptualization, writing, review & editing, supervision. Hadir M. Maher: conceptualization, methodology – review & editing, supervision, project administration. Sara I. Aboras: conceptualization, methodology, data curation, formal analysis, validation, writing – original draft, project administration.Conflicts of interest
There are no conflicts of interest to declare.Acknowledgements
Our sincere thanks go to Prof. John Neyts and Dr Rana Abdelnabi at KU Leuven Department of Microbiology, Immunology, and Transplantation, Rega Institute for Medical Research, Laboratory of Virology and Chemotherapy, 3000, Leuven, Belgium for providing us with standard Nirmatrelvir sample.References
- D. R. Owen, C. M. N. Allerton, A. S. Anderson, L. Aschenbrenner, M. Avery, S. Berritt, B. Boras, R. D. Cardin, A. Carlo, K. J. Coffman, A. Dantonio, L. Di, H. Eng, R. Ferre, K. S. Gajiwala, S. A. Gibson, S. E. Greasley, B. L. Hurst, E. P. Kadar, A. S. Kalgutkar, J. C. Lee, J. Lee, W. Liu, S. W. Mason, S. Noell, J. J. Novak, R. S. Obach, K. Ogilvie, N. C. Patel, M. Pettersson, D. K. Rai, M. R. Reese, M. F. Sammons, J. G. Sathish, R. S. P. Singh, C. M. Steppan, A. E. Stewart, J. B. Tuttle, L. Updyke, P. R. Verhoest, L. Wei, Q. Yang and Y. Zhu, An oral SARS-CoV-2 M(pro) inhibitor clinical candidate for the treatment of COVID-19, Science, 2021, 374(6575), 1586–1593 CrossRef CAS PubMed.
- L. Kim, S. Garg, A. O'Halloran, M. Whitaker, H. Pham, E. J. Anderson, I. Armistead, N. M. Bennett, L. Billing, K. Como-Sabetti, M. Hill, S. Kim, M. L. Monroe, A. Muse, A. L. Reingold, W. Schaffner, M. Sutton, H. K. Talbot, S. M. Torres, K. Yousey-Hindes, R. Holstein, C. Cummings, L. Brammer, A. J. Hall, A. M. Fry and G. E. Langley, Risk Factors for Intensive Care Unit Admission and In-hospital Mortality Among Hospitalized Adults Identified through the US Coronavirus Disease 2019 (COVID-19)-Associated Hospitalization Surveillance Network (COVID-NET), Clin. Infect. Dis., 2021, 72(9), e206–e214 CrossRef CAS PubMed.
- B. Thakur, P. Dubey, J. Benitez, J. P. Torres, S. Reddy, N. Shokar, K. Aung, D. Mukherjee and A. K. Dwivedi, A systematic review and meta-analysis of geographic differences in comorbidities and associated severity and mortality among individuals with COVID-19, Sci. Rep., 2021, 11(1), 8562 CrossRef CAS PubMed.
- Z. Zheng, F. Peng, B. Xu, J. Zhao, H. Liu, J. Peng, Q. Li, C. Jiang, Y. Zhou, S. Liu, C. Ye, P. Zhang, Y. Xing, H. Guo and W. Tang, Risk factors of critical & mortal COVID-19 cases: A systematic literature review and meta-analysis, J. Infect., 2020, 81(2), e16–e25 CrossRef CAS PubMed.
- https://coronavirus.jhu.edu/map.html. (accessed 24/1/2023).
- J. Hammond, H. Leister-Tebbe, A. Gardner, P. Abreu, W. Bao, W. Wisemandle, M. Baniecki, V. M. Hendrick, B. Damle, A. Simón-Campos, R. Pypstra and J. M. Rusnak, Oral Nirmatrelvir for High-Risk, Nonhospitalized Adults with Covid-19, N. Engl. J. Med., 2022, 386(15), 1397–1408 CrossRef CAS PubMed.
- R. Abdelnabi, C. S. Foo, D. Jochmans, L. Vangeel, S. De Jonghe, P. Augustijns, R. Mols, B. Weynand, T. Wattanakul, R. M. Hoglund, J. Tarning, C. E. Mowbray, P. Sjö, F. Escudié, I. Scandale, E. Chatelain and J. Neyts, The oral protease inhibitor (PF-07321332) protects Syrian hamsters against infection with SARS-CoV-2 variants of concern, Nat. Commun., 2022, 13(1), 719 CrossRef CAS PubMed.
- https://unfccc.int/cop27. (accessed 24/1/2023).
- J. D. Nally, Good Manufacturing Practices for Pharmaceuticals, CRC Press, 6th edn, 2007 Search PubMed.
- C. Garnero, A. Zoppi, C. Aloisio and M. R. Longhi, Technological delivery systems to improve biopharmaceutical properties, in Nanoscale Fabrication, Optimization, Scale-Up and Biological Aspects of Pharmaceutical Nanotechnology, Elsevier, 2018, pp. 253–299 Search PubMed.
- C. Liu, M. Zhu, L. Cao, H. Boucetta, M. Song, T. Hang and Y. Lu, Simultaneous determination of nirmatrelvir and ritonavir in human plasma using LC-MS/MS and its pharmacokinetic application in healthy Chinese volunteers, Biomed. Chromatogr., 2022, 36(11), e5456 CrossRef CAS PubMed.
- M. S. Imam, A. S. Batubara, M. Gamal, A. H. Abdelazim, A. A. Almrasy and S. Ramzy, Adjusted green HPLC determination of nirmatrelvir and ritonavir in the new FDA approved co-packaged pharmaceutical dosage using supported computational calculations, Sci. Rep., 2023, 13(1), 137 CrossRef CAS PubMed.
- M. S. Imam, A. H. Abdelazim, A. S. Batubara, M. Gamal, A. A. Almrasy, S. Ramzy, H. Khojah and T. H. Hasanin, Simultaneous green TLC determination of nirmatrelvir and ritonavir in the pharmaceutical dosage form and spiked human plasma, Sci. Rep., 2023, 13(1), 6165 CrossRef CAS PubMed.
- W. Gutleben, N. D. Tuan, H. Stoiber, M. P. Dierich, M. Sarcletti and A. Zemann, Capillary electrophoretic separation of protease inhibitors used in human immunodeficiency virus therapy, J. Chromatogr. A, 2001, 922(1–2), 313–320 CrossRef CAS PubMed.
- A. Z. Carvalho, M. N. El-Attug, S. E. Zayed, E. Van Hove, J. Van Duppen, J. Hoogmartens and A. Van Schepdael, Micellar electrokinetic chromatography method development for determination of impurities in Ritonavir, J. Pharm. Biomed. Anal., 2010, 53(5), 1210–1216 CrossRef CAS PubMed.
- R. N. Rao, B. Ramachandra, R. M. Vali and S. S. Raju, LC–MS/MS studies of ritonavir and its forced degradation products, J. Pharm. Biomed. Anal., 2010, 53(4), 833–842 CrossRef CAS PubMed.
- S. Koppala, B. Panigrahi, S. Raju, K. Padmaja Reddy, V. Ranga Reddy and J. S. Anireddy, Development and validation of a simple, sensitive, selective and stability-indicating RP-UPLC method for the quantitative determination of ritonavir and its related compounds, J. Chromatogr. Sci., 2015, 53(5), 662–675 CAS.
- P. H. Secretan, M. Annereau, W. Kini-Matondo, B. Prost, J. Prudhomme, L. Bournane, M. Paul, N. Yagoubi, H. Sadou-Yayé and B. Do, Unequal Behaviour between Hydrolysable Functions of Nirmatrelvir under Stress Conditions: Structural and Theoretical Approaches in Support of Preformulation Studies, Pharmaceutics, 2022, 14(8) CrossRef CAS PubMed.
- S. I. Aboras and H. M. Maher, Green adherent degradation kinetics study of Nirmatrelvir, an oral anti-COVID-19: characterization of degradation products using LC–MS with insilico toxicity profile, BMC Chem., 2023, 17(1), 23 CrossRef CAS PubMed.
- M. A. Ragab, M. H. Abdel-Hay, H. M. Ahmed and S. M. Mohyeldin, Application of capillary zone electrophoresis coupled with a diode array detector (CZE-DAD) for simultaneous analysis of ibuprofen and phenylephrine, J. AOAC Int., 2019, 102(2), 473–479 CrossRef CAS PubMed.
- H. S. Elbordiny, S. M. Elonsy, H. G. Daabees and T. S. Belal, Development and comprehensive greenness assessment for MEKC and HPTLC methods for simultaneous estimation of sertaconazole with two co-formulated preservatives in pharmaceutical dosage forms, Sustainable Chem. Pharm., 2022, 25, 100580 CrossRef CAS.
- H. S. Elbordiny, S. M. Elonsy, H. G. Daabees and T. S. Belal, Sustainable quantitative determination of allopurinol in fixed dose combinations with benzbromarone and thioctic acid by capillary zone electrophoresis and spectrophotometry: Validation, greenness and whiteness studies, Sustainable Chem. Pharm., 2022, 27, 100684 CrossRef CAS.
- M. A. A. Ragab, H. M. Maher, S. Tarek and H. Mahgoub, An eco-friendly multi-analyte high-performance thin layer chromatographic densitometric determination of amoxicillin, metronidazole, and famotidine in their ternary mixtures and simulated gastric juice: A promising protocol for eradicating Helicobacter pylori, J. Sep. Sci., 2022, e2200951 Search PubMed.
- S. M. Elonsy, F. A. El Yazbi, R. A. Shaalan, H. M. Ahmed and T. S. Belal, Application of MEKC and UPLC with fluorescence detection for simultaneous determination of amlodipine besylate and bisoprolol fumarate, J. AOAC Int., 2021, 104(2), 339–347 CrossRef PubMed.
- G. Hancu, B. Simon, A. Rusu, E. Mircia and A. Gyéresi, Principles of micellar electrokinetic capillary chromatography applied in pharmaceutical analysis, Adv. Pharm. Bull., 2013, 3(1), 1–8 Search PubMed.
- https://go.drugbank.com/drugs/DB00503.
- H. S. Elbordiny, S. M. Elonsy, H. G. Daabees and T. S. Belal, Implementation of two sustainable chromatographic methods for the simultaneous micro-quantitation and impurity profiling of metformin and rosuvastatin in recently approved fixed dose pills: Greenness and whiteness studies, Sustainable Chem. Pharm., 2022, 30, 100885 CrossRef CAS.
- S. M. Elonsy, M. F. Kamal, M. M. Hamdy and M. M. Abdel Moneim, Comparative Greenness Metric Estimates for Content Uniformity Testing of Anti-Cov-2, GS-5734 in Commercial Vials: Validated Micellar Electrokinetic Chromatographic Assay, J. AOAC Int., 2022, 105(3), 739–747 CrossRef PubMed.
- S. I. Aboras, H. H. Abdine, M. A. Ragab and M. A. Korany, A Review on Analytical Strategies for the Assessment of Recently Approved Direct Acting Antiviral Drugs, Crit. Rev. Anal. Chem., 2021, 1–23 Search PubMed.
- H. Issaq, I. Atamna, G. Muschik and G. Janini, The effect of electric field strength, buffer type and concentration on separation parameters in capillary zone electrophoresis, Chromatographia, 1991, 32, 155–161 CrossRef CAS.
- L. Konermann, Addressing a Common Misconception: Ammonium Acetate as Neutral pH "Buffer" for Native Electrospray Mass Spectrometry, Am. Soc. Mass Spectrom., 2017, 28(9), 1827–1835 CrossRef CAS PubMed.
- Stability Testing Of New Drug Substances And Products Q1A(R2), International Conference Harmonization, Geneva, February 2003, https://www.ich.org/fileadmin/Public_Web_Site/ICH_Products/Guidelines/Quality/Q1A_R2/Step4/Q1A_R2__Guideline.pdf Search PubMed.
- R. J. Ouellette and J. D. Rawn, 22 – Carboxylic Acid Derivatives, in Organic Chemistry, ed. R. J. Ouellette and J. D. Rawn, Academic Press, 2nd edn, 2018, pp. 665–710 Search PubMed.
- International Conference on Harmonisation (ICH), ICH, Validation of Analytical Procedures: Text and Methodology, Q2(R1), ICH, 2005 Search PubMed.
- F. Pena-Pereira, W. Wojnowski and M. Tobiszewski, AGREE—Analytical GREEnness Metric Approach and Software, Anal. Chem., 2020, 92(14), 10076–10082 CrossRef CAS PubMed.
- A. Ballester-Caudet, P. Campíns-Falcó, B. Pérez, R. Sancho, M. Lorente, G. Sastre and C. González, A new tool for evaluating and/or selecting analytical methods: Summarizing the information in a hexagon, TrAC, Trends Anal. Chem., 2019, 118, 538–547 CrossRef CAS.
- P. M. Nowak, R. Wietecha-Posłuszny and J. Pawliszyn, White Analytical Chemistry: An approach to reconcile the principles of Green Analytical Chemistry and functionality, TrAC, Trends Anal. Chem., 2021, 116223 CrossRef CAS.
Footnote |
| † Electronic supplementary information (ESI) available. See DOI: https://doi.org/10.1039/d3ra04186g |
| This journal is © The Royal Society of Chemistry 2023 |

