 Open Access Article
Creative Commons Attribution 3.0 Unported Licence
Concentration shift experiment with an electrode of active material for precise electrochemical analysis†
Tamotsu Sawahashi,
Koji Hiraoka and
Shiro Seki *
*
Graduate School of Applied Chemistry and Chemical Engineering, Kogakuin University, 2665-1 Nakano-machi, Hachioji, Tokyo 192-0015, Japan. E-mail: shiro-seki@cc.kogakuin.ac.jp; Fax: +81-42-628-4568; Tel: +81-42-628-4568
First published on 19th July 2023
Abstract
To precisely evaluate the electrochemical properties of a battery of active material, we proposed a “concentration shift experiment” using single-particle electrochemical measurement (SPEM) and a diluted electrode sheet (DES). SPEM can be used for information, such as the charge–discharge and resistance properties of only the active material (extremely dilute condition: ≈0). DES consists of concentrations varying from 1% to 100% of the active material (LiCoO2) and inactive material (α-Al2O3), electrically conductive additive and binder polymer onto an Al current collector. The resistance components derived from the LiCoO2 single particles were measured and calculated. Their apparent activation energy (Ea) was 27 kJ mol−1, which is relatively low compared with the applied-type sheet electrode (30–60 kJ mol−1). Simple electric/ionic conductive route was analyzed using SPEM cell, and the fundamental LiCoO2 originated Ea could be calculated. Resistance components attributed to LiCoO2 were also measured and extracted by alternating current impedance measurements using DES. The resistance non-linearly decreased with LiCoO2 concentration, and the percolation and inhomogeneity of LiCoO2 particles were suspected. The planful isolation of an active material particle should be critical for the overall information on an electrode particle.
1. Introduction
Recently, Li-ion batteries (LIBs) have reached a practically usable stage for consumer use (laptop PC and smartphone), transportation (electric vehicle),1,2 and large-scale energy storage devices for unstable renewable energy and are expected to be a key technology in the realization of a low-carbon society.3–6 In general, energy densities, such as electrical capacity, operating voltage, and input–output properties, are among the most critical parameters for the improvement of LIBs to expand the usage of battery systems. Therefore, various approaches for battery improvement have been explored by analyzing each component (positive and negative electrodes and electrolytes) and their combinations and optimizations.7–9 In particular, electrode active material particles always act as charge–discharge media, which converts between chemical and electrical energies with electrolyte-mediated conditions in electrochemical cells. However, electrode materials used in conventional LIBs are usually prepared as composite materials and also consist of active materials, electrically conductive additives based on carbon materials, and binders based on good bonding/forming polymer materials. Composite electrode materials pose various difficulties, not only for the precise electrochemical observation of active materials but also for the correct evaluations of capacity and resistance degradations for LIBs by the inhomogeneous reaction distributions of thickness/in-plane directions with charge–discharge operations.10–12 Therefore, electrochemical analysis methods for evaluating the charge–discharge behaviour and reactive uniformity of active materials will be critical apart from the electrochemical properties of functional materials to extract the factors governing battery performance.To obtain quantitative electrochemical information on the electrode of active materials, single-particle (SP) electrode measurements (SPEMs) method have been proposed using positive active material LiCoO2 (LCO).13–17 A microprobe is directly attached to the SP and electrochemically operated for SPEM measurements, and charge–discharge behaviour and resistance properties are originated by an electrode particle as the “smallest” cell system without other components. Dokko et al. reported the electrochemical properties of LCO-SP during the intercalation/deintercalation processes of Li ions in LCO.13 We also recorded a ‘‘concentration shift experiment’’ by comparing the resistance components between SPEM cells and coin cells (Fig. 1), which enabled the reasonable estimation of particle counts in electrode sheets.15 In addition, Ariyoshi et al. reported the diluted electrode sheet (DES) method using inactive inorganic particles having similar morphologies as “quasi” components in electrode sheets and clarified the rate properties of Li[Li0.1Al0.1Mn1.8]O4.18 In this study, the reaction processes (including reaction and transport routes) of LCO were investigated from the viewpoint of concentration shift of active materials using both SPEM (infinitely dilute condition of active materials) and DES methods by varying the LCO/α-Al2O3 contents and their resistance components attributed to LCO were evaluated using alternating current (AC) impedance measurements.19–21 Therefore, we investigated the consistency and uniformity of the SPEM and DES methods in terms of resistance and frequency (time constant) components.
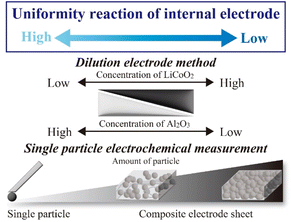 | ||
| Fig. 1 Image of the analysis of active material using dilute electrode sheet and single-particle electrochemical measurement. | ||
2. Experimental
2.1 Preparation of microelectrodes and measurement of SPEM cells
To prepare the microelectrode for the measurements,13 a glass capillary (G-100L, inside diameter: 0.75 μm, Narishige) was heated and pulled using a puller (Narishige, PC-10) and obtained acuate apex. Thin Pt wire (ϕ 30 μm, Nilaco) and thick Cu wire (ϕ 0.1 mm, Nilaco) were welded using a spot welding machine (KTH-MWS, Kondo Tech) to obtain self-standing metal wires. The hybridized wire was inserted into the glass capillary to the melted apex and was fused using a microforge (MF-900, Narishige). For accurate electrical contact with the active material particle, the microelectrode tip was polished at 45° using a rotary polishing machine (EG-402, Narishige). Fig. 2(a) shows a schematic image of the SPEM system used in this study, and electrochemical measurements were carried out in an argon-filled glovebox (DBO-1B, Miwa Manufacturing, [O2] < 10 ppm, dew point < 193 K). A Li foil disk (ϕ 12 mm, Honjo Metal) was attached to a stainless steel cup as the negative (counter and reference) electrode. LiCoO2 particles (Honjo Chemical) were dispersed onto a glass filter (GC-50, Advantec) as the positive (working) electrode. The electrolyte, comprising 1.0 mol kg−1 LiN(SO2F)2 (LiFSA, Nippon Shokubai)/ethylene carbonate (EC) electrolyte solution, was dropped onto this two-electrode cell for SPEM. After that, the prepared microelectrode and an LCO particle were attached. Electrical conduction confirmed under observation with a digital microscope, and various electrochemical measurements were conducted.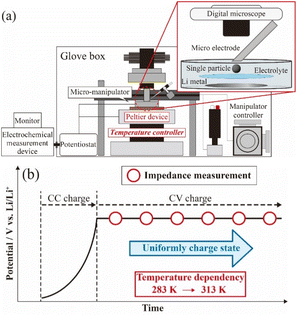 | ||
| Fig. 2 Equipment setup of single particle electrochemical measurement (a), experimental flow of AC impedance measurement (b). | ||
2.2 Preparation of dilute-type applied electrode sheet and coin cell
To investigate the concentration effect for active materials of the electrode sheet, an applied-type electrode sheet containing various concentrations of LCO as active material and α-Al2O3 as a blank material was used. A slurry in which LCO and α-Al2O3 particles (Koujundo Chemical), acetylene black (Li-100, AB, Denka), and polyvinylidene fluoride (PVdF, Kureha) were mixed at a mass ratio of 84![[thin space (1/6-em)]](https://www.rsc.org/images/entities/char_2009.gif) :
:![[thin space (1/6-em)]](https://www.rsc.org/images/entities/char_2009.gif) 10
10![[thin space (1/6-em)]](https://www.rsc.org/images/entities/char_2009.gif) :
:![[thin space (1/6-em)]](https://www.rsc.org/images/entities/char_2009.gif) 6 = (LCO + α-Al2O3)
6 = (LCO + α-Al2O3)![[thin space (1/6-em)]](https://www.rsc.org/images/entities/char_2009.gif) :
:![[thin space (1/6-em)]](https://www.rsc.org/images/entities/char_2009.gif) AB
AB![[thin space (1/6-em)]](https://www.rsc.org/images/entities/char_2009.gif) :
:![[thin space (1/6-em)]](https://www.rsc.org/images/entities/char_2009.gif) PVdF was applied to an Al foil current collector. In addition, the weight ratio (wt%) of LCO toward (LCO + α-Al2O3) was varied using 1.0, 5.0, 10, 20, 40, 60, 80, and 100 wt% by using a paste mixer (UM-113S, Japan Unix). Then, N-methyl-2-pyrrolidone was added to ensure a homogeneous slurry and reduce the mixture viscosity. The prepared electrode sheets were dried for 12 h in a thermostatic oven at 333 K under vacuum conditions, pressed and punched into ϕ 16 mm diameter disks (average porosity: ca. 60%, SEM images: Fig. S1†). [Li|electrolyte|LCO electrode sheet] cells were prepared by encapsulating the prepared electrode sheet, a glass separator (GA-55, Advantec), 1.0 mol kg−1 LiFSA-EC electrolyte solution, and Li metal in a 2032-type coin cell in an argon-filled glovebox.
PVdF was applied to an Al foil current collector. In addition, the weight ratio (wt%) of LCO toward (LCO + α-Al2O3) was varied using 1.0, 5.0, 10, 20, 40, 60, 80, and 100 wt% by using a paste mixer (UM-113S, Japan Unix). Then, N-methyl-2-pyrrolidone was added to ensure a homogeneous slurry and reduce the mixture viscosity. The prepared electrode sheets were dried for 12 h in a thermostatic oven at 333 K under vacuum conditions, pressed and punched into ϕ 16 mm diameter disks (average porosity: ca. 60%, SEM images: Fig. S1†). [Li|electrolyte|LCO electrode sheet] cells were prepared by encapsulating the prepared electrode sheet, a glass separator (GA-55, Advantec), 1.0 mol kg−1 LiFSA-EC electrolyte solution, and Li metal in a 2032-type coin cell in an argon-filled glovebox.
2.3 Electrochemical evaluations for SPEM and coin cells
To evaluate the electrochemical properties of LCO-SPs, charge–discharge and AC impedance measurements were examined following the scheme as shown in Fig. 2(b). An SP of LCO (diameter: ca 20–30 μm) was charged to 3.95 V vs. Li/Li+ under 3 nA constant-current and then charged at a constant-voltage for more than 1200 s (current decayed less than 300 pA) at ambient temperature. AC impedance measurements were performed in the frequency range of 20 kHz to 10 mHz at 3.95 V vs. Li/Li+ under an applied voltage of 50 mV at temperatures of 283.9, 286.8, 293.0, 297.5, 302.9, 308.0, and 313.3 K using a specially attached Peltier unit (Fig. S2†). By contrast, the prepared coin cells were also charged to 3.95 V vs. Li/Li+ under 20 μA (10 μA cm−2) constant-current constant-voltage condition, and AC impedance measurements were performed in the frequency range of 500 kHz to 10 mHz at 3.95 V vs. Li/Li+ under an applied voltage of 200 mV at 303.2 K.3. Results and discussion
3.1 Electrochemical measurements for LiCoO2 single particles
To evaluate the correlation between temperature and the resistance properties of charged LCO-SPs (LixCoO2: x < 1.0), the temperature dependence of AC impedance spectra of SP electrode cells was measured. The temperature dependence of impedance spectra for [Li|electrolyte|LCO-SP] cell at 3.95 V vs. Li/Li+ are shown in Fig. 3(a). A semicircular arc (500 Hz to 1.26 kHz) was observed for each spectrum, which suggested several resistance components derived from the bulk of LCO-SP and Li+ transfer at the electrode/electrolyte interface13 owing to their slight asymmetry properties for the overlapped time constant of each reaction/transfer process. The decrease in diameter for the obtained semicircular arcs was confirmed with temperature increase, as in the case of applied-type electrode sheets22,23 attributed to the acceleration of Li+ transfers and decrease in resistance. Moreover, the resistance component suggesting a Warburg component inclining 45° was confirmed, and their temperature dependences were also smaller than for the low-frequency semicircular arc. Therefore, the inclining Warburg component might be considered, for example, solid-electrolyte-interphase film resistance by the oxidative decomposition of the electrolyte solution with LCO charging. In this case, the resistance component derived from Li metal interfaces should be negligible because of their differences in the physical reaction area of electrodes (Li metal: ca. 2 cm2). In addition, the response current should passage into/surface LCO-SP, which differs from the case of applied sheets containing, for example, electrically conductive additive and binder polymer (several conducting routes). Thus, the obtained temperature dependences of impedance spectra were assumed reflecting the electrochemical responses of only LCO-SP.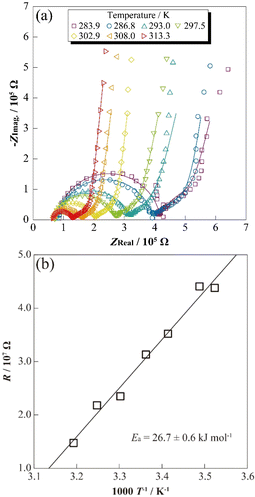 | ||
| Fig. 3 Nyquist plots for a single-particle LiCoO2 in a SPEM cell at 286.8–313.3 K (a), Arrhenius plots of resistance for a LiCoO2 single particle (b) at 3.95 V vs. Li/Li+. | ||
To separate the resistance components of impedance spectra for the [Li|electrolyte|LCO-SP] cell, the equivalent circuit described by eqn (1) was assumed, and a fitting analysis was performed.
| LS1/RS1 + RS2 + QS3/RS3 + QS4/RS4 + QS5/RS5, | (1) |
k = A![[thin space (1/6-em)]](https://www.rsc.org/images/entities/char_2009.gif) exp(−Ea/RT), exp(−Ea/RT),
| (2) |
3.2 Evaluation of the concentration effect for LiCoO2 electrode sheet
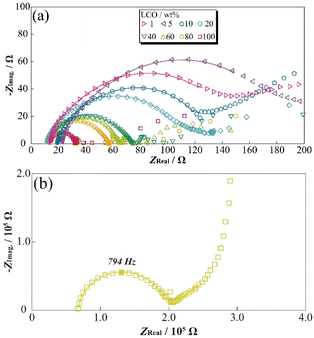
To evaluate the concentration effect on the applied electrode sheet, DESs18,27 were prepared by mixing α-Al2O3 powder as the inactive materials with varying LCO concentrations. The prepared [Li metal|electrolyte|LCO-DES] cells were charged to 3.95 V vs. Li/Li+, and then AC impedance measurements were attempted at 3.95 V vs. Li/Li+. A stable electrode plateau was obtained around 3.92 V vs. Li/Li+, which attributed to the charging process (deintercalation) of LCO, even though the charge capacity of DES monotonically decreased with the Al2O3 amount (Fig. S3†). Fig. 4(a) shows the LCO concentration dependences for the impedance spectra of [Li metal|electrolyte|LCO-DES] cells at 303.2 K. A semicircular arc was observed from each impedance spectrum (ca. 500 Hz–1.26 kHz) and was also shifted to asymmetric shape and high resistance in the low-frequency region with an increase in the α-Al2O3 amount. From the previous studies,28,29 the impedance spectra of LCO positive electrode and Li metal negative electrode can be separated at low- and high-frequency using the differences of each time constant for the reactions. Therefore, changes in the semicircular arc at low-frequency might suggest a decrease in absolute reaction area for LCO by the introduction of α-Al2O3 as a fake electrode particle. Fig. 4(b) also shows the impedance spectra of a [Li|electrolyte|LCO-SP] cell at 303.2 K, which exhibited a highly symmetric semicircular arc about 1000 times larger than for [Li metal|electrolyte|LCO-DES] cells owing to their differences in the absolute amount of LCO.To clarify the effect of LCO concentration on the electrode sheet for the time constant of electrode reactions, relationships between the LCO content of DES and apex frequency related to the time constant are shown in Fig. 5(a). The apex frequency decreased with decreasing LCO concentration in [Li metal|electrolyte|LCO-DES] cells with minimum local region (1–10 wt%, percolated concentration of LCO). Therefore, the change in LCO concentration affected not only the interfacial resistance related to the reaction area but also the reaction speed (processes) of the electrode reactions owing to their inclusion of electric, conductive, additive, and binder polymer (length of reaction route). In addition, in the case of less than 40 wt% of LCO, the [Li metal|electrolyte|LCO-DES] cells exhibited higher apex frequency than the [Li|electrolyte|LCO-SP] cell (yellow dashed line as shown at x ≈ 0). Changes in frequency properties should be correlated with the reaction processes of LCO (contribution of Li metal might not be included) and approach to the phenomena of the SP by decreasing the LCO amount and concentrations. In particular, slight apex frequency (less than 40 wt% of LCO) suggested a change in electron/lithium conducting path and interface at the electrode/electrolyte boundary, including another component such as electrically conductive additive and binder polymer. To analyze changes in the resistance components from the observed semicircular arc of the impedance spectra, fitting analyses were performed using the following eqn (3) to obtain well-fitted parameters for analysis,
| R1 + Q2/R2 + Q3/R3 + Q4/R4, | (3) |
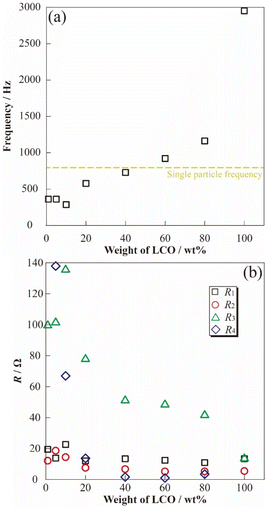 | ||
| Fig. 5 Correlation of active material ratio and frequency dependences (a), each resistance component (b) at 3.95 V vs. Li/Li+. | ||
4. Conclusions
The precise reactive resistance of LCO was evaluated by AC impedance measurement using SPEM and DES cells with the varying ratios of LCO and α-Al2O3. The results of this study are summarized as follows:(1) Arrhenius-type plots of resistance component derived from LCO-SP (RLCO-SP) exhibited clear linear trends against inverse temperature, and the calculated Ea was 26.7 ± 0.6 kJ mol−1. A relatively low Ea value was obtained by the simple electric/ionic conductive route differing from the conventional electrode sheets, which consists of other materials.
(2) Resistance components attributed to positive active materials, were well separated into two components (R3 and R4) in [Li metal|electrolyte|LCO-DES] cells. The existence of R4 was confirmed at less than 20 wt% of LCO, although R4 was also not observed at 100 wt%. Therefore, R4 was suggested as the parameter for the electric/ionic route (continuous phase) and its uniformity in the electrode sheet. By contrast, R3 decreased with LCO concentrations and was firmly dependent on reactive area and the number of LCO particles.
As mentioned earlier, a correlation investigation of SPEM and DES measurements enabled a unified electrochemical analysis of electrode active materials for battery systems. In the future, we will report the SPEM and DES results using another active material for the negative electrode (Li4Ti5O12 and C6), chemically additive, and spectroscopic analysis by Raman spectroscopy to determine the active/inactive part of electrode materials, such as both the SP and electrode sheet.
Conflicts of interest
There are no conflicts of interest to declare.Acknowledgements
This work was partially supported by the Intensive Support for Young Promising Researchers Program (WAKASAPO) of the New Energy and Industrial Technology Development Organization (NEDO) and the Precise Measurement Technology Promotion Foundation, Japan.References
- A. Yoshino, Angew. Chem., Int. Ed., 2012, 51, 5798–5800, DOI:10.1002/anie.201105006.
- M. A. Hannan, M. S. H. Lipu, A. Hussain and A. Mohamed, Renewable Sustainable Energy Rev., 2017, 78, 834–854, DOI:10.1016/j.rser.2017.05.001.
- B. Obama, Science, 2017, 355, 126–129, DOI:10.1126/science.aam6284.
- M. Z. Jacobson, Energy Environ. Sci., 2009, 2, 148–173, 10.1039/b809990c.
- H. Yao, G. Zheng, W. Li, M. T. McDowell, Z. Seh, N. Liu, Z. Lu and Y. Cui, Nano Lett., 2013, 13, 3385–3390, DOI:10.1021/nl401729r.
- X. Zhang, A. Chen, M. Zhong, Z. Zhang, X. Zhang, Z. Zhou and X. H. Bu, Electrochem. Energy Rev., 2019, 2, 29–104, DOI:10.1007/s41918-018-0024-x.
- J. N. Reimers and J. R. Dahn, J. Electrochem. Soc., 1992, 139, 2091–2097, DOI:10.1149/1.2221184.
- K. Kang, Y. S. Meng, J. Bréger, C. P. Grey and G. Ceder, Science, 2006, 311, 977–980, DOI:10.1126/science.1122152.
- H. Zheng, J. Li, X. Song, G. Liu and V. S. Battaglia, Electrochim. Acta, 2012, 71, 258–265, DOI:10.1016/j.electacta.2012.03.161.
- L. Y. Beaulieu, T. D. Hatchard, A. Bonakdarpour, M. D. Fleischauer and J. R. Dahn, J. Electrochem. Soc., 2003, 150, A1457, DOI:10.1149/1.1613668.
- D. Liu, Z. Shadike, R. Lin, K. Qian, H. Li, K. Li, S. Wang, Q. Yu, M. Liu, S. Ganapathy, X. Qin, Q. H. Yang, M. Wagemaker, F. Kang, X. Q. Yang and B. Li, Adv. Mater., 2019, 31, 1–57, DOI:10.1002/adma.201806620.
- R. Xiong, Y. Yu, S. Chen, M. Li, L. Li, M. Zhou, W. Zhang, B. yan, D. Li, H. Yang, Y. Zhang and H. Zhou, J. Power Sources, 2023, 553, 232296, DOI:10.1016/j.jpowsour.2022.232296.
- K. Dokko, M. Mohamedi, Y. Fujita, T. Itoh, M. Nishizawa, M. Umeda and I. Uchida, J. Electrochem. Soc., 2001, 148, A422, DOI:10.1149/1.1359197.
- K. Nishikawa, N. Zettsu, K. Teshima and K. Kanamura, J. Electroanal. Chem., 2017, 799, 468–472, DOI:10.1016/j.jelechem.2017.06.042.
- T. Saito, K. Nishikawa, T. Nakamura and S. Seki, J. Phys. Chem. C, 2020, 124, 16758–16762, DOI:10.1021/acs.jpcc.0c02881.
- G. Richardson, I. Korotkin, R. Ranom, M. Castle and J. M. Foster, Electrochim. Acta, 2020, 339, 135862, DOI:10.1016/j.electacta.2020.135862.
- C. Heubner, U. Langklotz, C. Lämmel, M. Schneider and A. Michaelis, Electrochim. Acta, 2020, 330, 135160, DOI:10.1016/j.electacta.2019.135160.
- K. Ariyoshi, S. Mizutani and Y. Yamada, J. Power Sources, 2019, 435, 226810, DOI:10.1016/j.jpowsour.2019.226810.
- D. Aurbach, J. Power Sources, 2000, 89, 206–218, DOI:10.1016/S0378-7753(00)00431-6.
- T. Osaka, D. Mukoyama and H. Nara, J. Electrochem. Soc., 2015, 162, A2529–A2537, DOI:10.1149/2.0141514jes.
- R. Ruffo, S. S. Hong, C. K. Chan, R. A. Huggins and Y. Cui, J. Phys. Chem. C, 2009, 113, 11390–11398, DOI:10.1021/jp901594g.
- I. Yamada, K. Miyazaki, T. Fukutsuka, Y. Iriyama and T. Abe, J. Power Sources, 2015, 294, 460–464, DOI:10.1016/j.jpowsour.2015.06.108.
- A. S. Keefe, S. Buteau, I. G. Hill and J. R. Dahn, J. Electrochem. Soc., 2019, 166, A3272, DOI:10.1149/2.0541914jes.
- R. Tatara, P. Karayaylali, Y. Yu, Y. Zhang, L. Giordano, F. Maglia, R. Jung, J. P. Schmidt, I. Lund and Y. Shao-Horn, J. Electrochem. Soc., 2019, 166, A5090–A5098, DOI:10.1149/2.0121903jes.
- M. Takahashi, S. Tobishima, K. Takei and Y. Sakurai, Solid State Ionics, 2002, 148, 283–289, DOI:10.1016/S0167-2738(02)00064-4.
- J. Wang and X. Sun, Energy Environ. Sci., 2012, 5, 5163–5185, 10.1039/c1ee01263k.
- K. Ariyoshi, M. Tanimoto and Y. Yamada, Electrochim. Acta, 2020, 364, 137292, DOI:10.1016/j.electacta.2020.137292.
- B. Zhang, X. Qin, G. R. Li and X. P. Gao, Energy Environ. Sci., 2010, 3, 1531–1537, 10.1039/c002639e.
- D. Aurbach, B. Markovsky, I. Weissman, E. Levi and Y. Ein-Eli, Electrochim. Acta, 1999, 45, 67–86, DOI:10.1016/S0013-4686(99)00194-2.
Footnote |
| † Electronic supplementary information (ESI) available. See DOI: https://doi.org/10.1039/d3ra03630h |
| This journal is © The Royal Society of Chemistry 2023 |

