DOI:
10.1039/D3RA03633B
(Paper)
RSC Adv., 2023,
13, 24343-24352
Easy fabrication of L-glutamic acid/ZnS composites for efficient photo-catalytic and supercapacitor performance†
Received
30th May 2023
, Accepted 3rd August 2023
First published on 14th August 2023
Abstract
L-Glutamic acid/ZnS (L-GA/ZnS) composites were prepared by varying the amount of ZnS addition ranging from 1–5 wt% by means of an easy solvent casting approach. The morphological investigation, antimicrobial activity, photocatalytic enactment, and electrochemical properties of the composites were evaluated. The formation of L-GA/ZnS composites was confirmed by FTIR, UV-Vis, and photoluminescence (PL) spectroscopy. Besides, FTIR, UV-Visible, and PL data revealed the possible incorporation of ZnS into L-GA. The L-GA/ZnS composites demonstrated similar plate-like structure of L-GA with agglomerated ZnS morphology on the plate surface with diameter in the range of 50–500 nm, confirmed by FESEM/EDS measurements. The prepared composites showed excellent photocatalytic depiction towards methylene blue (MB) degradation in comparison to L-GA and ZnS. A set of supercapacitor devices were fabricated using L-GA/ZnS composites. The performance of the supercapacitor was assessed by GCD and exhibited good energy storage capacity. The prepared composites showed promising prospects for hybrid supercapacitor application. These outcomes may offer new insight into the fabrication of L-GA/ZnS composites as photocatalysts for organic contaminants treatment.
1 Introduction
The world is experiencing growing demand for energy and unavailability of freshwater due to fast industrialization, suburbanization, mismanagement and population growth.1,2 The quality of drinking water is lowered because of the existence of poisonous organic pollutants, which also have an impact on the health of humans and the aquatic environment. In order to mitigate the effects of this issue, a number of different approaches have been implemented, like removing organic dyes from wastewater.3–5 Photocatalysis is one of the various ways, and it is considered one of the most promising technologies due to the fact that it is simple, inexpensive, and has a relatively high level of effectiveness.3–6 In this direction, a variety of metal sulfides have been employed as photocatalysts, including cadmium-sulfide (CdS), copper-sulfide (CuS), and zinc-sulfide (ZnS).7 Among them, ZnS is a very promising II–VI semiconductor that makes electron–hole pairs quickly. Besides, ZnS is a better photocatalyst than other conventional materials because of its wide band gap.8,9 Due to its considerable negativity in the conduction band and high projected effectiveness for the production of photocarriers, ZnS has become a promising material for next-generation solar cells, batteries and a superior photocatalyst.10–12 Regarding the synthesis of composites, a simple solvent casting method makes it easy to interact with ZnS and a solid amino acids with interesting properties.12 In particular, the carboxyl and amino groups present in amino acids make them excellent candidates for the synthesis of composite materials with metal sulfide, such as zinc sulfide (ZnS).13 This method of synthesis is extremely effective for accumulating dopant compounds such as ZnS on amino acids such as L-glutamic acid (L-GA) in order to improve their photoluminescence (PL), antimicrobial, photocatalytic properties, and supercapacitors.14 As such, the addition of ZnS to a host material like L-GA to form composites may have better luminescence properties, photocatalytic and supercapacitor performance than L-GA. As a result of the ZnS on the L-GA, it may possible to prevent electron–hole recombination, which makes the composites an effective photo-catalyst.15
To date, only very few studies can be found on the use of amino acid-based ZnS materials for the identification of biological samples 16,18 but until today, no report has been found on dye-containing waste-water treatment as well as super-capacitor applications. Further, to the best of our knowledge, there are no detailed reports about the production of L-GA/ZnS composites through an easy solvent casting technique and their use in photocatalytic dye degradation, especially for dealing with wastewater for purification and antimicrobial capabilities against Escherichia coli-like bacteria, and supercapacitor applications. The photodegradation of the model pollutant methylene blue (MB) in the presence of sunlight has been discussed in this study. This research work concentrates on the fabrication of L-GA/ZnS solid composites and evaluating their usefulness towards the mineralization of MB with sunlight from wastewater and their antimicrobial activities against bacteria such as E. coli as well as supercapacitor applications.
2 Experimental section
2.1 Materials
Merck supplied L-GA (Mw = 148.14), zinc chloride (ZnCl2), sodium thiosulfate (Na2S2O3), and methylene blue (MB). More than 99.5% pure acetone ((CH3)2CO) was provided by Sigma-Aldrich. As received chemicals were in analytical grades and used without further purification.
2.2 Synthesis of L-GA/ZnS composites
L-GA/ZnS composites were fabricated utilizing a facile solvent casting method.16 In a similar fashion, ZnS composites were synthesized without the inclusion of L-GA. The typical procedure involves dissolving a known amount of L-GA (0.5 g) in 25 mL of double-distilled water and then heating the mixtures at 60 °C through continuous stirring for 1 hour until they become completely soluble. After that, 0.01 M (10 mL) of ZnCl2 solution was added to the previously prepared L-GA solution. The mixture was then stirred for 2 hours at 60 °C. After stirring the mixture (L-GA and ZnCl2) for one hour at 60 °C, 0.01 M (10 mL) of Na2S2O3 solution was added to the L-GA-capped ZnCl2 mixture. Then, for an additional two hours, the reaction mixture was stirred. Finally, the composites were obtained through casting, which involves pouring the solution into a glass plate. The schematic formation of L-GA/ZnS composites is shown in Fig. 1.
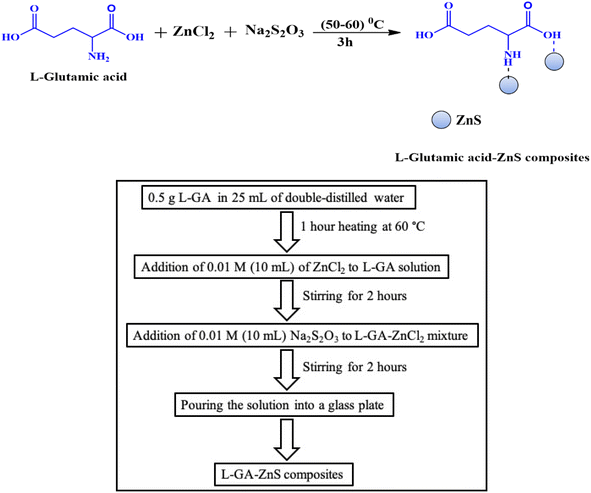 |
| | Fig. 1 Schematic illustration and reaction scheme for the synthesis of L-GA/ZnS composites. | |
The homogeneous composites were obtained after drying at room temperature for at least 48 hours, free from air bubbles, with uniformly dispersed ZnS particles. Three different batches were synthesized in an identical way by only varying the composition of ZnS ranging from 1 to 5 wt% (Table 1).
Table 1 Synthesis identifier, composition of the ZnS used in synthesis process and types of products are listed in the table below
| Synthesis identifier |
Amount of ZnS (wt%) |
Types of products |
| L-GA/ZnS-1 |
1 |
Composites |
| L-GA/ZnS-2 |
3 |
Composites |
| L-GA/ZnS-3 |
5 |
Composites |
2.3 Characterization
The FTIR measurements of L-GA and L-GA/ZnS composites were obtained ranging from 400 and 4000 cm−1 by using the Shimadzu-FTIR prestige-21 spectrometers with the KBr pellet technique. The UV-Vis spectra as well as the absorbance of dye in solution were carried out using a Shimadzu UV-1800 spectrometer ranging from 200–800 nm. From the UV-Vis data, the band gap was calculated using the formula E = hc/λ, where E is the energy across the band gap, c is the speed of light, h is the Planck constant and λ is the wavelength at which absorption is maximized.17 The luminescence properties were evaluated by PL spectroscopy at room temperature using on Shimadzu RF-3501pc spectrofluorometer.
2.4 Photocatalytic experiments
Perceiving the photo-degradation of the MB dye under constant sunlight irradiation was used to evaluate the photocatalytic potential of the produced L-GA/ZnS composites. All the photocatalytic tests were conducted under identical conditions, with consistent levels of sunlight exposure. The L-GA, ZnS, and synthesized composites photocatalysts (20 mg) were taken in 100 mL of MB solution (C0 = 2 mg L−1). The mixture was stirred in a dark for 30 minutes to achieve an adsorption–desorption balance. It was then exposed to direct sunlight while being constantly stirred. After a set period of time, the mixture was centrifuged, and the absorbance of the MB solution was measured at 654 nm using a UV-Vis spectrophotometer. The photo-degradation efficiency was found using the following equation:| |
 | (1) |
where, C0 and Ct are the concentration of MB (mg L−1) at initial and at time t, respectively.17
2.6 Construction of the supercapacitor device
An asymmetric hybrid supercapacitor was constructed using the copper sheet as the current collector and microporous Whatman paper as a separator between two electrodes, anode and cathode. The complete system was squeezed between two current collectors which worked as terminals in the charging and discharging process.18 As a current collector, cheap and commercially available aluminum foil was employed. Activated charcoal served as the anode, L-GA/ZnS composites were utilized as the cathode material, and a 0.5 M sodium sulfate aqueous solution was employed as the electrolyte. The L-GA/ZnS composites were blended with ammonium peroxidisulphate (APS) and cobalt oxide to prepare 30 cm2 size rectangular shaped positive electrode, and activated charcoal was used as the negative electrode. The electrode thickness was about 0.2 mm. Then, the electrode was dried properly and the separator was immersed into the electrolytic solution and appropriately placed between the anode and cathode (Fig. 2). A series of four identical cells were constructed and connected in a series. The developed device was charged with a DC load bank (voltage of 5 V) and connected with a 5 mm LED bulb to discharge (forward current of 20 mA, voltage of 2 V, and power 0.04 W). The performance of the developed supercapacitor was assessed by the galvanostatic charge–discharge method (GCD) in terms of capacitance, energy density, and power density. Specific capacitance (F g−1), energy density (W h kg−1), and power density (W kg−1) were calculated by the following eqn (2)–(4), respectively.18| | |
Specific capacitance, C = It/mΔV
| (2) |
where, C indicates capacitance (F g−1), I symbolizes current, t refers to the time of discharge (s), ΔV is the voltage difference, and m denotes the weight. As the GCD curve is found nonlinear, energy density is calculated following eqn (3).| |
 | (3) |
where, E designates the energy density (W h kg−1), M indicates total mass of electrode, I and V signifies voltage. Power density (W kg−1) is determined by the following eqn (4).| |
 | (4) |
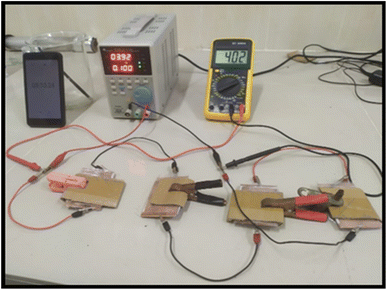 |
| | Fig. 2 Experimental setup of fabricated supercapacitor. | |
3 Results and discussion
3.1 FTIR Spectra and analysis
The FTIR spectra of the prepared samples were taken to identify the major peaks of ZnS, L-GA, and L-GA/ZnS composites and presented in Fig. 3. For the spectrum of L-glutamic acid (Fig. 2), a broad and intense peak between 3200 and 3600 cm−1, peaking at 3464 cm−1 was identified which is characteristic of the hydroxyl functional group of L-GA.19 L-GA has both intermolecular and intramolecular H-bonds, which are the source of this type of vibrational peak.19,20 After then, there is a significant absorption at 3062 cm−1 due to N–H stretching. The FTIR spectrum showed bands at 1124 cm−1, 1643 cm−1, 864 cm−1, 1419 cm−1, and 1512 cm−1 are assigned to the C–C stretching, C![[double bond, length as m-dash]](https://www.rsc.org/images/entities/char_e001.gif) O stretching, C–N stretching, N–H stretching, and CH2 bending, respectively.19,20 The characteristics peak of ZnS was observed at 667 cm−1 (Fig. 3). When ZnS interact with L-GA, the hydroxyl group peak of L-GA (3464 cm−1) were subtly shifted (3487–3510 cm−1) for all composite samples.18 In the FT-IR spectra of all L-GA/ZnS composite samples, the occurrence of characteristics peak of ZnS at (670–690 cm−1) indicated the successful incorporation of ZnS in L-GA. Such results indicate the successful formation of L-GA/ZnS composites. Hence, the incorporation of ZnS in the L-GA/ZnS composites evidenced by the FT-IR analysis.
O stretching, C–N stretching, N–H stretching, and CH2 bending, respectively.19,20 The characteristics peak of ZnS was observed at 667 cm−1 (Fig. 3). When ZnS interact with L-GA, the hydroxyl group peak of L-GA (3464 cm−1) were subtly shifted (3487–3510 cm−1) for all composite samples.18 In the FT-IR spectra of all L-GA/ZnS composite samples, the occurrence of characteristics peak of ZnS at (670–690 cm−1) indicated the successful incorporation of ZnS in L-GA. Such results indicate the successful formation of L-GA/ZnS composites. Hence, the incorporation of ZnS in the L-GA/ZnS composites evidenced by the FT-IR analysis.
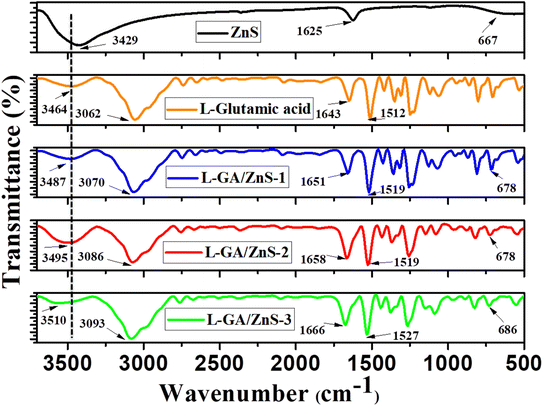 |
| | Fig. 3 FTIR spectra of ZnS, L-GA and L-GA−ZnS composites. | |
3.2 UV-visible spectra and analysis
Analysis of the interaction between ZnS and L-GA and the use of ultraviolet-visible spectroscopy data allowed us to calculate the band gap (Fig. 4). In comparison to L-GA, which displays its distinctive band at a wavelength of 257 nm, the composites show an absorption band at 272 nm.17 The relevance of the interactions between the two substances has been revealed by the red shift in the absorption spectrum as seen in Fig. 4. The L-GA's interaction with other inorganic materials resulted in similar absorption peaks, as previously described in ref. 20. The absorption maxima were located in the 265–280 nm and 264 nm ranges for L-GA/ZnS composites and pure ZnS, respectively. Such results further indicate the interaction between ZnS and L-GA, thus the formation of L-GA/ZnS composites. The band gap of each sample was calculated using UV-Vis data. The calculated values of 4.70 eV was found for ZnS, and the anticipated value for the composite samples was 4.43–4.68 eV. The results of this calculation for the ZnS band gap are in reasonable agreement with those published in the scientific literature.21 The interaction of ZnS with L-GA considerably altered the sample's light-absorption properties, as indicated by the band gap of composite samples. Band gap widens and absorption maxima rise in L-GA/ZnS composites. In synthesized composites, an increase in ZnS's light-gathering ability is anticipated to account for a redistribution of absorption maxima toward the visible spectrum.7 On the basis of these results, we propose that L-GA/ZnS composites may be more effective at photodegradation when compared to Glutamic acid alone.
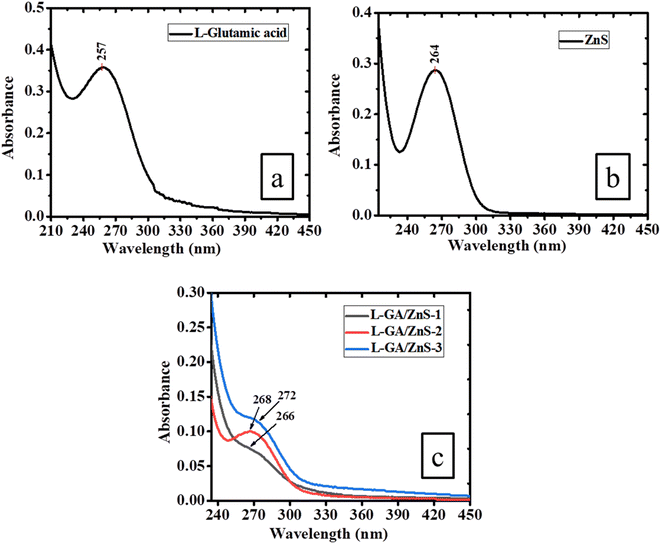 |
| | Fig. 4 UV-Vis spectra of (a) L-GA, (b) ZnS and (c) L-GA/ZnS composites. | |
3.3 Photoluminescence spectroscopy
Fig. 4 illustrates the PL spectra of L-GA, ZnS, and L-GA/ZnS composites at room temperature at an excitation wavelength of 280 nm. Specifically, between 380 and 420 nm, L-GA displayed a strong PL emission, with a peak at 403 nm (Fig. 5a). The π* → n electronic transition for the –OH group of L-GA is responsible for this emission, and its intensity is anticipated to vary depending on the OH groups' relative positions within the molecule.21 In Fig. 5b, ZnS has a wide emission spectrum with a peak at 397 nm. The ZnS surface sulfur vacancies are the source of this emission.22 In a similar vein, other researchers have discovered emissions from ZnS due to surface defect states such as sulfur vacancies.23,24 L-GA/ZnS composites show two prominent peaks at 365–385 and 410–440 nm (Fig. 5c).
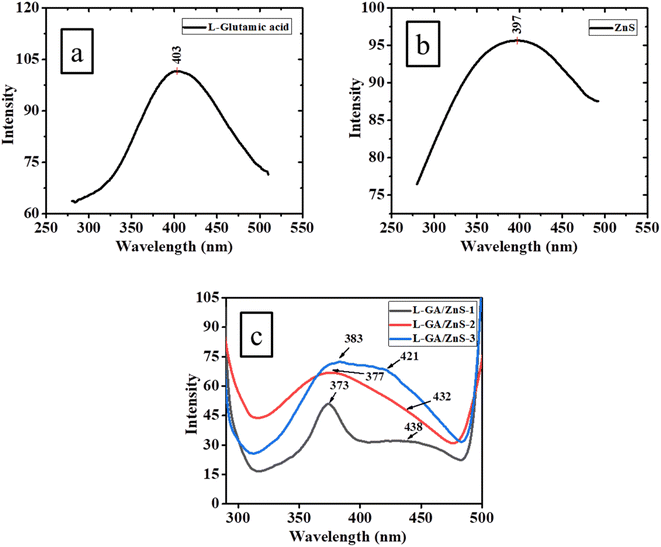 |
| | Fig. 5 PL spectra of (a) L-GA, (b) ZnS and (c) L-GA/ZnS composites. | |
Consequently, the peak emission has to red-shifted in all samples relative to L-GA, which has a broad-band blue emission. The results of these investigations show that L-GA may include ZnS and that this insertion rearranges the delocalized n-electrons of OH groups in the backbone of L-GA. These results are consistence with the preceding descriptions.25 Blue emissions detected in the composites is attributed to the recombination of electrons between the vacant donor level of sulfur and the vacant acceptor level of zinc.8 Also, as shown in the PL spectra, all composite samples had higher intensities than L-GA (Fig. 5). It is possible that the ability of n-type ZnS to capture electrons and let more holes recombine at the L-GA and ZnS interface is responsible for this enhancement. From these data, we may predict that L-GA/ZnS composite films may be suitable materials for LEDs, batteries, and solar cells.
3.4 Structural analysis
The morphological structures of the L-GA, ZnS, and L-GA/ZnS composites were captured from FESEM images as presented in Fig. 6. The plate-like structures and spherical-aggregates morphology for L-GA and ZnS, respectively can be noticed from Fig. 6. Similar morphological features for the L-GA and ZnS also have been reported in ref. 26 and 27. Concerning the L-GA/ZnS composites, they are composed of a similar plate-like structure of L-GA with agglomerated ZnS morphology on the plate surface, having a diameter of 50–500 nm.
 |
| | Fig. 6 FESEM images of the (a) L-GA, (b) ZnS and (c) L-GA/ZnS composites. Inset of panel (a) shows the higher magnification image of L-GA. | |
To deepen the study of the interaction of ZnS with L-GA along with the morphological observations, the EDX measurements were performed for the composite samples. For instance, Fig. 7 shows the EDX spectrum of L-GA/ZnS composites. The peaks of Zn and S along with C, N, and O in the spectrum confirm their presence in the composites and agree well with the FTIR and UV-Vis data. The atomic% of Zn and S were found 1.82 and 1.15, respectively in the composites as presented in the inset of Fig. 7.
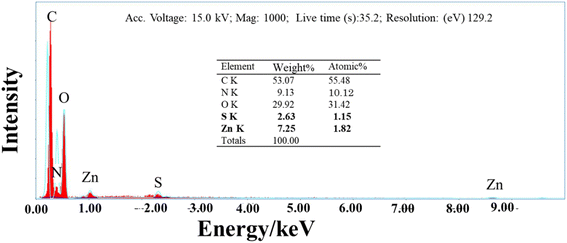 |
| | Fig. 7 EDX spectrum of L-GA/ZnS composites. | |
3.5 Photocatalytic performance
By observing the photo-degradation of MB under direct sunlight exposure, the photocatalytic potential of L-GA and all L-GA/ZnS composite samples was ascertained. Fig. 8a–e depict the time-dependent UV-Vis absorption spectra for the degradation of MB in the presence of L-GA, ZnS, and all L-GA/ZnS composites as a photocatalyst. The decrease in absorption bands indicates the successful elimination of MB from the individual samples. In the case of L-GA, the elimination of MB happened after 360 min, suggesting its low degradation capacity (Fig. 7a), and it was evident that only around 51.65% of MB was removed. Fig. 5b shows the UV-Vis absorption spectra of MB solution encompassing 20 mg of bare ZnS for diverse time intervals. The absorption maxima decline progressively with the increasing sunlight illumination time and 70.53% removal occurred after 360 min of time duration. The percentage of removal with respect to exposure time to the sunlight for all samples is plotted in Fig. 9. In a previous study, we observed that the absorbance maxima were changed very slowly for MB without the use of ZnS on sunlight illumination.16
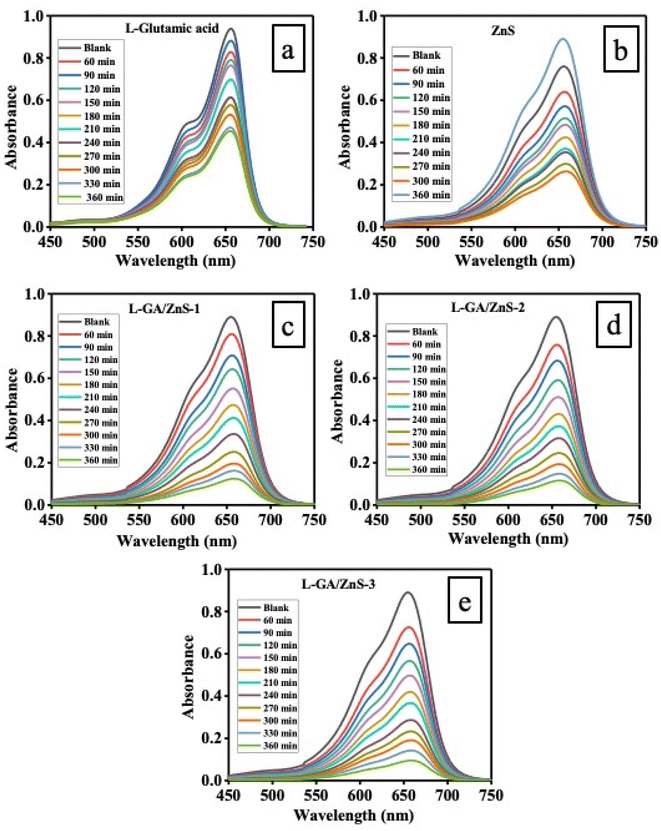 |
| | Fig. 8 Changes in the UV-Vis absorption spectra of MB aqueous solution in the presence of (a) L-GA, (b) ZnS, (c) L-GA/ZnS-1, (d) L-GA/ZnS-2, and (e) L-GA/ZnS-3 composites. | |
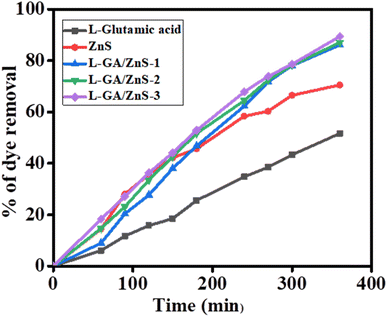 |
| | Fig. 9 Photo-degradation of MB in the presence of L-GA and different L-GA/ZnS composites. | |
Such data indicates the efficient photocatalytic ability of ZnS under sunlight exposure. Further, under the same experimental conditions, L-GA/ZnS composites were employed as photocatalysts to evaluate their photocatalytic performance with that of L-GA alone. Fig. 8c–e demonstrates that all the L-GA/ZnS composite samples' absorption maxima were significantly decreased. The absorption maxima decline recurrently with the allowance of illumination time displaying a blue shift and showing the nearly complete removal of MB after 360 min. Such obvious blue shifting validates the gradual adsorption of MB to the materials. Similar results were observed for other polymer composite materials.16
Fig. 9 shows the percentage of removal MB for L-GA, ZnS, and all L-GA/ZnS composite samples as a function of irradiation time. The L-GA/ZnS-1, L-GA/ZnS-2, and L-GA/ZnS-3 composites show 86.1%, 87.1%, and 89.5% dye removal, respectively after the same span of time 360 min which is far better than the L-GA. Such results validate that all L-GA/ZnS composites have a superior ability to remove MB compared to L-GA alone. The reasons for the better photocatalytic performance of polymer composites with ZnS than the individual materials were explained in our very recent study.28 It is noted that there is no substantial disparity of the absorption maxima, thus percentage of dye removal was identified among the composite samples (Fig. 8c–e).
3.6 Photocatalytic mechanism
The breakdown of an organic dye like MB leads to the formation of reactive species such as holes, superoxide radicals, and hydroxyl radicals when exposed to sunlight. Irradiated particles have the ability to degrade a wide variety of organic contaminants when they are exposed to oxygen. An illustration of a potential mechanism for the photocatalytic degradation process involving L-GA/ZnS composites is shown in Fig. 10. ZnS is known to be capable of producing electron–hole charge pairs when subjected to solar (h) irradiation.
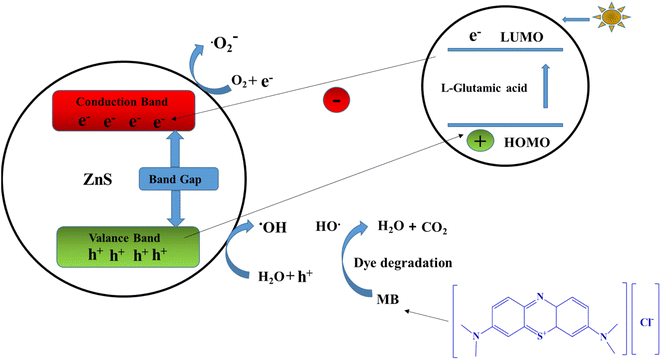 |
| | Fig. 10 Schematic representation of the photocatalytic mechanism through the L-GA/ZnS composites under sunlight irradiation. | |
Electrons at the valence band (VB) edge undergo a band gap transition when they are photo-excited, moving to the conduction band edge (CB). This makes holes in the VB (Fig. 10). Organic contaminants (MB) or ambient water molecules react with the created holes in the VB to produce hydroxyl radicals (˙OH). When electrons gather on the CB, they combine with adjacent water as well as oxygen molecules to produce hydroxyl (˙OH) and superoxide (˙O2−) radicals. The resulting radicals and holes are highly effective in degrading MB and other organic pollutants. In the period of MB degradation, oxygen (O2) can stop the adverse recombination of electron–hole charge pairs. A photocatalysts efficiency may be enhanced by the special charge-pair transfer that occurs between electrons and holes. Finally, when MB is exposed to light, only carbon dioxide (CO2) and water (H2O) are produced.7 As a result of the ZnS layer facilitating the adsorption of MB on the active surface of photocatalysts, the photo-catalytic activity of the composites is improved above that of L-GA alone. These findings prove that L-GA/ZnS composites may be used as a photo-catalyst for color mineralization in textile and waste-water treatment situations.
3.8 Electrochemical properties
Electrochemical properties of the composites were evaluated by GCD in a two-electrode system utilizing an aqueous solution of 0.5 M Na2SO4 as the electrolyte. Fig. 11 demonstrates the GCD curves of L-GA and L-GA/ZnS composites at a persistent current of 1 amp. Specific capacitance and energy density were determined from the GCD curve and listed in Table 2. The Fig. 11 indicates almost similar voltage drop with time. Further, from the GCD curve, it is evident that the prepared L-GA/ZnS electrode exhibited better specific capacitance, energy density, and power density compared to L-GA.
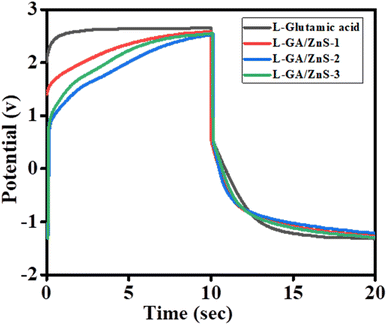 |
| | Fig. 11 GCD curves of L-GA and L-GA/ZnS composites. | |
Table 2 Comparison of specific capacitance, energy density and power density for different electrode
| Composites |
Specific capacitance (F g−1) |
Energy density (W h kg−1) |
Power density (W kg−1) |
| L-GA |
167 |
305 |
850 |
| L-GA/ZnS-1 |
172 |
310 |
880 |
| L-GA/ZnS-2 |
177 |
311 |
890 |
| L-GA/ZnS-3 |
179 |
318 |
898 |
The specific capacitance of L-GA was obtained at 167 F g−1, whereas the L-GA/ZnS composites electrode showed sp. capacitance at 170–180 F g−1. Accordingly, the energy density and power density of L-GA were found of 305 W h kg−1 and 850 W kg; however, for the L-GA/ZnS composites such values were 310–318 W h kg−1 and 880–898 W kg−1, respectively (Table 2). Additionally, an asymmetric supercapacitor device constructed with the L-GA/ZnS electrode was charged and connected with one red 5 mm LED and found the bulb lit up for a few minutes after charging only a few seconds (ESI Fig. S1†). It is worthy to remark that the fabricated L-GA/ZnS composites show a higher specific capacitance associated with numerous correlated conducting polymer-related materials.28–31
4 Conclusions
A simple solvent casting procedure was used to prepare L-glutamic acid (L-GA)/ZnS composites with increased photocatalytic performance. Spectroscopy techniques such as FTIR, UV-Vis, and PL data confirmed the interaction of L-GA and ZnS. PL findings revealed the better luminescence property of L-GA/ZnS composites than L-GA. Notably, the PL analysis demonstrated a substantial improvement in the luminescence properties of the L-GA/ZnS composites compared to pure L-GA. Furthermore, examination of the L-GA/ZnS composites using FESEM/EDS revealed a plate-like structure with agglomerated ZnS particles on the plate surface, ensuring a diameter within the range of 50–500 nm. Through the process of photo-degradation of MB, the incorporation of ZnS into L-GA significantly enhanced the photocatalytic performance of the resulting composites. Electrochemical characterization of the prepared composites revealed a commendable specific capacitance ranging from 172 to 179 F g−1 for the L-GA/ZnS composite. Subsequently, an asymmetric hybrid supercapacitor device was fabricated using these composites, and its performance was evaluated. Notably, the device constructed with the L-GA/ZnS electrode successfully illuminated a single red LED for several minutes, indicating the excellent charge storage capability of the composites.
Author contributions
Mohammad Riaz Hosen Shohag synthesized and characterized the materials, analyzed and discussed the results and wrote the manuscript. Mohammad Mizanur Rahman Khan supervised, conceived, designed the work, analyzed, discussed the results and wrote the manuscript. Md. Abu Saleh Musa, Azmeri Sultana Supta, and Muhammad Shahadat Hussain Chowdhury performed the PL measurements, and photocatalytic applications. Md. Mostafizur Rahman performed electrochemical studies, supercapacitor application, wrote the following section and reviewed the manuscript. Hadi M. Marwani and Mohammed M. Rahman performed sensor applications and wrote this section. Okenwa Okoli edited and reviewed the paper.
Conflicts of interest
There are no conflicts to declare.
Acknowledgements
This work is completely conducted at the laboratory of Department of Chemistry, SUST. The authors wish to express gratitude to the Materials and Organic Chemistry laboratory, Department of Chemistry, SUST, for supporting the works. M. M. R. K. is gratefully acknowledged to SUST Research Center for providing financial support (Project ID: PS/2021/1/05).
References
- W. Gui, J. Lin, Y. Liang, Y. Qu, L. Zhang, H. Zhang and X. Li, NPJ Clean. Water, 2019, 16, 2 Search PubMed.
- A. Lee, J. W. Elam and S. B. Darling, Environ. Sci. Water Res. Technol., 2016, 2, 17 RSC.
- T. Aarthi and G. Madras, Ind. Eng. Chem. Res., 2007, 46, 7 CrossRef CAS.
- N. Nikooe and E. Saljoughi, Appl. Surf. Sci., 2017, 413, 41 CrossRef CAS.
- S. Mallakpour and F. Motirasoul, New J. Chem., 2018, 42, 4297 RSC.
- K. Kalpana and V. Selvaraj, RSC Adv., 2015, 5, 47766 RSC.
- N. Soltani, E. Saion, M. Z. Hussein, M. Erfani, A. Abedini, G. Bahmanrokh, M. Navasery and P. Vaziri, Int. J. Mol. Sci., 2012, 13, 12242 CrossRef CAS PubMed.
- Y. Liu, L. Guo, W. Yan and H. Liu, J. Power Sources, 2006, 159, 1300 CrossRef CAS.
- H. Kato, K. Asakura and A. Kudo, J. Am. Chem. Soc., 2003, 125, 3082 CrossRef CAS PubMed.
- J.-S. Hu, L.-L. Ren, Y.-G. Guo, H.-P. Liang, A.-M. Cao, L.-J. Wan and C.-L. Bai, Angew. Chem., Int. Ed., 2005, 44, 1269 CrossRef CAS PubMed.
- D. W. Synnott, M. K. Seery, S. J. Hinder, J. Colreavy and S. C. Pillai, Nanotechnology, 2013, 24, 045704 CrossRef CAS PubMed.
- M. M. Rahman Khan, S. Pal, M. M. Hoque, M. R. Alam, M. Younus and H. Kobayashi, ACS Omega, 2019, 4, 6144 CrossRef CAS PubMed.
- T. P. Mofokeng, M. J. Moloto, P. M. Shumbula, P. K. Nyamukamba, S. Takaidza and L. Marais, J. Nanotechnol., 2018, 2018, 4902675 Search PubMed.
- R. Asahi, T. Morikawa, T. Ohwaki, K. Aoki and Y. Taga, Science, 2001, 293, 269 CrossRef CAS PubMed.
- S. G. Zhang, S. Higashimoto, H. Yamashita and M. Anpo, J. Phys. Chem. B, 1998, 102, 5590 CrossRef CAS.
- Q. Feng, Z. Xie, H. Liang, Z. Zhang, Y. Yan and C.-F. Ding, Rapid Commun. Mass Spectrom., 2022, 36, e9405 CrossRef CAS PubMed.
- S. Rahman, M. M. R. Khan, B. Deb, S. I. Dana and M. K. Ahmed, S. Afr. J. Chem. Eng., 2023, 43, 303–311 Search PubMed.
- M. M. Rahman, P. M. Joy, M. N. Uddin, M. Z. Mukhlish, M. M. R. Khan and Heliyon, 2021, 7, e07407.
- P. Long, Q. Zhao, J. Dong and J. Li, J. Coord. Chem., 2009, 62(12), 1959–1963 CrossRef CAS.
- T. P. Mofokeng, M. J. Moloto, P. M. Shumbula, P. Nyamukamba, P. K. Mubiayi, S. Takaidza and L. Marais, J. Nanotechnol., 2018, 2018, 4902675 Search PubMed.
- A. Torabi and V. N. Staroverov, J. Phys. Chem. Lett., 2015, 6, 2075 CrossRef CAS PubMed.
- U. K. Sur and B. Ankamwar, RSC Adv., 2016, 6, 95611 RSC.
- B. Poornaprakash, D. A. Reddy, G. Murali, N. M. Rao, R. P. Vijayalakshmi and B. K. Reddy, J. Alloys Compd., 2013, 577, 79 CrossRef CAS.
- N. Karar, F. Singh and B. R. Mehta, J. Appl. Phys., 2004, 95, 656 CrossRef CAS.
- K. K. Dey, P. Kumar, R. R. Yadav, A. Dhar and A. K. Srivastava, RSC Adv., 2014, 4, 10123 RSC.
- H. D. David and Y. Mastai, Cryst. Growth Des., 2007, 7, 847 CrossRef.
- A. Ananth, I. Han, M. Akter, B. Jin-Hyo and C. Eun, J. Indust. Eng. Chem., 2020, 90, 389 CrossRef CAS.
- M. M. Rahman Khan, M. Islam, M. K. Amin, S. K. Paul, S. Rahman, M. M. Talukder and M. M. Rahman, Int. J. Hydrogen Energy, 2022, 47, 37860 CrossRef CAS.
- W.-C. Chen, T.-C. Wen and H. Teng, Electrochim. Acta, 2003, 48, 641 CrossRef CAS.
- F. Movassagh-Alanagh, A. Bordbar-Khiabani and A. Ahangari-Asl, Int. J. Hydrogen Energy, 2019, 44, 26794 CrossRef CAS.
- M. Ates, M. A. Serin, I. Ekmen and Y. N. Ertas, Polym. Bull., 2015, 72, 2573 CrossRef CAS.
|
| This journal is © The Royal Society of Chemistry 2023 |
Click here to see how this site uses Cookies. View our privacy policy here.  Open Access Article
 *a,
Md. Abu Saleha,
Azmeri Sultana Suptaa,
Mohammad Shahadat Hussain Chowdhurya,
Md. Mostafizur Rahmanbd,
Hadi M. Marwanic,
Mohammed M. Rahmanc and
Okenwa Okolid


![[double bond, length as m-dash]](https://www.rsc.org/images/entities/char_e001.gif) O stretching, C–N stretching, N–H stretching, and CH2 bending, respectively.19,20 The characteristics peak of ZnS was observed at 667 cm−1 (Fig. 3). When ZnS interact with L-GA, the hydroxyl group peak of L-GA (3464 cm−1) were subtly shifted (3487–3510 cm−1) for all composite samples.18 In the FT-IR spectra of all L-GA/ZnS composite samples, the occurrence of characteristics peak of ZnS at (670–690 cm−1) indicated the successful incorporation of ZnS in L-GA. Such results indicate the successful formation of L-GA/ZnS composites. Hence, the incorporation of ZnS in the L-GA/ZnS composites evidenced by the FT-IR analysis.
O stretching, C–N stretching, N–H stretching, and CH2 bending, respectively.19,20 The characteristics peak of ZnS was observed at 667 cm−1 (Fig. 3). When ZnS interact with L-GA, the hydroxyl group peak of L-GA (3464 cm−1) were subtly shifted (3487–3510 cm−1) for all composite samples.18 In the FT-IR spectra of all L-GA/ZnS composite samples, the occurrence of characteristics peak of ZnS at (670–690 cm−1) indicated the successful incorporation of ZnS in L-GA. Such results indicate the successful formation of L-GA/ZnS composites. Hence, the incorporation of ZnS in the L-GA/ZnS composites evidenced by the FT-IR analysis.


