 Open Access Article
Hybridized sulfated-carboxymethyl cellulose/MWNT nanocomposite as highly selective electrochemical probe for trace detection of arsenic in real environmental samples†
Youssef O. Al-Ghamdi*a,
Mahjoub Jablia,
Mona H. Alhalafia,
Ajahar Khan*b and
Khalid A. Alamry *c
*c
aDepartment of Chemistry, College of Science Al-Zulfi, Majmaah University, Al-Majmaah 11952, Saudi Arabia. E-mail: yo.alghamdi@mu.edu.sa
bChemistry Department, Faculty of Science, King Abdulaziz University, Jeddah 21589, Saudi Arabia. E-mail: arkhan.029@gmail.com
cDepartment of Food and Nutrition, Bionanocomposite Research Center, Kyung Hee University, 26 Kyungheedae-ro, Dongdaemun-gu, Seoul, South Korea. E-mail: kaalamri@kau.edu.sa
First published on 19th June 2023
Abstract
A highly selective and ultra-sensitive electrochemical sensing probe was proposed by combining sulfated-carboxymethyl cellulose (CMC-S) and a functionalized-multiwalled carbon nanotube (f-MWNT) nano-composite with high conductivity and durability. The CMC-S/MWNT nanocomposite was impregnated on a glassy carbon electrode (GCE) to construct the non-enzymatic and mediator-free electrochemical sensing probe for trace detection of As(III) ions. The fabricated CMC-S/MWNT nanocomposite was characterized by FTIR, SEM, TEM, and XPS. Under the optimized experimental conditions, the sensor exhibited the lowest detection limit of 0.024 nM, a high sensitivity (69.93 μA nM−1 cm−2) with a good linear relationship in the range of 0.2–90 nM As(III) concentration. The sensor demonstrated strong repeatability, with the current response continuing at 84.52% after 28 days of use, in addition to good selectivity for the determination of As(III). Additionally, with recovery ranging from 97.2% to 107.2%, the sensor demonstrated comparable sensing capability in tap water, sewage water, and mixed fruit juice. The electrochemical sensor for detecting trace levels of As(III) in actual samples is anticipated to be produced by this effort and is expected to possess great selectivity, good stability, and sensitivity.
1. Introduction
Arsenic, a naturally occurring non-essential carcinogenic element, is found in high levels in various environmental systems, including soil and groundwater.1,2 It is among the top ten environmental health concerns that seriously affect living things, including human health, and is thought to be highly toxic, causing cytological and physiological damage.1,2 The inorganic forms of arsenite (As(III)) and arsenate (As(V)) are the most common species in surface water, drinking water, and groundwater, with As(III) typically being regarded as more harmful than As(V).3 The high concentration of As(III) in drinking water seriously harms human health by causing keratosis, skin damage, lung and bladder cancer, etc. Additionally, it impairs immune function in pregnant women, increasing the chance of newborn mortality.4 The World Health Organization recommends that the As(III) concentration in drinking water be less than 10 μg L−1 and in surface water be less than 50 μg L−1, respectively, due to its severe toxicity.5,6 Therefore, it is particularly important to determine the trace levels of As(III) in natural water (rivers, sea, and ocean), wastewater (from pesticides, chemicals, metal processing, and mining, etc.), and drinking water become extremely crucial as these media are susceptible to As(III) pollution.7In the past, various sensitive techniques, including atomic absorption spectroscopy,8,9 ion chromatography,10,11 inductively coupled plasma mass spectrometry,12 and neutron activation analysis, have been developed and successfully used to detect arsenic.13,14 However, these methods still had several drawbacks, such as the need for expensive, large-scale equipment, being time-consuming, and difficulty executing the procedures. However, the majority of these methods demand prolonged detection times, complicated sample preparation, expensive equipment, and comparatively high operating costs.
To overcome these limitations, electrochemical techniques have attracted much attention that offers the convenient detection of toxic metals, advantages of minimal sample pretreatment, economics, rapid ease of detection, robustness, and portability.15,16 As we all know, differential pulse voltammetry (DPV), cyclic voltammetry (CV), linear sweep voltammetry (LSV), and electrochemical impedance spectroscopy have been employed for the sensitive determination of trace metal ions in different environment samples.17,18 However, the electrochemical activity of glassy carbon electrodes (GCE) has poor selectivity, sensitivity, and repeatability to real samples as a result of delayed charge transfer kinetics, interference of coexisting metal ions, and low catalytic activity. To enhance the electrochemical activity, the GCE needs to be functionalized through different active substances (metal nanoparticles or carbon nanomaterials, etc.) to improve the electrical stability and sensitivity, which are more suited for determining toxic metal ions in complex samples.18,19 Narayana et al. synthesized Li2TiO3 multiwalled carbon nanotubes (MWNT) nanocomposite to modify GCE and used it as an electrochemical sensor for the trace detection of dopamine. The CV and DPV response of the constructed sensor demonstrated excellent selectivity and sensitivity towards dopamine with a detection limit of 1.71 μmol L−1.20 In another report, Sajjan et al. report the detection of Pb(II) using the CV and amperometry analysis with the limit of detection (LOD) of 37 nmol L−1 and linearity in the 100–1000 nmol L−1 range.21 Further, cobalt(II) tetra amide benzimidazole phthalocyanine complex was used to modify the GCE and applied to detect Hg(II) with enhanced sensitivity through the CV, chronoamperometric (CA), and DPV techniques.22
To date, a number of electrochemical sensing probes based on inorganic nanoparticles, organic molecules, polysaccharides, and their derivatives have been developed to determine toxic metal ions in various environmental samples.23,24 The discovery of carbon nanomaterials, such as carbon nanotubes (CNTs), brings a revolutionary expansion in this area of electrochemical research. CNTs have fascinated huge attention in recent years for electrochemical determinations because of their physicochemical properties, high modulus of elasticity, specific surface area mechanical, superior electronic conductivity, as well as their high aspect ratio, good strength, and low density.25
To limit the challenge of CNT dispersion, surfactants and soluble polymers have been employed as effective dispersion agents, where π–π stacking facilitates CNTs to interact easily with conjugated macromolecules and makes it probable for better suitability to solvents and high-site approachability of the target molecule.25–27
Natural polysaccharides such as carboxymethyl cellulose (CMC) can be effectively employed to develop electrochemical materials due to their abundant chiral microenvironment.28 As per the previous reports, CMC-functionalized CNT presented good dispersibility and stability in water.29 CMC has been studied to help active particles and act as a binder to deposit unvaryingly on the electrode surface due to its great influence on the accumulation of particles on the electrode.30 Meanwhile, CMC can be extensively utilized as a precursor due to oxygen-containing functional groups, such as carboxyl, carbonyl, and hydroxyl groups, that can be adapted to immobilize various metal ions.31 For example, Velempini et al. developed a polypyrrole/CMC composite-based modified GCE for the sensitive and selective determination of mercury ions in water.32 In another report, Priya et al. developed a modified GCE using the CMC complexed with reduced graphene oxide and glutathione for the trace determination of cadmium (0.05 nM) through square wave anodic stripping voltammetry, CV, and EIS.33 It has also been reported that modification of CMC leads to a gain in sorption capacity towards metal ions, which has been applied many times for heavy metal sequestration.34 Further, biomolecules immobilized in CMC film displayed good electrocatalytic efficacies towards H2O2 and NO, which verified that CMC could be a suitable microenvironment for redox reactions to directly exchange electrons with underlying electrodes.35 Additionally, CMC-based electrodes might be another promising choice to substitute the environment-hazardous materials-based-modified electrode for detecting heavy metal ions.
Thus with the aim of a robust, cost-effective, environmentally friendly sensor for As(III) detection in real samples, this work reports the applicability of multiwalled-CNT (MWNT) impregnated sulfated-carboxymethyl cellulose (CMC-S/MWNT) for trace detection of arsenic metal using differential pulse voltammetry (DPV) technique. The sensitivity, stability, accuracy, durability, and electrochemical performance of the fabricated CMC-S/MWNT-based modified GCE were validated by CV, EIS, and DPV characterizations. Upon evaluation of the electrochemical investigations, it was found that the new CMC-S/MWNT-based modified GCE exhibits excellent sensitivity, a low detection limit (LOD), and anti-interference activity toward As(III) ions in biological samples.
2. Experimental section
2.1. Materials
The BDH Chemicals Pvt. Ltd, Poole, UK supplied the sodium salt of carboxymethyl cellulose (CMC) (2% solution 6–8 pH, low viscosity, the viscosity of a 1% solution in water at 20 °C 30–70c/s) was supplied by arsenic trioxide (As2O3), sodium bisulfate, sodium nitrite, sodium hydroxide, and ethanol were supplied by Sigma-Aldrich Chemie Pvt, Ltd, USA. 0.1 mM of As(III) stock solution was prepared in double distilled water, and 0.1 M phosphate buffer solutions (PBS) in the varying pH range (5.7, 6.5, 7.0.7.5, and 8.0 pH) were made by adjusting the ratio of Na2HPO4 and NaH2PO4. All other chemicals were bought from Sigma-Aldrich Chemie Pvt, Ltd USA and utilized as received.2.2. Fabrication of CMC-S/MWNT composite
The fabrication of the CMC-S/MWNT nanocomposite was carried out in three steps. In the initial step, sulfated-CMC (CMC-S) was produced through sulfating the carboxymethyl cellulose with some amendment, as described elsewhere.36 N(SO3Na)3 (hybrid sulfating agent) was prepared by combining sodium bisulfate and sodium nitrite. For this, sodium nitrite's solution (1 M in 20 mL of distilled water) was added slowly to a solution of sodium hydroxide (1 M in 80 mL of distilled water) while being continuously stirred at 90 °C for 1.5 hours to create a new hybrid (N(SO3Na)3). The pH of N(SO3Na)3 solution was adjusted to ∼8 with 1 M NaOH solution. 10 g of dried CMC was gradually added to the sulfating agent solution while being vigorously mechanically stirred (at 600 rpm). The reaction continued at 45 °C for a further 6 h, and the resultant mixture was dried at 50 °C. The resulting CMC-sulfate (CMC-S) was then carefully washed with distilled water and CH3COCH3 and dried at 50 °C until all solvents had been completely evaporated. The second step involved sonicating the commercially obtained MWNT with strong nitric acid and sulfuric acid at a ratio of 1![[thin space (1/6-em)]](https://www.rsc.org/images/entities/char_2009.gif) :
:![[thin space (1/6-em)]](https://www.rsc.org/images/entities/char_2009.gif) 3 (v/v) for 4 h at 45 °C. The resulting solid was carefully rinsed with DW several times till the pH level reached 6–7. After washing, the black solid of f-MWNT was collected and dried at 50 °C.29
3 (v/v) for 4 h at 45 °C. The resulting solid was carefully rinsed with DW several times till the pH level reached 6–7. After washing, the black solid of f-MWNT was collected and dried at 50 °C.29
In the final step, f-MWNT with concentrations of 0.2 and 0.4 mg was suspended in 10 mL of DW, and the mixtures were mechanically agitated for 1 h at 50 °C followed by sonicating (15 min) for degassing to make the homogeneous dispersion. To the resultant aqueous dispersions of f-MWNT, 1 g of functionalized CMC-S was poured into each one with constant continuous stirring at 50 °C for up to 2 h to produce a new CMC-S/MWNT nanocomposite. The resultant solution mixture was dried till complete evaporation of the solvent at 50 °C, stored at 4 °C, and employed for further characterization and electrode fabrication (Fig. 1). Based on the used concentration of f-MWNT (0.2 and 0.4 mg), the prepared CMC-S/MWNT composite was designated as CMC-S/MWNT1, and CMC-S/MWNT2, respectively.
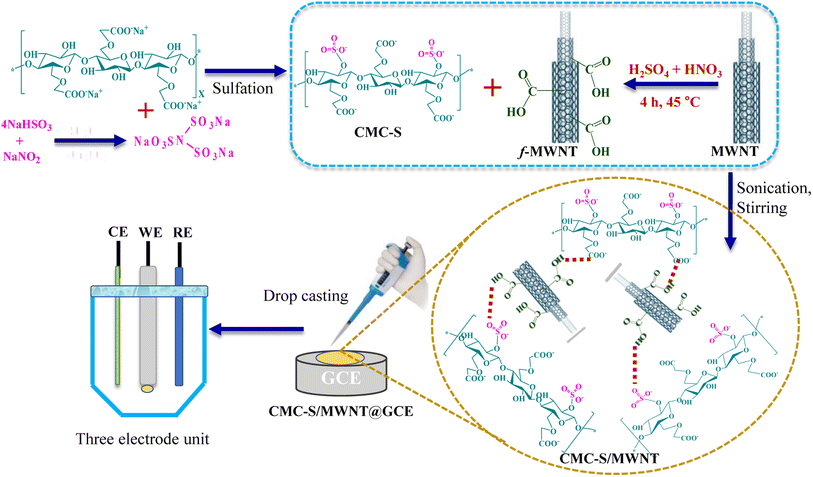 | ||
| Fig. 1 Schematic representation of CMC-S and f-MWNT-based CMC-S/MWNT nanocomposite preparation and CMC-S/MWNT@GCE-based electrode fabrication. | ||
2.3. Characterizations
The morphological assessment was carried out by recording the surface images through scanning electron microscopy (SEM) at a Zeiss Evo 50 XVP, United Kingdom. The hierarchical morphology of the prepared CMC-S/MWNT composites was demonstrated using transmission electron microscopy (TEM) (JEM-2100, TEM Jeol, Japan). To determine the surface functional groups, FTIR spectra of the fabricated CMC-S/MWNT in the 500–4000 cm−1 range were measured through the PerkinElmer 100 FT-IR Spectrometer-USA. The chemical compositions of studied composite materials were performed through the X-ray photoelectron spectroscopy (XPS) (PHI 5000 Versa Prob III, FEI Inc.) with C 1s (284.5 eV) and Al-Kα radiation (1486.7 eV) for the binding energies calibration of constituent elements. The electrochemical parameters such as CV, DPV, and EIS characterizations were examined through a modular galvanostat/potentiostat (Autolab 302 N-AUT85887) assembled with an impedance analyzer (FRA32M.X) and controlled by the software Nova 1.10. The galvanostat/potentiostat equipment consists of a conventional framework with a three-electrode unit, with a GCE (glassy carbon electrode; 0.0316 cm2) employed as the working electrode. The Ag/AgCl was the reference electrode, while the auxiliary electrode was a platinum wire (0.5 mm in diameter).2.4. Fabrication of CMC-S/MWNT-based modified-GCE
In this study, we created a new electrochemical sensor for sensitively detecting trace arsenic by altering the surface of the most popular glassy carbon electrode (GCE) with a CMC-S/MWNT-based nanocomposite. GCE was gently scrubbed using 0.3 mm alumina slurry and a velvet pad before modification. After being successively sonicated with a 1![[thin space (1/6-em)]](https://www.rsc.org/images/entities/char_2009.gif) :
:![[thin space (1/6-em)]](https://www.rsc.org/images/entities/char_2009.gif) 1 aqueous solution of ethanol and nitric acid, the GCEs were allowed to dry at room temperature. To produce a homogenous dispersion, the CMC-S/MWNT nanocomposite was sonicated in distilled water at a concentration of 3.5 mg mL−1. Due to its excellent film-forming capabilities, CMC-S/MWNT can then be easily integrated onto the GCE surface using a simple drop-casting approach to create a CMC-S/MWNT-modified GCE (CMC-S/MWNT@GCE), which is then dried at 30 °C for 20 min. On the surface of the modified GCE, 2 μL of the Nafion (perfluorinated polymer) was cast after complete drying, and it was then let to dry at 25 3 °C. Fig. 1 illustrates the design concept for this new arsenic sensor.
1 aqueous solution of ethanol and nitric acid, the GCEs were allowed to dry at room temperature. To produce a homogenous dispersion, the CMC-S/MWNT nanocomposite was sonicated in distilled water at a concentration of 3.5 mg mL−1. Due to its excellent film-forming capabilities, CMC-S/MWNT can then be easily integrated onto the GCE surface using a simple drop-casting approach to create a CMC-S/MWNT-modified GCE (CMC-S/MWNT@GCE), which is then dried at 30 °C for 20 min. On the surface of the modified GCE, 2 μL of the Nafion (perfluorinated polymer) was cast after complete drying, and it was then let to dry at 25 3 °C. Fig. 1 illustrates the design concept for this new arsenic sensor.
2.5. Electrochemical investigations and detection of As(III)
The electrochemical impedance spectroscopy (EIS) investigations for the fabricated CMC-S/MWNT@GCE were carried out in (0.5 mM) [Fe(CN)6]3− couple/KCl (0.1 M) solution in the frequency range of 0.1 Hz to 100 kHz at +0.2 V DC and 0.005 V amplitude. The mobility of electrons in 0.5 mM [Fe(CN)6]3− couple/KCl (0.1 M) was determined by recording the CV curves in the potential range of ±0.9 V at a scan rate of 100 mV s−1 and 0.008 V (step potential). To determine the presence of As(III), differential pulse voltammetric (DPV) and CV curves were recorded in a solution of PBS (pH = 5.7) containing a predetermined concentration of As(III), with a modulation duration of 0.024 s and step potential of 0.008 V at 100 mV s−1 of scan rate. In an electrochemical cell, 25 mL of PBS solution was maintained during the experiment by diluting the stock solution of As(III) (0.1 mM) in distilled water, a range of different concentrations of target analyte As(III) (from 0.2 to 90 nM) was prepared.2.6. Real sample examination
To determine As(III) in real water samples, the testing samples include tap water, sewage water, and mixed fruit juice (bought from the local store). The testing samples were evaporated to a tenth of their original volume and diluted at a ratio of 1![[thin space (1/6-em)]](https://www.rsc.org/images/entities/char_2009.gif) :
:![[thin space (1/6-em)]](https://www.rsc.org/images/entities/char_2009.gif) 9 with 0.1 M PBS buffer (pH = 5.7). Known As(III) concentrations were added to the diluted sample as a standard, and the developed CMC-S/MWNT2 modified-GCE was used to calculate the recovery percentage. As(III) ion concentrations in actual samples were calculated as follows:
9 with 0.1 M PBS buffer (pH = 5.7). Known As(III) concentrations were added to the diluted sample as a standard, and the developed CMC-S/MWNT2 modified-GCE was used to calculate the recovery percentage. As(III) ion concentrations in actual samples were calculated as follows:
 | (1) |
 | (2) |
2.7. Stability and interference and studies
The impact of associated interferents was assessed using the DPV current response by spiking a 5-fold concentration of 4-nitrophenol, 2-nitrophenol, 2,6-dinitrophenol, Ag+, Cd2+, Ni2+, Cr6+, Pb2+, Zn2+, and Co2+, into the electrochemical cell with a predetermined concentration of As(III). This was done to investigate the selectivity of the manufactured CMC-S@MWNT2 modified-GCE towards As(III) metal ions. Also, the stability of the proposed CMC-S/MWNT modified-GCE's in terms of response durability and repeatability was examined using the DPV and CV methods.3. Results and discussion
This research proposes an enzyme-free, highly sensitive electrochemical sensing probe with high stability and accuracy for detecting As(III) in samples from the real environment. Sulfated-carboxymethyl cellulose and MWNT (CMC-S/MWNT) based nano-composite as an efficient electrode material was used to modify GCE (CMC-S/MWNT@-GCE) and proposed for trace detection of arsenic metal from real samples. By changing CMC into CMC-S, which multiplies the number of reactive sites across the polymer backbone and the overall effectiveness of CMC can be improved. Unmodified biopolymers have poor stability and low solvent-holding capacity, major barriers to their effective applications.37,38 Additionally, modification into CMC-S increases the number of reactive sites across the polymer framework, which can improve CMC's overall performance. Chemical pretreatment enables the introduction of anionic (charged) functional groups, such as sulfonic or sulfate groups, on the CMC surface. Such functionalized CMC-S form stable colloidal suspensions employed to disperse nanomaterials for the fabrication of functional composites effectively.39 Moreover, chemical or thermo-chemical functionalization of biopolymers allows them to bind or interact with various functional moieties during the composition process.38,40 Therefore, at every phase of developing sensors, CMC-S establishes a useful operation. In the composite structure, it could improve the distribution of MWNT in the CMC-S/MWNT@-GCE-based sensor platform due to the interaction between the surface functional groups (sulfate, hydroxyl, and carboxyl groups) of CMC-S and MWNT. Nanocomposite materials made of cellulose can improve the modified GCE's capacitive characteristics and cycle stability by offering a suitable microenvironment for electron switching straight with the underlying electrodes.35,40 Furthermore, the chemical composition, structural morphology, and surface functional groups of the fabricated CMC-S/MWNT nano-composite were characterized by FE-SEM, TEM, FTIR, and XPS characterizations.3.1. SEM-analysis
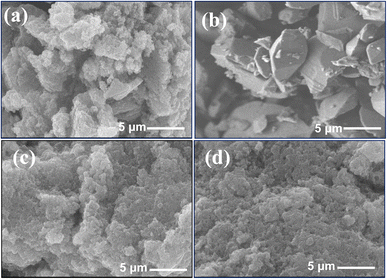
The microstructure of the interface between the electrode and the polymer material can affect the electrochemical response of the fabricated electrode.41 SEM micrographs were used to ascertain the surface morphologies throughout the conversion of pure-CMC to CMC-S and the fabrication of nanocomposite materials comprised of CMC-S/MWNT1 and CMC-S/MWNT2. From Fig. 2a, it is clear that the pure-CMC's surface morphology features uneven, varying shapes of particles and rougher structure (Fig. 2a). The morphologic modifications seen in CMC-S during sulfation are shown in Fig. 2b. The CMC-S morphology has uniformly smooth surfaces, some rough edges, and intact pebble-like structural integrity (Fig. 2b). Additionally, the composite material's surface area has been seen to be more regular with the composition of f-MWNT with CMC-S into the CMC-S/MWNT1 and CMC-S/MWNT2 (Fig. 2c and d), resulting in an unvarying, rough surface due to the existence of small reticulated shapes conquering an accumulation of interwoven MWNT and CMC-S nanocomposites pattern.42 The CMC-S/MWNT1 and CMC-S/MWNT2 also have a rougher morphology, as is evident in Fig. 2c and d, but the surface was found to be more homogeneous due to active free sites in the composite form, which hold the structure firmly in the occurrence of functionalized-CMC. The plasticizing effect of CMC on the conductive material structure could be responsible for this unvarying and intact surface.433.2. TEM analysis
Fig. 3a and b displays TEM images of the CMC-S/MWNT2 nanocomposite at different magnifications. The TEM image in Fig. 3a depicts some wrinkled shapes that are consistently distributed across the surface of the manufactured bio-composite. The CMC-S/MWNT2 TEM picture shows a disintegrated layered sheet-like structure (Fig. 3a). The CMC-S polymer chain may have been prevented from stacking due to the abundance of functional, active sites rich in oxygen. These active areas can act as anchor sites and make it easier for MWNT to adhere to the surfaces and edges of the polymer backbone. The morphology of CMC-S/MWNT2 (Fig. 3b) shows layers indicating an enlarged structure together with rippling waves and flaky designs. The constructed CMC-S/MWNT2 composite contains f-MWNT and CMC-S in a homogeneous composite blend, as shown by the TEM images. Here, the average MWNT particle size in the CMC-S/MWNT2 composites was measured using TEM images and was found to be between 3.85 and 5.71 nm (Fig. 3b). For the resulting electrode materials, uniform anchoring morphology of CMC-S and f-MWNT into CMC-S/MWNT2 nanocomposite, which is a desirable precondition, aids in obtaining enhanced electrical characteristics.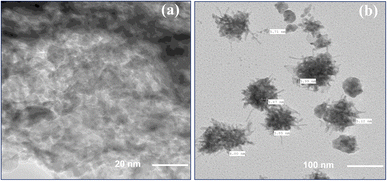 | ||
| Fig. 3 TEM images of CMC-S/MWNT2 nanocomposite-based electrode material (a) high magnification and (b) low magnification. | ||
3.3. FTIR analyses
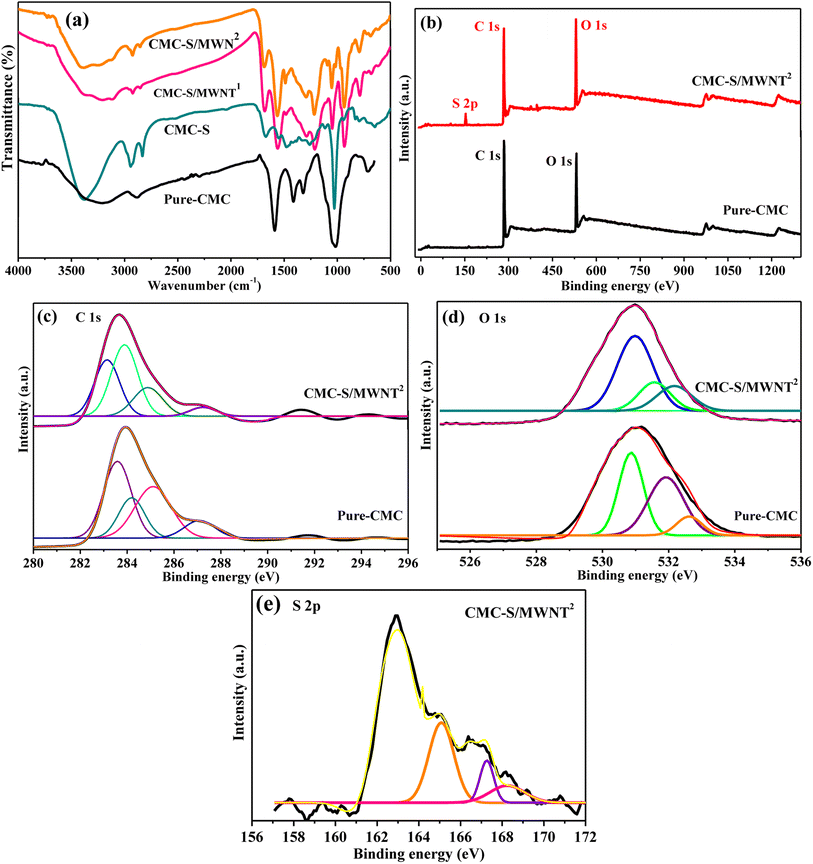
The functionalization of neat-CMC into CMC-S and functional groups present on the surface of the constructed CMC-S/MWNT1 and CMC-S/MWNT2 composites were investigated by recording FTIR spectra and the outcomes are illustrated in Fig. 4a. The distinctive CMC bands in Fig. 4a are clearly visible O–H stretching vibration around 3376 cm−1, –COO− symmetric stretching vibration indicated by 1406 cm−1 for, and bands about 1610 and 2902 cm−1 for the carboxyl group and asymmetric stretching of C–H, respectively.37 The symmetrical deformations of the –COH and –CH2 groups are responsible for the distinct bands about 1330 cm−1. The S![[double bond, length as m-dash]](https://www.rsc.org/images/entities/char_e001.gif) O groups asymmetric stretching, which is attributed to the distinctive absorption bands of about 1261 and 856 cm−1, is confirmed by the sulfonation of CMC into S-CMC.37 In contrast to CMC, the broad band around 3376 cm−1 is often moved toward the high-frequency range in S-CMC (Fig. 4a).37 The stretching vibrations of the –OH groups, the stretching vibrations of the C–H groups, and the stretching vibrations of the carboxylate groups, respectively, can be attributed to the peaks at 3439 cm−1, 2917 cm−1, and 1634 cm−1 for the CMC-S/MWNT1, and CMC-S/MWNT2 nanocomposites.44 These peaks, which are all displayed on fabricated composite materials, are all due to the synergistic combination of CMC-S and carboxylated-MWNT peaks. The peaks at 1477 cm−1, 1302 cm−1, and 1045 cm−1 in the spectrum of the CMC-S are attributed to the –CH2 scissoring, –OH bending, and C–O–C stretching, respectively. These peaks are visible in all CMC-S/MWNT nanocomposite's spectrum, proving that CMC-S was wrapped around the MWNTs. Both the FT-IR spectra of the CMC-S/MWNT1 and CMC-S/MWNT2 nanocomposites show all of the typical raw material peaks. The strength of the peaks was sharper than the ingredients because the composite had a lot of functional groups, such as carboxyl, hydroxyl, and other functional groups.
O groups asymmetric stretching, which is attributed to the distinctive absorption bands of about 1261 and 856 cm−1, is confirmed by the sulfonation of CMC into S-CMC.37 In contrast to CMC, the broad band around 3376 cm−1 is often moved toward the high-frequency range in S-CMC (Fig. 4a).37 The stretching vibrations of the –OH groups, the stretching vibrations of the C–H groups, and the stretching vibrations of the carboxylate groups, respectively, can be attributed to the peaks at 3439 cm−1, 2917 cm−1, and 1634 cm−1 for the CMC-S/MWNT1, and CMC-S/MWNT2 nanocomposites.44 These peaks, which are all displayed on fabricated composite materials, are all due to the synergistic combination of CMC-S and carboxylated-MWNT peaks. The peaks at 1477 cm−1, 1302 cm−1, and 1045 cm−1 in the spectrum of the CMC-S are attributed to the –CH2 scissoring, –OH bending, and C–O–C stretching, respectively. These peaks are visible in all CMC-S/MWNT nanocomposite's spectrum, proving that CMC-S was wrapped around the MWNTs. Both the FT-IR spectra of the CMC-S/MWNT1 and CMC-S/MWNT2 nanocomposites show all of the typical raw material peaks. The strength of the peaks was sharper than the ingredients because the composite had a lot of functional groups, such as carboxyl, hydroxyl, and other functional groups.
3.4. XPS analyses
To further confirm the strong interaction between CMC-S and MWNT chemical composition and elemental states of the developed pure-CMC and CMC-S/MWNT2 nano-composite at a molecular level, XPS investigations were accomplished, and the results are illustrated in Fig. 4b–e. Fig. 4b displays the survey spectra of both pure-CMC and CMC-S/MWNT2, confirming the presence of carbon (C 1s at ∼283.2 eV) and oxygen (O 1s at ∼531.3 eV) as major constitutional elements, whereas the presence of an additional element sulfur (S 2p at ∼161.4 eV) in the CMC-S/MWNT2 confirm the successful sulfonation of CMC into the fabricated nano-composite.45,46 Regarding the high-resolution XPS C 1s of pure-CMC and CMC-S/MWNT2, the spectra can be deconvoluted with four peaks at bending energies at ∼283.2 eV, 284.2 eV, ∼285.2 eV, ∼287.2 eV, which can be assigned to C–C/C–H, C![[double bond, length as m-dash]](https://www.rsc.org/images/entities/char_e001.gif) C/C–C, C–O, C–S/C–O, C–O–C or C
C/C–C, C–O, C–S/C–O, C–O–C or C![[double bond, length as m-dash]](https://www.rsc.org/images/entities/char_e001.gif) O bonds, respectively (Fig. 4c).45,46 The high-resolution XPS O 1s spectra fitted into three characteristic peaks positioned around ∼530.8 eV, ∼531.8 eV, and ∼532.5 eV are attributed to C
O bonds, respectively (Fig. 4c).45,46 The high-resolution XPS O 1s spectra fitted into three characteristic peaks positioned around ∼530.8 eV, ∼531.8 eV, and ∼532.5 eV are attributed to C![[double bond, length as m-dash]](https://www.rsc.org/images/entities/char_e001.gif) O, C–O–H/C–O, and C–OO−/O–C–O groups, respectively (Fig. 4d). The C 1s and O 1s peaks in deconvoluted form have distinct characteristics, both are well matched, illustrating that carbon and oxygen possessed diverse chemical surroundings as the ring in CMC-S/MWNT2 nano-composite carbon atoms are associated with different types of substituent's whereas oxygen connected to different sulfur moieties.47 Moreover, the deconvoluted S 2p XPS response of CMC-S/MWNT2 nano-composite (Fig. 4e) was split with three prominent peaks at binding energies of ∼165.7 eV corresponded with the C–S–O, ∼167.3 eV ascribed due to –OSO32− (S 2p3/2), and ∼168.3 eV corresponds to the OSO32− (S 2p1/2).48
O, C–O–H/C–O, and C–OO−/O–C–O groups, respectively (Fig. 4d). The C 1s and O 1s peaks in deconvoluted form have distinct characteristics, both are well matched, illustrating that carbon and oxygen possessed diverse chemical surroundings as the ring in CMC-S/MWNT2 nano-composite carbon atoms are associated with different types of substituent's whereas oxygen connected to different sulfur moieties.47 Moreover, the deconvoluted S 2p XPS response of CMC-S/MWNT2 nano-composite (Fig. 4e) was split with three prominent peaks at binding energies of ∼165.7 eV corresponded with the C–S–O, ∼167.3 eV ascribed due to –OSO32− (S 2p3/2), and ∼168.3 eV corresponds to the OSO32− (S 2p1/2).48
3.5. EIS (electrochemical impedance spectroscopy) and CV (cyclic voltammetry) investigations
The EIS was carried out to convey information about the charge transfer or diffusion process of the fabricated CMC-S/MWNT2@-GCE, which can convey evidence about the sort of reaction that takes place throughout the impedance fluctuations.49 EIS is regarded as a crucial investigation to show the conductance or resistivity between the electrolyte contact and GCE as well. This can be seen by the ratio of real impedance (Z′) to negative imaginary impedance (−Z′′) in Nyquist plots. At high frequency, it indicates the semicircle, and at low frequency region corresponds to the straight line. The semicircle in the high-frequency zone signifies charge transfer resistance and double-layer capacitance, and the straight line denotes that interface diffusion between the electrode and electrolyte controls the reaction. Surface resistances are highly influenced by the morphology and content of the material.50 The diameter of the semicircle and the redox probe's electron transfer kinetics at the electrode interface is controlled by the Rct (electron-transfer resistance). Moreover, an increased rate of electron transfer is determined by a lower value of Rct and vice versa.51,52 Fig. 5a presents the results of the EIS and displays the Nyquist plot for the bare-GCE (blank), CMC-S@-GCE, CMC-S/MWNT1@-GCE, and CMC-S/MWNT2@-GCE. The EIS equivalent circuit diagram used to calculate the values of the Warburg impedance (W), constant phase element (CPE), and solution resistance (Rs) for modified GCEs is shown in Fig. S1a–d (ESI†). In comparison to the blank and other modified electrodes, the CMC-S/MWNT2@-GCE's Nyquist plot shows a smaller diameter of the semi-circle in the region of higher frequency (Fig. 5a). The higher frequency region's smaller semi-circle shape exhibits a faster rate of electron transfer, resulting in less resistance and better conductivity.52 The CMC-S/MWNT2@-GCE's smaller Nyquist diameter suggested it would help the [Fe(CN)6]3−/4− probe transmit electrons more easily. The CMC-S/MWNT2@-GCE's lowered Rct value (Fig. S1d†) denotes a rapid electron transfer rate when compared to the Rct values of unmodified and other GCEs (Fig. S1a–c†). According to Fig. S1,† the corresponding Rct values for the blank, CMC-S@-GCE, CMC-S/MWNT1@-GCE, and CMC-S/MWNT2@-GCE were 214 Ω, 153 Ω, 91.9 Ω, and 62.6 Ω. This implies that the surface of GCE treated with CMC-S/MWNT2@-GCE bio-composite has significantly improved electron transport. The CMC-S/MWNT2@-GCE material's lowest Rct value revealed that electron transport was significantly better at the surface of the GCE-modified material, and the manufactured material was expected to be an excellent electrical conducting material.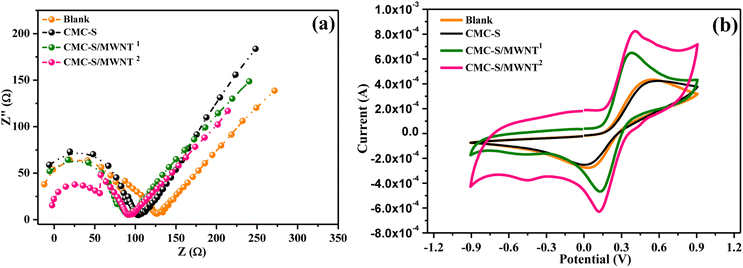 | ||
| Fig. 5 (a) EIS spectra and (b) CV response of bare-GCE (blank), CMC-S@-GCE, CMC-S/MWNT1@-GCE, and CMC-S/MWNT2@-GCE electrodes in the solution of 0.5 mM [Fe(CN)6]3−/4− with 0.1 M KCl. | ||
The electrocatalytic activity of the blank, CMC-S@-GCE, CMC-S/MWNT1@-GCE, and CMC-S/MWNT2@-GCE was investigated by recording cyclic voltammetry responses using a redox probe supporting electrolyte of 0.5 mM [Fe(CN)6]3−/4− and 0.1 M KCl (Fig. 5b). In contrast to the other electrodes, the CV response demonstrates that CMC-S/MWNT2@-GCE has a bigger electroactive region and larger cathodic and anodic peaks current responses (Fig. 5b). When compared to other modified electrodes the CMC-S/MWNT2@-GCE performed better in terms of high CV current response and larger electrode's surface area, which plays a significant influence in the reaction rate. Moreover, during the redox reaction of [Fe(CN)6]3−/4−, all electrodes had apparent redox peaks. The CMC-S/MWNT2@-GCE, in contrast to the blank, CMC-S@-GCE, and CMC-S/MWNT1@-GCE, demonstrate a greater redox peak current and a smaller peak-to-peak potential separation (ΔEp). The computed ΔEp values for the four different tested electrodes, i.e., blank, CMC-S@-GCE, CMC-S/MWNT1@-GCE, and CMC-S/MWNT2@-GCE, are 520, 461, 268, and 261 mV respectively. The CMC-S/MWNT2@-GCE's improved redox peak current and decreased anodic to cathodic peak potential separation show that the system is capable of rapid electron transfer. Furthermore, the Ipa/Ipc ratio (redox peak current) of CMC-S/MWNT2@-GCE is 1.2 (1≈ reversible), which is verified the reversible redox reaction of [Fe(CN)6]3−/4− at Mo CMC-S/MWNT2@-GCE. The appropriate amount of MWNT impregnation is beneficial to enhance the electrical performance, and ultimately the combined combination results of CMC-S and MWNT composite lessen the interfacial charge transfer resistance of CMC-S/MWNT2@-GCE. Therefore, the optimized CMC-S/MWNT2 composite provided a stable, electroactive, reliable, and resilient interface that can be employed as a suitable sensing probe. The electrochemical characteristics investigated by EIS and CV strategies validated the excellent electrocatalytic nature of CMC-S/MWNT2 nanocomposite and supported its suitability as an efficient electrochemical probe for the sensitive and selective As(III) detection. In light of this, CMC-S/MWNT2@-GCE was the only electrode used for further electrochemical characterizations.
3.6. Investigation of pH effect and electrochemical sensing of As(III)
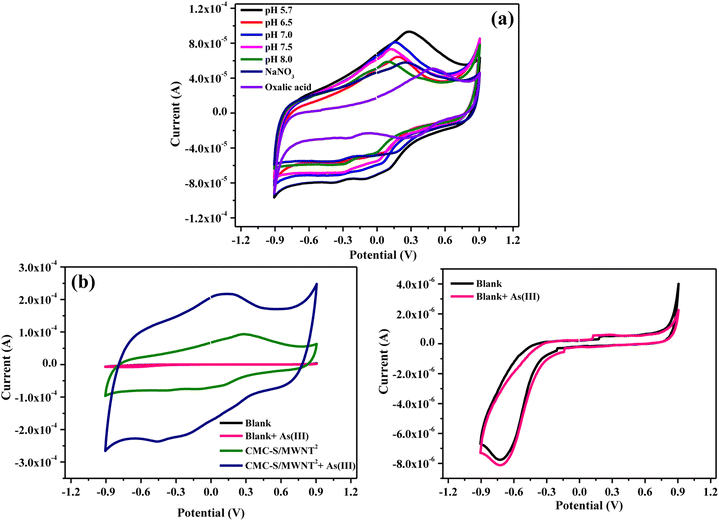
The pH investigations were employed to determine the ideal working conditions for obtaining the best electrochemical responses of CMC-S/MWNT2@-GCE towards As(III) redox reactions. The pH experiments were obtained in 0.1 M PBS comprising 5.7, 6.5, 7.0, 7.5, and 8.0 as well as 0.1 M NaNO3 and C2H2O4 solutions in the existence of 0.1 mM As(III) (Fig. 6a). The obtained CV results suggested that for the proposed electrode, the pH 5.7 solution produced the largest anodic and cathodic peak currents, while PBS 8.0 produced the lowest anodic current response (Fig. 6a). This can be attributed to the CMC-S/MWNT2@-GCE's efficient catalytic performance in an acidic medium, which shows that the As(III) electrocatalytic detection is more effective in pH 5.7 than other electrolytes (Fig. 6a). According to the previous investigations, acidic electrolytes play a significant role in the detection of metal ions, and the electrocatalytic oxidation/reduction of metal ions is actually controlled by the acidic environment.53 The presence of additional hydrogen ions in the PBS solution at pH 5.7 may have increased the detection's effectiveness of the CMC-S/MWNT2@-GCE towards As(III) by accelerating the oxidation reaction (corresponding to the oxidation of As0–As3+). Alternately, when the solution gets more basic, fewer H+ ions are available, which leads to a decrease in the efficiency of the proposed electrode towards As(III) detection. Further from this analysis, it is also suggested that the anodic and cathodic peaks' current response towards As(III) gradually lowered with the rise in the pH from 5.7–8.0, representing a proton-coupled electron transfer. In neutral or alkaline pH, the electrocatalytic detection analysis seems complex because of the proton deficiency.54 It is evident from Fig. 6a that the affinity of As(III) was altered by varying ionic strength and reached its maximum at pH 5.7, suggesting that a large quantity of ions diffuse to the CMC-S/MWNT2@-GCE and aid in the determination of As ions. Hence, pH 5.7 was used for the remaining experimental trials.Fig. 6b represents the CV electrochemical characteristics of blank, and CMC-S/MWNT2@-GCE recorded with and without 0.1 mM As(III) in pH = 5.7 solutions at 0.1 V s−1. It was found that without As(III), nearly no oxidation peaks were observed for blank (bare GCE), and no noticeable change was recorded for CMC-S/MWNT2@-GCE. With the addition of As(III), no change in the current response was seen on the blank electrode due to its low electron transfer rate displaying that the blank electrode has no electrocatalytic activity toward detecting the analyte. However, the CMC-S/MWNT2@-GCE delivers a much sharper and substantially higher peak current response toward the arsinate ions. The experimental outcomes demonstrate that CMC-S/MWNT2@-GCE outperforms the blank electrode regarding the stripping peak current response corresponding to the arsenic detection. Therefore, because of its higher sensitivity, CMC-S/MWNT2@-GCE is best suited for detecting As(III) in pH = 5.7 solutions (0.1 M PBS).
3.7. Effect of scan rate
The influence of scan rate was investigated by recording the CV curves in order to determine the electrocatalytic response of the CMC-S/MWNT2@-GCE for As(III) ions detection. The CV response of a 0.1 mM As(III) solution at CMC-S/MWNT2@-GCE was measured at several scan rates ranging from 10 to 350 mV s−1, and the results are illustrated in Fig. 7a. The cathodic and anodic peaks current strength for As(III) ions increased linearly as the scan rate of the CMC-S/MWNT2@-GCE electrode increased. The redox peak current of As(III) and the square root of the scan rate was typically found to be linearly related (Fig. 7b). On the CMC-S/MWNT2@-GCE, rapid electron transport (a diffusion-controlled process) is demonstrated by linear regression eqn (3).50| ip,a = 7.8e − 4 ± 3.9e − 5 × −1.1e − 4 ± 1.2e − 5…, (R2 = 0.98) | (3) |
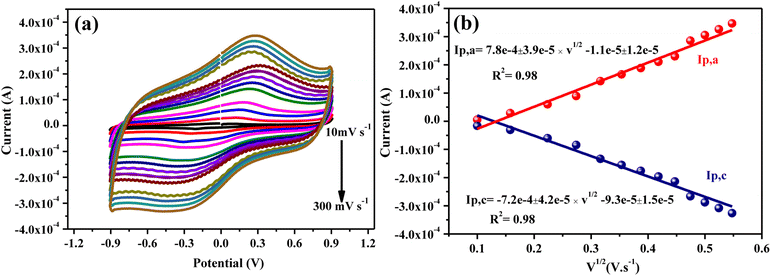 | ||
| Fig. 7 (a) The CV curve behavior of CMC-S/MWNT2@-GCE with 0.1 mM of As(III) under 10–300 mV s−1, and (b) redox peak current intensity calibration plotted against scan rates squared. | ||
The current was proportional to the square root of the scan rate, which indicated that the redox response was diffusion-controlled, according to the linear regression with shifting scan rates. In the meantime, a surface adsorption-regulated process is described by the linear relationship between Ip,c and the V1/2 (eqn (4))
| ip,c = −7.2e − 4 ± 4.2e −5 × −9.3e − 4 ± 1.5e − 5…, (R2 = 0.98) | (4) |
3.8. Electrochemical detection of As(III)
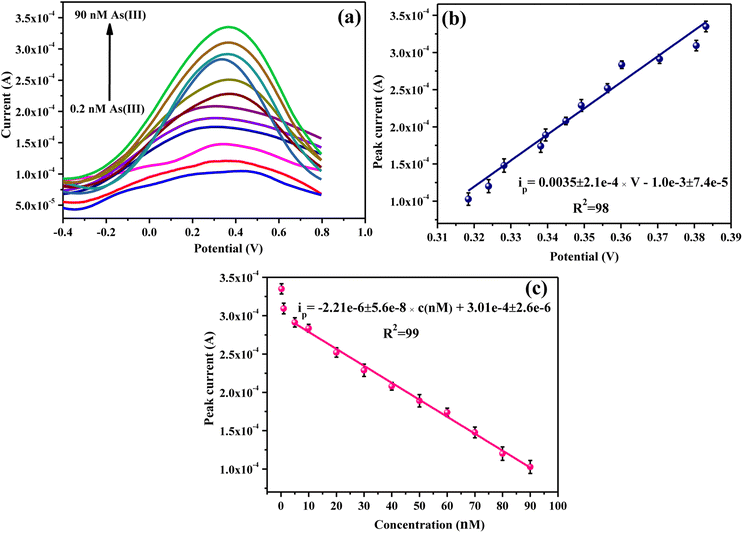
Finally, detecting As(III) using CMC-S/MWNT2@-GCE was accomplished by observing the DPV response as it extensively employed a voltammetric approach with high accuracy and exclusive sensitivity.55 Fig. 8a displays the DPV response with varying concentrations of As(III) (0.2–90 nM) in the potential range −0.4 to 0.8 V at 0.1 V s−1 carried out in 0.1 M PBS solution (pH 5.7). The peak observed around ∼3 V in the DPV response of CMC-S/MWNT2@-GCE corresponds to oxidation of As0–As3+. Fig. 8a also demonstrated that at 0.3 V, a continuous increase in current was noticed, suggesting that at this potential high concentration of arsenic ions was getting deposited on CMC-S/MWNT2@-GCE with the increasing concentration of arsenic ions. The DPV response of the CMC-S/MWNT2@-GCE conveyed a steady rise in the electrooxidation current response of As(III) with increased analyte concentration. The obtained data was well coordinated with the results of Gumpu et al.56 These findings make it clear that the oxidation of arsenic ions may cause the observed oxidation peak. Further, the experimental outcomes suggested that the electrooxidation current was linear within the concentration range of 0.2–90 nM, further validating that the electrocatalytic performance of CMC-S/MWNT2@-GCE was substantial for the electrochemical determination of As(III) in a wide concentration range. In addition, an electrooxidation peak shift against positive potential was also noted, revealing the diffusion-controlled process (Fig. 8b).57 Eqn (5) describes the fitted linear relationship between the stripping peak current and the varying As(III) concentration (Fig. 8c).| ip = −2.21e − 6 ± 5.6e − 8 × c (nM) + 3.01e − 4 ± 2.6e − 6 | (5) |
Using several analytical parameters, the validity of the CMC-S/MWNT2@-GCE sensor for the detection of As(III) was examined. The LOD, and LOQ, values of CMC-S/MWNT2@-GCE towards As(III) were calculated to be 0.0248 ± 4.3 × 10⁻⁴ nM and 0.0828 ± 1.5 × 10⁻⁴ nM, respectively (S3.1 and S3.2, ESI†), where LOD is defined as the smallest amount of the analyte that, at a 90% indicated confidence level, produces a signal that is significantly different from the blank result.58 Further, by considering the Randles–Sevcik eqn (6), the electrochemically active surface area of CMC-S/MWNT2@-GCE was assessed by measuring the CV (Fig. S2†) in the [Fe(CN)6]3−/4− redox couple.59
| Ip = 2.69 × 10⁵ × A × n3/2 × D1/2 × C × γ1/2 | (6) |
Further, the scan-rate experiment by plotting the peak potential against the logarithm of the scan rate (ln![[thin space (1/6-em)]](https://www.rsc.org/images/entities/char_2009.gif) ν) was used to determine the number of electrons involved in the sensing of arsenic (Fig. S3†). Furthermore, the transfer coefficient (α) was determined to be 0.318 (∼0.32) by applying the equation.61
ν) was used to determine the number of electrons involved in the sensing of arsenic (Fig. S3†). Furthermore, the transfer coefficient (α) was determined to be 0.318 (∼0.32) by applying the equation.61
| α = 47.7/(Ep − Ep/2) | (7) |
The number of electrons transferred (n) for the sensing of As(III) can be computed from α value (∼0.32) and the resulting slope of the potential vs. ln![[thin space (1/6-em)]](https://www.rsc.org/images/entities/char_2009.gif) v plot according to the following equation.62,63
v plot according to the following equation.62,63
 | (8) |
![[thin space (1/6-em)]](https://www.rsc.org/images/entities/char_2009.gif) 500 C).
500 C).
From the peak potential vs. scan rate (ln![[thin space (1/6-em)]](https://www.rsc.org/images/entities/char_2009.gif) ν) plot, a slope of 0.038 (∼0.04) (Fig. S3†) was calculated for As(III), describing a transfer of 1.93e− (∼2); thus, supporting the fact that the electrochemical reaction was a two-electron transfer process.
ν) plot, a slope of 0.038 (∼0.04) (Fig. S3†) was calculated for As(III), describing a transfer of 1.93e− (∼2); thus, supporting the fact that the electrochemical reaction was a two-electron transfer process.
3.9. Selectivity/interference investigation of CMC-S/MWNT2@-GCE
To confirm the selectivity of CMC-S/MWNT2@-GCE, the detection of As(III) in the occurrence of other interferent ions was important. In order to explore the anti-interference aptitude of CMC-S/MWNT2@-GCE, DPV measurements were recorded in a 50 nM As(III) solution in the existence of a 5-fold higher concentration of other metal ions, i.e., Ag+, Cd2+, Ni2+, Cr6+, Pb2+, Zn2+, and Co2+, common organic pollutants such as 2-nitrophenol (2-NP), 2,4-dinitrophenol (2,4-DNP), and 4-nitrophenol (4-NP) (Fig. 9a and b). Fig. 9a depicts the anodic stripping current of As(III) in the presence and absence of the above-mentioned interferent ions. The obtained results showed that the added interferent ions did not appear to significantly interfere with the As(III) stripping current behavior. The stripping current response of CMC-S/MWNT2@-GCE was found to be nearly the same for each added interferent, as can be seen from the error bar in Fig. 9b. The computed relative standard deviation (RSD) was 6.23% (S4.1 ESI†), which was near to 5% (threshold value).64 The basis for accurate and targeted As(III) detection utilizing CMC-S/MWNT2@-GCE was laid by this interference investigation.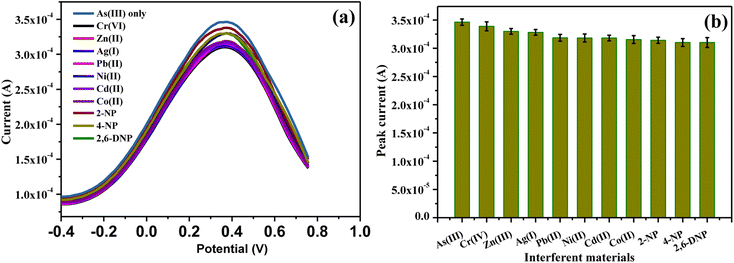 | ||
| Fig. 9 (a) DPV response of CMC-S/MWNT2@-GCE in 50 nM As(III) in the existence of common ion interferents (b) error bar after repetition of interferent experiment. | ||
3.10. Stability of CMC-S/MWNT2@-GCE
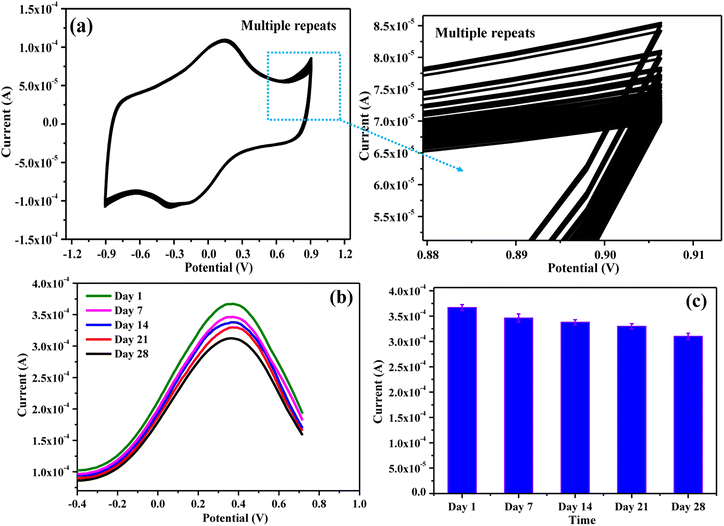
The reproducibility and durability of the response for the CMC-S/MWNT2@-GCE for arsenic detection were also assessed. By observing the CV hysteresis response over 50 sequential cycles, the repeatability of the CMC-S/MWNT2@-GCE for the determination of 0.1 mM As(III) was examined (Fig. 10a). The engineered sensor, as can be seen, exhibits nearly the same current response even after carrying out the experiment repeatedly, indicating that the proposed electrode was quite consistent.Also, the CMC-S/MWNT2@-GCE DPV responses for the detection of arsenic were observed for a duration of 28 days (Fig. 10b). The RSD derived from the error bar was found to be 6.18% within the duration of 28 days, and the current response's drop was only 15.48% with respect to the response of day 1 (S4.2 ESI†). The results of these tests thus revealed that CMC-S/MWNT2@-GCE was extremely sensitive, durable, and stable, with a shelf-life of at least 28 days for the assessment of As(III) (Fig. 10c).
3.11. Real samples assessment of As(III) ions
In order to examine the practicality and feasibility of the CMC-S/MWNT2@-GCE, the real sample analyses of tap water, sewage water, and mixed fruit juice were taken into consideration. The standard addition method (spiking) was employed to evaluate the recovery of As(III) in natural environmental samples, and the response findings are shown in Table 1. According to the recovery investigations, the maximum recovery range for As(III) ions were between 97.2 and 107%. Herein, the calculated higher recovery values than the mixed are because of the existence of As(III) in the real samples (sewage water). The constructed electrochemical probe displayed a wide recovery with a good linear range. The proposed interface helped in the assessment of As(III) with a LOD inferior to the WHO limits and a broad linear range.5,6 Therefore, the experimental outcomes confirmed that CMC-S/MWNT2@-GCE was a highly suitable arsenate sensor for real sample assessment.| Real sample | Added (nM) | Found (nM) | Recovery (%) | RSD (%) |
|---|---|---|---|---|
| Tap water | 10.0 | 9.97 | 99.7 | 2.66 |
| 25.0 | 24.81 | 99.24 | 2.57 | |
| 50.0 | 50.06 | 100.12 | 1.03 | |
| Sewage water | 10.0 | 10.72 | 107.20 | 2.63 |
| 25.0 | 25.46 | 101.84 | 1.05 | |
| 50.0 | 50.28 | 100.56 | 0.25 | |
| Mixed juice | 10 | 9.72 | 97.20 | 3.63 |
| 25 | 24.85 | 99.4 | 1.62 | |
| 50 | 49.96 | 99.92 | 1.18 |
4. Conclusion
In summary, the GCE modified with CMC-S/MWNT nanocomposite was successfully constructed and further verified to be an efficient electrochemical sensing probe for trace detection of As(III). Taking advantage of the high conductivity and large specific surface area of the f-MWNT, as well as the introduction of −OSO32− groups (i.e., CMC-S) into the proposed nanocomposite, the CMC-S/MWNT2@GCE exhibited excellent selectivity and sensitivity toward As(III) with a low LOD of 0.024 nM, high sensitivity of 69.93 μA nM−1 cm−2 with a linear range of 0.2–90 nM. The manufactured sensor displayed good selectivity and reusability as well, and the current response can hold steady at 84.52% even after 28 days of production. The sensor was also used to determine the As(III) concentration in tap water, sewage water, and mixed fruit juice, and the results were satisfactory. The CMC-S/MWNT2@GCE has achieved the recovery of traces of arsenic ions in actual samples, which suggested an effective approach for the quick determination of toxic arsenic metal in the field of environmental monitoring.Conflicts of interest
There are no conflicts to declare.Acknowledgements
The authors extend their appreciation to the Deputyship for Research & Innovation, Ministry of Education in Saudi Arabia, for funding this research work through the project number (IFP-2022-40).References
- S. S. Khan, A. Sharma and S. J. S. Flora, Chem. Res. Toxicol., 2022, 35, 916–934 Search PubMed
.
- A. Cheng, R. Tyne, Y. T. Kwok, L. Rees, L. Craig, C. Lapinee, M. D'Arcy, D. J. Weiss and P. Salaün, J. Chem. Educ., 2016, 93, 1945–1950 CrossRef CAS
.
- A. K. Tolkou, G. Z. Kyzas and I. A. Katsoyiannis, Sustainability, 2022, 14, 5222 CrossRef CAS
.
- W. Khamcharoen, P. Duchda, K. Songsrirote, N. Ratanawimarnwong, N. Limchoowong, P. Jittangprasert, T. Mantim and W. Siangproh, Anal. Methods, 2022, 14, 3087–3093 RSC
.
- V. D. Martinez, E. A. Vucic, D. D. Becker-Santos, L. Gil and W. L. Lam, J. Toxicol., 2011, 2011, 1–13 CrossRef PubMed
.
- C. M. George, L. Sima, M. H. J. Arias, J. Mihalic, L. Z. Cabrera, D. Danz, W. Checkley and R. H. Gilman, Bull. World Health Organ., 2014, 92, 565–572 CrossRef PubMed
.
- P. Nath, R. K. Arun and N. Chanda, RSC Adv., 2014, 4, 59558–59561 RSC
.
- I. B. Karadjova, P. K. Petrov, I. Serafimovski, T. Stafilov and D. L. Tsalev, Spectrochim. Acta Part B At. Spectrosc., 2007, 62, 258–268 CrossRef
.
- S. M. Macedo, R. M. de Jesus, K. S. Garcia, V. Hatje, A. F. de S. Queiroz and S. L. C. Ferreira, Talanta, 2009, 80, 974–979 CrossRef CAS PubMed
.
- Y. Martínez-Bravo, A. Roig-Navarro, F. López and F. Hernández, J. Chromatogr. A, 2001, 926, 265–274 CrossRef PubMed
.
- B. P. Jackson, J. Anal. At. Spectrom., 2015, 30, 1405–1407 RSC
.
- X. Jia, D. Gong, J. Wang, F. Huang, T. Duan and X. Zhang, Talanta, 2016, 160, 437–443 CrossRef CAS
.
- M. T. Islam, S. A. Islam and S. A. Latif, Bull. Environ. Contam. Toxicol., 2007, 79, 327–330 CrossRef CAS PubMed
.
- H. Govindappa, G. Abdi, U. T. Uthappa, G. Sriram, S. S. Han and M. Kurkuri, Chemosphere, 2023, 316, 137851 CrossRef CAS PubMed
.
- R. Meng, Q. Zhu, T. Long, X. He, Z. Luo, R. Gu, W. Wang and P. Xiang, Food Control, 2023, 150, 109743 CrossRef CAS
.
- F. Gao, C. Liu, L. Zhang, T. Liu, Z. Wang, Z. Song, H. Cai, Z. Fang, J. Chen, J. Wang, M. Han, J. Wang, K. Lin, R. Wang, M. Li, Q. Mei, X. Ma, S. Liang, G. Gou and N. Xue, Microsyst. Nanoeng., 2023, 9, 1 CrossRef PubMed
.
- C. Venkateswara Raju, C. Hwan Cho, G. Mohana Rani, V. Manju, R. Umapathi, Y. Suk Huh and J. Pil Park, Coord. Chem. Rev., 2023, 476, 214920 CrossRef CAS
.
- M. A. Hussein, A. Khan and K. A. Alamry, RSC Adv., 2022, 12, 31506–31517 RSC
.
- K. A. Alamry, A. Khan and M. A. Hussein, Synth. Met., 2022, 285, 117023 CrossRef CAS
.
- A. L. Narayana, G. Venkataprasad, S. Praveen, C. W. Ho, H. K. Kim, T. M. Reddy, C. M. Julien and C. W. Lee, Sensor Actuator Phys., 2022, 341, 113555 CrossRef CAS
.
- V. A. Sajjan, S. Aralekallu, M. Nemakal, M. Palanna, C. P. K. Prabhu and L. K. Sannegowda, Inorg. Chim. Acta., 2020, 506, 119564 CrossRef CAS
.
- M. Palanna, S. Aralekallu, C. Keshavananda Prabhu, V. A. Sajjan, Mounesh and L. K. Sannegowda, Electrochim. Acta, 2021, 367, 137519 CrossRef CAS
.
- P. Yadav, H. Laddha, L. Yadav, M. Agarwal and R. Gupta, Inorg. Chim. Acta., 2023, 553, 121512 CrossRef CAS
.
- S. S. Shafqat, M. Rizwan, M. Batool, S. R. Shafqat, G. Mustafa, T. Rasheed and M. N. Zafar, Chemosphere, 2023, 318, 137920 CrossRef CAS
.
- H. Meskher, T. Ragdi, A. K. Thakur, S. Ha, I. Khelfaoui, R. Sathyamurthy, S. W. Sharshir, A. K. Pandey, R. Saidur, P. Singh, F. Sharifian jazi and I. Lynch, Crit. Rev. Anal. Chem., 2023, 1–24 CrossRef PubMed
.
- E. dos Santos Moretti, F. M. de Oliveira, G. L. Scheel, L. H. DalĺAntônia, D. Borsato, L. T. Kubota, M. G. Segatelli and C. R. T. Tarley, Electrochim. Acta, 2016, 212, 322–332 CrossRef
.
- Z. Zhu, Nano-Micro Lett., 2017, 9, 25 CrossRef
.
- G. Li, X. Dai, Y. Min, C. Yu, T. Ikai, L. Zhang, J. Shen and Y. Okamoto, Cellulose, 2021, 28, 347–358 CrossRef CAS
.
- A. Khan, R. K. Jain, P. Banerjee, B. Ghosh, Inamuddin and A. M. Asiri, Sci. Rep., 2018, 8, 9909 CrossRef PubMed
.
- S. Pejovnik, R. Dominko, M. Bele, M. Gaberscek and J. Jamnik, J. Power Sources, 2008, 184, 593–597 CrossRef CAS
.
- J. Fan, S. Zhang, F. Li and J. Shi, Cellulose, 2020, 27, 5477–5507 CrossRef CAS
.
- T. Velempini, K. Pillay, X. Y. Mbianda and O. A. Arotiba, Electroanalysis, 2018, 30, 2612–2619 CrossRef CAS
.
- T. Priya, N. Dhanalakshmi, S. Thennarasu and N. Thinakaran, Carbohydr. Polym., 2018, 197, 366–374 CrossRef CAS
.
- J. Sotolářová, Š. Vinter and J. Filip, Colloids Surf. A Physicochem. Eng. Asp., 2021, 628, 127242 CrossRef
.
- Y. Cheng, B. Feng, X. Yang, P. Yang, Y. Ding, Y. Chen and J. Fei, Sens. Actuators, B, 2013, 182, 288–293 CrossRef CAS
.
- K. A. Alamry and A. Khan, Appl. Nanosci., 2021, 11, 1057–1074 CrossRef CAS
.
- A. Khan, K. A. Alamry, M. Oves and R. H. Althomali, J. Polym. Res., 2021, 28, 95 CrossRef CAS
.
- K. Vijayalakshmi, T. Gomathi, S. Latha, T. Hajeeth and P. N. Sudha, Int. J. Biol. Macromol., 2016, 82, 440–452 CrossRef CAS
.
- V. Durairaj, N. Wester, J. Etula, T. Laurila, J. Lehtonen, O. J. Rojas, N. Pahimanolis and J. Koskinen, J. Phys. Chem. C, 2019, 123, 24826–24836 CrossRef CAS
.
- S. Liu, K. He, X. Wu, X. Luo and B. Li, RSC Adv., 2015, 5, 87266–87276 RSC
.
- A. Khan, R. K. Jain, B. Ghosh, I. Inamuddin and A. M. Asiri, RSC Adv., 2018, 8, 25423–25435 RSC
.
- B. Song, C.-C. Tuan, X. Huang, L. Li, K.-S. Moon and C.-P. Wong, Mater. Lett., 2016, 166, 12–15 CrossRef CAS
.
- T. Soganci and M. Ak, Cellulose, 2019, 26, 2541–2555 CrossRef CAS
.
- M. Shadabfar, M. Ehsani, H. A. Khonakdar, M. Abdouss and T. Ameri, Cellulose, 2023, 30, 1759–1772 CrossRef CAS
.
- F. Loghin, A. Rivadeneyra, M. Becherer, P. Lugli and M. Bobinger, Nanomaterials, 2019, 9, 471 CrossRef CAS PubMed
.
- A. A. Abdillah and A. L. Charles, Int. J. Biol. Macromol., 2021, 191, 618–626 CrossRef CAS
.
- X.-L. Wei, M. Fahlman and A. J. Epstein, Macromolecules, 1999, 32, 3114–3117 CrossRef CAS
.
- Y. Wang, X. Dong, L. Zhao, Y. Xue, X. Zhao, Q. Li and Y. Xia, Nanomaterials, 2020, 10, 83 CrossRef CAS PubMed
.
- J. Bobacka, A. Lewenstam and A. Ivaska, J. Electroanal. Chem., 2000, 489, 17–27 CrossRef CAS
.
- A. M. Asiri, W. A. Adeosun, H. M. Marwani and M. M. Rahman, New J. Chem., 2020, 44, 2022–2032 RSC
.
- J. Ahmed, R. H. Rakib, M. M. Rahman, A. M. Asiri, I. A. Siddiquey, S. S. M. Islam and M. A. Hasnat, Chempluschem, 2019, 84, 175–182 CrossRef CAS PubMed
.
- F. Kuralay, M. Dumangöz and S. Tunç, Talanta, 2015, 144, 1133–1138 CrossRef CAS PubMed
.
- S. Aralekallu, M. Palanna, S. Hadimani, K. Prabhu C. P., V. A. Sajjan, M. O. Thotiyl and L. K. Sannegowda, Dalton Trans., 2020, 49, 15061–15071 RSC
.
- P. Deng, Z. Xu and J. Li, Microchim. Acta, 2014, 181, 1077–1084 CrossRef CAS
.
- Z. Huang, H. Song, L. Feng, J. Qin, Q. Wang, B. Guo, L. Wei, Y. Lu, H. Guo, D. Zhu, X. Ma, Y. Guo, H. Zheng, M. Li and Z. Su, Microchem. J., 2023, 186, 108346 CrossRef CAS
.
- M. B. Gumpu, M. Veerapandian, U. M. Krishnan and J. B. B. Rayappan, Chem. Eng. J., 2018, 351, 319–327 CrossRef CAS
.
- W. A. Adeosun, A. M. Asiri, H. M. Marwani and M. M. Rahman, ChemistrySelect, 2020, 5, 156–164 CrossRef CAS
.
- O. Benedito da Silva and S. A. S. Machado, Anal. Methods, 2012, 4, 2348 RSC
.
- K. Ahmad, P. Kumar and S. M. Mobin, Nanoscale Adv., 2020, 2, 502–511 RSC
.
- M. T. Uddin, M. M. Alam, A. M. Asiri, M. M. Rahman, T. Toupance and M. A. Islam, RSC Adv., 2020, 10, 122–132 RSC
.
- P. Kanyong, S. Rawlinson and J. Davis, Sens. Actuators, B, 2016, 233, 528–534 CrossRef CAS
.
- R. G. Krishnan, R. Rejithamol and B. Saraswathyamma, Microchem. J., 2020, 155, 104745 CrossRef CAS
.
- U. Sivasankaran, A. E. Vikraman, D. Thomas and K. G. Kumar, Food Anal. Methods, 2016, 9, 2115–2123 CrossRef
.
- Y. Chen, X. Liu, S. Guo, J. Cao, J. Zhou, J. Zuo and L. Bai, Biomaterials, 2019, 216, 119253 CrossRef CAS PubMed
.
Footnote |
| † Electronic supplementary information (ESI) available. See DOI: https://doi.org/10.1039/d3ra03808d |
| This journal is © The Royal Society of Chemistry 2023 |

