 Open Access Article
The construction of a biomass component interaction model based on research into the hydrothermal liquefaction of sewage sludge†
Lei Zhaoa,
Longfei Xiea,
Le Goua,
Liyi Dai*abc and
Yuanyuan Wang *abc
*abc
aShanghai Key Laboratory of Green Chemistry and Chemical Processes, School of Chemistry and Molecular Engineering, East China Normal University, Shanghai 200062, China. E-mail: ecnu_yywang@163.com; dai_liyi@163.com
bState Key Laboratory of Petroleum Molecular and Process Engineering, SKLPMPE, Sinopec Research Institute of Petroleum Processing Co., LTD., Beijing 100083, China
cState Key Laboratory of Petroleum Molecular and Process Engineering, SKLPMPE, East China Normal University, Shanghai 200062, China
First published on 11th September 2023
Abstract
Sewage sludge (SS), a hazardous solid waste with a high water and pollutant content, should be disposed of correctly. Hydrothermal liquefaction (HTL) shows tremendous potential to treat organic matter with substantial water content like SS. In this paper, we examined the impact of key factors on the characteristics and yield of bio-oil during HTL of SS. We clarified the impacts of each component on the yield through model compounds based on that and constructed a component additivity model for forecasting the bio-oil yield from biomass with complex component composition. In the reactions of the model compounds, cellulose showed synergistic interaction with protein and alkali lignin in the bio-oil yield but lipids showed antagonistic effects with protein and alkaline lignin. The co-HTL results of these binary mixtures improved our model and further clarified the reaction mechanism of HTL of SS.
1 Introduction
The rapid development of society has led to an increase in the demand for energy. Biomass resources have a large potential in energy production and recovery. As a result of social development, much sewage sludge (SS) has been produced. SS contains numerous contaminants, including pathogens, worm eggs, and heavy metal ions, making its environmentally sound treatment vital.1–4 SS has peculiar characteristics that make treating it challenging, including high water content, low relative density, high ash content, etc.5 Furthermore, the rapid development of human society has led to increased energy demand. SS contains many types of organic matter such as proteins (20–30%), lipids (10–25%), and carbohydrates (8–15%),6 which can be used as biomass resources for energy production and it has a large potential in energy recovery. Hydrothermal liquefaction (HTL) has drawn more interest for its benefits of not requiring drying due to the high water content in SS. HTL also has a low reaction temperature and a high production value, so it's suitable for handling the SS.7However, current studies regarding HTL of SS mainly concentrate on product properties8–12 and heavy metal distribution.13–17 The reaction pathways of the components in SS and their contribution to bio-oil have received comparatively little attention. This is because the comparatively complicated composition of SS presents challenges to directly studying the reaction mechanism through the HTL of SS data. It is better to simulate bio-oil generation by SS HTL using model compounds. In addition, based on the HTL of SS, a component additivity model can be constructed for forecasting the bio-oil yield obtained from biomass.
Guo et al.18 proposed a mathematical model for the hydrothermal liquefaction of biomass. Lu et al.19 had observed the existence of interactions between various biomass components in the HTL process. Moreover, many models have been developed to forecast bio-oil yields from HTL. However, these models20–22 mainly focus on algal biomass and consider only protein, lipid, and polysaccharide fractions. Furthermore, the models include relatively few reaction conditions, significantly deviating from the predicted results. Therefore, constructing models that consider more biomass components and HTL reaction conditions is beneficial for better prediction of bio-oil yields from biomass.
Therefore, this paper systematically evaluated the effects of three critical parameters and clarified the coupling influence mechanism of each key parameter in the SS HTL process. Also, the characteristics of bio-oil such as yield, elemental composition, higher heating value (HHV), and energy recovery, were comprehensively measured. To identify the changes in organic matter in the SS, the functional group structure and organic composition of bio-oil were determined by FTIR, TG–DTG, and GCMS. On this basis, HTL reactions were performed by model compounds to simulate the SS HTL process and clarify the conversion pathway of SS. A yield model was constructed based on the yield results to forecast bio-oil yields by contents of biomass components under various reaction conditions. This study contributes to a deeper comprehension of the SS HTL process and the relationships between the various biomass components.
2 Materials and methods
2.1 Materials
The municipal SS samples came from Xi'an Dengjia Village Wastewater Treatment (Xi'an, Shanxi Province, China). Dried the sludge at 105 °C to a constant weight in an oven, crushed, and then sieved to 100 mesh particle size for reserve. The moisture content of the raw sludge was 80.51%. The outcomes of elemental analysis, proximate analysis, and main organic matters composition of dry basis SS are shown in Table 1. The volatile content value (50.52%) in the dry basis SS demonstrates that it contains many organic matters and can be regarded as an ideal material for energy production and recovery. And for the four model compounds, egg white protein came from Suzhou Ovodan Egg Industry Co., which is a commercially available ingredient and cellulose (CAS: 9004-34-6), alkaline lignin (CAS: 8068-05-1), and glycerol tristearate (CAS: 555-43-1) came from Sinopharm Chemical Reagent Co.| Proximate analysis (wt%) | Elemental analysis (wt%) | Biochemical analysis (wt%) | |||
|---|---|---|---|---|---|
| Ash (A) | 52.91 | N | 3.62 | Protein | 19.9 |
| Volatile (V) | 41.95 | C | 20.78 | Polysaccharide | 8.2 |
| Fixed carbon (FC) | 5.14 | H | 3.31 | Lignin | 5.05 |
| S | 0.75 | Lipid | 4.2 | ||
| O | 15.99 | ||||
2.2 Experimental procedures
The HTL procedure was carried out by means of an intermittent stainless-steel reactor (316 stainless steel, PSK-30 mL, Nanjing Zhengxin Instruments Co., Ltd) furnished with a temperature control unit, a pressure control unit, and an electric heating device. In a typical HTL test, the raw materials were dispersed in 12 mL of deionized water to guarantee the same pressure conditions at the same reaction temperature. The reactor containing the raw materials was purged with nitrogen for three minutes to eliminate the effect of oxygen in the air, sealed, and then heated to the target experimental temperature (270–350 °C) for the reaction. Open the gas valve to release gas after the reaction has finished and cooled down. The mixture in the reactor was transferred to a beaker, and the dichloromethane (DCM) washing the product that was still in the reactor was to be collected. The collected product mixture was separated by filtration, and DCM phase and aqueous phase were then separated. Dried the solid product at 105 °C in an oven. DCM phase was distilled at 35 °C under low pressure, and then black sticky bio-oil was attained. Based on the weight of the dry base material, the bio-oil yield was estimated. Solid products were transferred to a mortar and ground well before analyzing to ensure the authenticity and representativeness. Before analysis, the bio-oil obtained were mixed well and filtered. To avoid experimental errors, each set of experiment was repeated at least twice.In this paper, the default reaction conditions are 350 °C, 30 min, and 12 mL g−1 unless otherwise labeled.
The products yield and the energy recovery are computed according to the following formula:
 | (1) |
 | (2) |
The higher heating value (HHV) was computed from the elemental analysis results by Dulong formula:
| HHV (MJ kg−1) = 0.335[C] + 1.423[H] − 0.154[O] − 0.145[N] | (3) |
2.3 Methods
The standard GB/T 30732-2014 was used for the determination of the proximate analysis of sludge raw materials. The standard GB 5009.5-2016 was used for the determination of protein content in sludge. The standard GB 5009.6-2016 was used for the determination of lipid content in sludge. Determination of polysaccharide and lignin content in sludge was carried out by potassium dichromate digestion titration method. An elemental analyzer (CHNS/O, Elementar UNICUBE, Germany) assessed the samples' concentrations of C, H, N, S, and O, and based on the above results, the HHV was estimated. By using a gas chromatography-mass spectrometry (GCMS) setup with a Rtx-5MS nonpolar chromatography column, the organic composition and relative content in the bio-oil were measured. High-purity helium was used as the carrier gas with a flow rate of 1.0 mL min−1. The Rtx-5MS chromatography column's temperature was initially set to 100 °C, ratcheted up to 280 °C at a rate of 10 °C min−1, and then retained at 280 °C for 22 min. A Nicolet iS 50 Fourier transform infrared spectrometer was utilized to identify functional groups of samples in the spectral range of 4000–600 cm−1. A thermogravimetric analyzer TGA/SDTA851E (TGA, METTLER TOLEDO) was utilized to measure the boiling point distribution and pyrolysis properties of the bio-oil. Samples were heated from room temperature (25 °C) to 800 °C at a rate of 10 °C min−1.23 In this paper, we also constructed a bio-oil yield prediction model with the following equation:
 | (4) |
3 Result and discussion
3.1 Characteristics of products
| Sample | N | C | H | S | O | HHV (MJ kg−1) |
|---|---|---|---|---|---|---|
| SS | 3.62 | 20.78 | 3.31 | 0.75 | 15.99 | 8.677 |
| 270 °C | 6.192 | 70.371 | 8.786 | 2.267 | 12.384 | 33.272 |
| 290 °C | 5.903 | 71.094 | 8.665 | 1.855 | 12.483 | 33.368 |
| 310 °C | 5.729 | 73.045 | 9.019 | 1.376 | 10.831 | 34.805 |
| 330 °C | 5.989 | 73.644 | 9.129 | 1.557 | 9.681 | 35.302 |
| 350 °C | 5.399 | 74.338 | 9.101 | 1.89 | 9.272 | 35.643 |
The results of further the elemental composition of bio-char at specific reaction temperatures are shown in Table 3. The bio-char contained many inorganic components from the SS feedstock, so the content of C and H and HHV were relatively low. They continuously decreased with the increasing reaction temperature, further indicating more organic materials conversion into bio-oil. Throughout HTL procedure, N and S contents remained the same. There were also some effects on the elemental content and HHV of bio-char from reaction time and reaction liquid–solid ratio, but the effects were minor.
| Sample | N | C | H | S | O | HHV (MJ kg−1) |
|---|---|---|---|---|---|---|
| 270 °C | 0.668 | 9.101 | 1.23 | 0.416 | 9.011 | 3.315 |
| 290 °C | 0.661 | 8.344 | 1.231 | 0.446 | 8.368 | 3.162 |
| 310 °C | 0.576 | 7.197 | 1.074 | 0.5 | 7.424 | 2.712 |
| 330 °C | 0.525 | 6.706 | 0.962 | 0.448 | 7.239 | 2.425 |
| 350 °C | 0.455 | 5.613 | 0.892 | 0.534 | 7.486 | 1.932 |
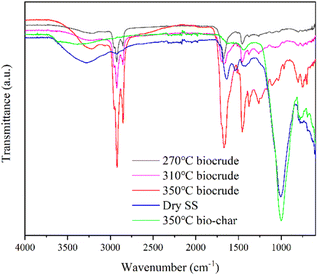
![[double bond, length as m-dash]](https://www.rsc.org/images/entities/char_e001.gif) O stretching vibration peak at ∼1670 cm−1 and C–O–C stretching vibration peak at 1100–1200 cm−1 implied that bio-oil contained more esters and amides,23 which was also consistent with the GCMS results. The weak broad peak at 3100–3400 cm−1 was probably O–H stretching vibration peak from the phenols and alcohols.23 Peaks of bio-char and SS feedstock were distinctly different from the spectrum of bio-oil. The strongest peaks at ∼1000 cm−1 in the bio-char and SS may correspond to stretching vibration peak of Si–O bonds.25 And the peak at 1400–1500 cm−1 for SS and bio-char may be attributed to the aromatic compounds,26 indicating that some unconverted organic matter is still present in the solid after HTL.
O stretching vibration peak at ∼1670 cm−1 and C–O–C stretching vibration peak at 1100–1200 cm−1 implied that bio-oil contained more esters and amides,23 which was also consistent with the GCMS results. The weak broad peak at 3100–3400 cm−1 was probably O–H stretching vibration peak from the phenols and alcohols.23 Peaks of bio-char and SS feedstock were distinctly different from the spectrum of bio-oil. The strongest peaks at ∼1000 cm−1 in the bio-char and SS may correspond to stretching vibration peak of Si–O bonds.25 And the peak at 1400–1500 cm−1 for SS and bio-char may be attributed to the aromatic compounds,26 indicating that some unconverted organic matter is still present in the solid after HTL.
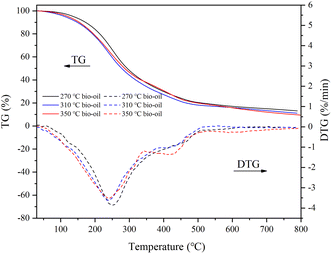
The bio-oil residues obtained at three temperature conditions were 13.15%, 11.14%, and 9.53%, respectively, which indicated that there were more small molecule components in bio-oil produced at high temperature and simpler to be decomposed. The presence of bio-oil residues indicates that some large molecular compounds that are difficult to decompose still exist in the bio-oil. Maximum weight loss rates of 3.86, 3.62, and 3.53% min−1 were achieved at 252.87, 238.72, and 240.88 °C, respectively. The decomposition of bio-oil obtained at various temperatures primarily happened in the range of 200–400 °C. There was a higher distillate content above 500 °C in the bio-oil obtained at 350 °C. This result may be caused because high reaction temperature encourages the dissociation of large molecular compounds and high temperature also induces the polymerization of small molecular components with low boiling points.
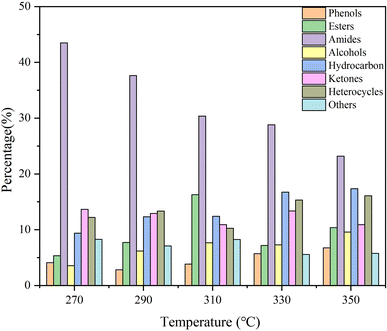
Considering the yield and HHV, bio-oil obtained at 350 °C was regarded as a representative to analyze the molecular composition. It contained many compounds containing N, O, or both of them and N of them was mainly derived from proteins, which also corresponded to the high protein content of SS. Amides were the most abundant detectable products among them. Notably, the molecular weights of the components detected by GCMS in bio-oil were relatively small. C4–C10 and C11–C20 molecules accounted for 28.38% and 47.71% of the total peak areas, respectively. There were also more steroid derivatives in bio-oil, which may come directly from the SS feedstock, indicating that they are difficult to decompose under the set reaction conditions. There were still some incompletely dissociated macromolecular compounds not eluting from the chromatography column.27 According to the results of GCMS, bio-oil contained many compounds containing N and O atoms, which led to a negative impact on the bio-oil qualities. Therefore, further treatment of bio-oil by a reaction such as deamination, dehydroxylation, and decarboxylation to enhance the HHV and qualities of bio-oil is essential.
3.2 Reaction pathways and interactions of the main components of SS
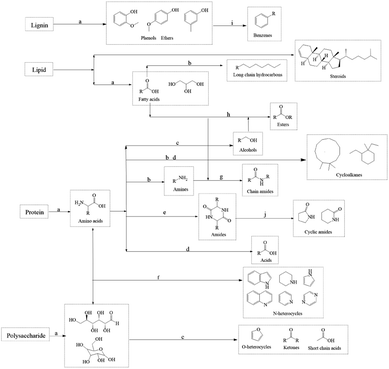
The composition of organic matters in the SS feedstock are shown in Table 1. There were complicated components in the SS, consisting of numerous macromolecules and inorganic substances, making the bio-oil that HTL produced a complex mixture as well. It is difficult to directly study the reaction mechanism of SS's HTL process. The influence of inorganic substances on the sludge hydrothermal liquefaction process is mainly reflected in the heavy metal ions, which will produce a catalytic effect in the hydrothermal liquefaction process and change the ratio of the components in the bio-oil.28,29 However, the types and contents of heavy metal ions in different kinds of biomass deviate greatly and the effect on bio-oil yield is relatively small, so in this paper we paid more attention to the effect of organic components on bio-oil yield. The principal organic components in SS include proteins, polysaccharides, lignins, and lipids. Therefore, we simulated the reaction process using four model compounds: egg white protein, cellulose, alkaline lignin, and glycerol tristearate.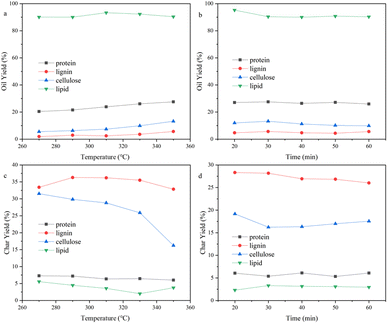 | ||
| Fig. 5 Effect of (a) reaction temperature, (b) reaction time on the bio-oil yield and effect of (c) reaction temperature, (d) reaction time on the bio-char yield of different components. | ||
The reaction temperature and time showed substantial impacts on the yield of bio-oil made by HTL from cellulose. The bio-oil yield increased whereas bio-char yield reduced noticeably as the reaction temperature rose. The bio-oil yield grew before dropping whereas the yield of bio-char altered in the opposite direction as reaction time rose. Hence, the largest bio-oil yield value (13.21%) was obtained at 350 °C, 30 min. The more hydrogen bonds and ether bonds in cellulose were weakened and broken as the reaction temperature rose, so cellulose was better hydrolyzed into small molecule fragments. The hydrolysis of cellulose produced a large number of ketones, while at any temperature, there were fewer alcohols in the bio-oil, probably because a large number of small molecule (C2–C4) alcohols produced remained in the aqueous phase. At lower reaction temperatures, there were many esters in bio-oil. High temperatures are advantageous to enhance bio-oil quality for the deoxygenation of cellulose, as evidenced by the fact that the amounts of esters reduced and the amounts of hydrocarbons and phenols increased to a greater extent as the temperature rose.
The yield of bio-oil produced from alkaline lignin by HTL was low, less than 6% under any of the experimental conditions, while the bio-char yield was higher than 25%, which was related to the difficulty of hydrolysis of the lignin structure itself. The hydrolysis of alkaline lignin produced many phenol compounds, which are highly polar and have a higher possibility of being water-soluble. It may also be the reason why bio-oil yield is low, which can be proved by dark color of the water phase. As the reaction temperature rose, the bio-oil yield dramatically improved. In contrast, it showed little variation with various reaction time, indicating that prolonging the reaction time would not promote the conversion of alkaline lignin. GCMS results showed that phenols such as guaiacol and ethers occupied the majority in bio-oil (>75%). The hydrocarbons content grew as the reaction temperature increased, and a minor number of PAHs also appeared. This suggested that continuing to raise the reaction temperature could convert bio-oil to the solids.
The yield of bio-oil produced from glycerol tristearate by HTL was high, about 90%. There was little impact on bio-oil yield in reaction temperature and time. At all reaction conditions, the bio-char yield was small (<5%). The primary parts in the bio-oil produced were l-(+)-ascorbic acid 2,6-dihexadecanoate and 2-(2-hydroxyethoxy) octadecanoic acid ethyl ester. At higher reaction temperatures, small amounts of long-chain hydrocarbons and aldehydes were present, indicating that glycerol tristearate's thermal stability is excellent and difficult to convert to small molecules within the experimental temperature (270–350 °C).
![[thin space (1/6-em)]](https://www.rsc.org/images/entities/char_2009.gif) :
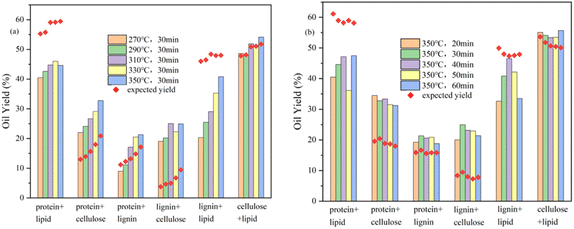
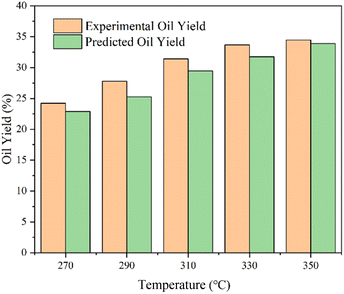
:![[thin space (1/6-em)]](https://www.rsc.org/images/entities/char_2009.gif) 1 (w/w) blending and the expected yields at various reaction temperatures. The bio-oil yield produced by HTL from cellulose and glycerol tristearate mixture is essentially the same as the expected yield. Cellulose has synergistic effects with both egg white protein and alkaline lignin. The former is mainly due to the Maillard reaction of the proteins with the small molecular sugars generated by the hydrolysis of cellulose, as indicated by more N-containing heterocycles in the GCMS results. The latter may be due to the alkalinity of alkaline lignin affecting the cellulose reaction process and promoting the hydrolysis of alkaline lignin at the same time.33,34 The egg white protein and glycerol tristearate mixture and the alkaline lignin and glycerol tristearate mixture showed the opposite results and lower bio-oil yields were obtained, which may be since the alkaline environment causing more lipid hydrolysis products to enter the aqueous phase and lowering the yields. The GCMS results of the egg white protein and glycerol tristearate mixture showed that ethyl-2-(2-hydroxyethoxy) octadecanoate and l-(+)-ascorbic acid 2,6-dihexadecanoate accounted for about half of the product, which indicated that the addition of proteins substantially reduced the bio-oil from the glycerol tristearate. The deviation of the alkaline lignin and glycerol tristearate mixture from the expected yield decreases with increasing reaction temperature and may also serve as favorable evidence for the above inference. The yield of the egg white protein and alkaline lignin mixture varied with the reaction temperature, being lower than expected at lower temperatures and the opposite at higher temperatures, indicating that the reaction temperature changed the reaction process of this binary mixture. The GCMS results showed increased ether content with increasing reaction temperature, indicating that high temperature and protein promoted alkaline lignin depolymerization and increased bio-oil yields. Fig. 6b shows the bio-oil yields of different binary mixtures blending and the expected yields at various reaction times. All the binary mixtures had small effect on bio-oil yield from reaction time and the change in yield relative to the expected value was similar to reaction temperatures.
1 (w/w) blending and the expected yields at various reaction temperatures. The bio-oil yield produced by HTL from cellulose and glycerol tristearate mixture is essentially the same as the expected yield. Cellulose has synergistic effects with both egg white protein and alkaline lignin. The former is mainly due to the Maillard reaction of the proteins with the small molecular sugars generated by the hydrolysis of cellulose, as indicated by more N-containing heterocycles in the GCMS results. The latter may be due to the alkalinity of alkaline lignin affecting the cellulose reaction process and promoting the hydrolysis of alkaline lignin at the same time.33,34 The egg white protein and glycerol tristearate mixture and the alkaline lignin and glycerol tristearate mixture showed the opposite results and lower bio-oil yields were obtained, which may be since the alkaline environment causing more lipid hydrolysis products to enter the aqueous phase and lowering the yields. The GCMS results of the egg white protein and glycerol tristearate mixture showed that ethyl-2-(2-hydroxyethoxy) octadecanoate and l-(+)-ascorbic acid 2,6-dihexadecanoate accounted for about half of the product, which indicated that the addition of proteins substantially reduced the bio-oil from the glycerol tristearate. The deviation of the alkaline lignin and glycerol tristearate mixture from the expected yield decreases with increasing reaction temperature and may also serve as favorable evidence for the above inference. The yield of the egg white protein and alkaline lignin mixture varied with the reaction temperature, being lower than expected at lower temperatures and the opposite at higher temperatures, indicating that the reaction temperature changed the reaction process of this binary mixture. The GCMS results showed increased ether content with increasing reaction temperature, indicating that high temperature and protein promoted alkaline lignin depolymerization and increased bio-oil yields. Fig. 6b shows the bio-oil yields of different binary mixtures blending and the expected yields at various reaction times. All the binary mixtures had small effect on bio-oil yield from reaction time and the change in yield relative to the expected value was similar to reaction temperatures.
After the parameters in the equation were determined by the yields of model compounds, the model was used to forecast bio-oil yields from various biomass HTL. To evaluate the model's correctness, the yields of biomass in the published literature in the HTL process were predicted. Table S1† shows the deviation values between predicted and experimental results. The deviation between the yield and the predicted value of other biomasses in the literature was also basically less than 5 wt%, proving the universality of the model. The division of polysaccharides in the literature was more detailed, including cellulose, hemicellulose, starch, etc. Reaction conditions were wider, which were to be further investigated to better refine this yield model.
4 Conclusions
In this work, we investigated the HTL process of SS. There was a significant effect from the reaction temperature in SS HTL processes. The maximum value of yield and HHV in bio-oil were attained at 350 °C with 11.43% and 35.643 MJ kg−1, respectively. We evaluated the reaction pathway of SS HTL by model compounds and based on which a component additivity model was proposed to predict the bio-oil yield of complex component biomass. Considering that the applicability of the model still needs to be improved, further investigation should be carried out in the follow-up work.Author contributions
Lei Zhao: conceptualization, methodology, investigation, data curation, writing – original draft, writing – review & editing. Longfei Xie: methodology, investigation, visualization. Le Gou: methodology, investigation, visualization. Liyi Dai: supervision, visualization, funding acquisition, writing – review & editing. Yuanyuan Wang: conceptualization, supervision, visualization, writing – review & editing.Conflicts of interest
There are no conflicts to declare.Acknowledgements
This work is financially supported by the National Key R&D Program of China (No. 2021YFE0104900, 2020YFA0710200), and the National Natural Science Foundation of China (No. 22078103).Notes and references
- A. Magdziarz, A. K. Dalai and J. A. Koziński, Chemical composition, character and reactivity of renewable fuel ashes, Fuel, 2016, 176, 135–145 CrossRef CAS.
- H. Liu, G. Hu, I. A. Basar, J. Li, N. Lyczko, A. Nzihou and C. Eskicioglu, Phosphorus recovery from municipal sludge-derived ash and hydrochar through wet-chemical technology: A review towards sustainable waste management, Chem. Eng. J., 2021, 417, 129300 CrossRef CAS.
- M. Hu, Z. Ye, H. Zhang, B. Chen, Z. Pan and J. Wang, Thermochemical conversion of sewage sludge for energy and resource recovery: technical challenges and prospects, Environ. Pollut. Bioavailability, 2021, 33, 145–163 CrossRef CAS.
- M. Ma, D. Xu, Y. Zhi, W. Yang, P. Duan and Z. Wu, Co-pyrolysis re-use of sludge and biomass waste: Development, kinetics, synergistic mechanism and industrialization, J. Anal. Appl. Pyrolysis, 2022, 168, 105746 CrossRef CAS.
- P. Manara and A. Zabaniotou, Towards sewage sludge based biofuels via thermochemical conversion – A review, Renewable Sustainable Energy Rev., 2012, 16, 2566–2582 CrossRef CAS.
- V. Kumar, K. K. Jaiswal, M. S. Vlaskin, M. Nanda, M. K. Tripathi, P. Gururani, S. Kumar and H. C. Joshi, Hydrothermal liquefaction of municipal wastewater sludge and nutrient recovery from the aqueous phase, Biofuels, 2021, 13, 657–662 CrossRef.
- Y. Fan, U. Hornung and N. Dahmen, Hydrothermal liquefaction of sewage sludge for biofuel application: A review on fundamentals, current challenges and strategies, Biomass Bioenergy, 2022, 165, 106570 CrossRef CAS.
- H. J. Huang, X. Z. Yuan, B. T. Li, Y. D. Xiao and G. M. Zeng, Thermochemical liquefaction characteristics of sewage sludge in different organic solvents, J. Anal. Appl. Pyrolysis, 2014, 109, 176–184 CrossRef CAS.
- L. Leng, X. Yuan, X. Chen, H. Huang, H. Wang, H. Li, R. Zhu, S. Li and G. Zeng, Characterization of liquefaction bio-oil from sewage sludge and its solubilization in diesel microemulsion, Energy, 2015, 82, 218–228 CrossRef CAS.
- B. Maddi, E. Panisko, T. Wietsma, T. Lemmon, M. Swita, K. Albrecht and D. Howe, Quantitative Characterization of Aqueous Byproducts from Hydrothermal Liquefaction of Municipal Wastes, Food Industry Wastes, and Biomass Grown on Waste, ACS Sustain. Chem. Eng., 2017, 5, 2205–2214 CrossRef CAS.
- T. Yanagida, S. Fujimoto and T. Minowa, Application of the severity parameter for predicting viscosity during hydrothermal processing of dewatered sewage sludge for a commercial PFBC plant, Bioresour. Technol., 2010, 101, 2043–2045 CrossRef CAS PubMed.
- L. Leng, J. Zhou, T. Li, M. Vlaskin, H. Zhan, H. Peng, H. Huang and H. Li, Nitrogen heterocycles in bio-oil produced from hydrothermal liquefaction of biomass: A review, Fuel, 2023, 335, 126995 CrossRef CAS.
- Y. Zhai, H. Chen, B. Xu, B. Xiang, Z. Chen, C. Li and G. Zeng, Influence of sewage sludge-based activated carbon and temperature on the liquefaction of sewage sludge: yield and composition of bio-oil, immobilization and risk assessment of heavy metals, Bioresour. Technol., 2014, 159, 72–79 CrossRef CAS PubMed.
- H. J. Huang and X. Z. Yuan, The migration and transformation behaviors of heavy metals during the hydrothermal treatment of sewage sludge, Bioresour. Technol., 2016, 200, 991–998 CrossRef CAS PubMed.
- L. Leng, X. Yuan, J. Shao, H. Huang, H. Wang, H. Li, X. Chen and G. Zeng, Study on demetalization of sewage sludge by sequential extraction before liquefaction for the production of cleaner bio-oil and bio-char, Bioresour. Technol., 2016, 200, 320–327 CrossRef CAS PubMed.
- X. Yuan, L. Leng, H. Huang, X. Chen, H. Wang, Z. Xiao, Y. Zhai, H. Chen and G. Zeng, Speciation and environmental risk assessment of heavy metal in bio-oil from liquefaction/pyrolysis of sewage sludge, Chemosphere, 2015, 120, 645–652 CrossRef CAS PubMed.
- H. Chen, Y. Zhai, B. Xu, B. Xiang, L. Zhu, L. Qiu, X. Liu, C. Li and G. Zeng, Fate and risk assessment of heavy metals in residue from co-liquefaction of Camellia oleifera cake and sewage sludge in supercritical ethanol, Bioresour. Technol., 2014, 167, 578–581 CrossRef CAS PubMed.
- B. Hao, D. Xu, Y. Wei, Y. Diao, L. Yang, L. Fan and Y. Guo, Mathematical models application in optimization of hydrothermal liquefaction of biomass, Fuel Process. Technol., 2023, 243, 107673 CrossRef CAS.
- J. Lu, Z. Liu, Y. Zhang and P. E. Savage, Synergistic and Antagonistic Interactions during Hydrothermal Liquefaction of Soybean Oil, Soy Protein, Cellulose, Xylose, and Lignin, ACS Sustain. Chem. Eng., 2018, 6, 14501–14509 CrossRef CAS.
- P. Biller and A. B. Ross, Potential yields and properties of oil from the hydrothermal liquefaction of microalgae with different biochemical content, Bioresour. Technol., 2011, 102, 215–225 CrossRef CAS PubMed.
- S. Leow, J. R. Witter, D. R. Vardon, B. K. Sharma, J. S. Guest and T. J. Strathmann, Prediction of microalgae hydrothermal liquefaction products from feedstock biochemical composition, Green Chem., 2015, 17, 3584–3599 RSC.
- Y. Li, S. Leow, A. C. Fedders, B. K. Sharma, J. S. Guest and T. J. Strathmann, Quantitative multiphase model for hydrothermal liquefaction of algal biomass, Green Chem., 2017, 19, 1163–1174 RSC.
- R. Li, W. Teng, Y. Li and E. Liu, Liquefaction of Sewage Sludge To Produce Bio-oil in Different Organic Solvents with In Situ Hydrogenation, Energy Fuels, 2019, 33, 7415–7423 CrossRef CAS.
- T. F. Lu, K. Jan and W. T. Chen, Hydrothermal liquefaction of pretreated polyethylene-based ocean-bound plastic waste in supercritical water, J. Energy Inst., 2022, 105, 282–292 CrossRef CAS.
- Z. X. Xu, H. Song, S. Zhang, S. Q. Tong, Z. X. He, Q. Wang, B. Li and X. Hu, Co-hydrothermal carbonization of digested sewage sludge and cow dung biogas residue: Investigation of the reaction characteristics, Energy, 2019, 187, 115972 CrossRef CAS.
- D. Xu, G. Lin, L. Liu, Y. Wang, Z. Jing and S. Wang, Comprehensive evaluation on product characteristics of fast hydrothermal liquefaction of sewage sludge at different temperatures, Energy, 2018, 159, 686–695 CrossRef CAS.
- P. J. Valdez, J. G. Dickinson and P. E. Savage, Characterization of Product Fractions from Hydrothermal Liquefaction of Nannochloropsis sp. and the Influence of Solvents, Energy Fuels, 2011, 25, 3235–3243 CrossRef CAS.
- B. Li, H. Song, T. Yang, E. Liu and R. Li, Hydrothermal liquefaction of sewage sludge and model compound: Heavy metals distribution and behaviors, J. Anal. Appl. Pyrolysis, 2023, 169, 105800 CrossRef CAS.
- M. Piccini, S. Raikova, M. J. Allen and C. J. Chuck, A synergistic use of microalgae and macroalgae for heavy metal bioremediation and bioenergy production through hydrothermal liquefaction, Sustainable Energy Fuels, 2019, 3, 292–301 RSC.
- L. Luo, L. Dai and P. E. Savage, Catalytic Hydrothermal Liquefaction of Soy Protein Concentrate, Energy Fuels, 2015, 29, 3208–3214 CrossRef CAS.
- C. Zhang, X. Tang, L. Sheng and X. Yang, Enhancing the performance of Co-hydrothermal liquefaction for mixed algae strains by the Maillard reaction, Green Chem., 2016, 18, 2542–2553 RSC.
- J. D. Sheehan and P. E. Savage, Products, Pathways, and Kinetics for the Fast Hydrothermal Liquefaction of Soy Protein Isolate, ACS Sustain. Chem. Eng., 2016, 4, 6931–6939 CrossRef CAS.
- S. Yin and Z. Tan, Hydrothermal liquefaction of cellulose to bio-oil under acidic, neutral and alkaline conditions, Appl. Energy, 2012, 92, 234–239 CrossRef CAS.
- X. Ding, S. Mahadevan Subramanya, T. Fang, Y. Guo and P. E. Savage, Effects of Potassium Phosphates on Hydrothermal Liquefaction of Triglyceride, Protein, and Polysaccharide, Energy Fuels, 2020, 34, 15313–15321 CrossRef CAS.
- A. A. Peterson, R. P. Lachance and J. W. Tester, Kinetic Evidence of the Maillard Reaction in Hydrothermal Biomass Processing: Glucose–Glycine Interactions in High-Temperature, High-Pressure Water, Ind. Eng. Chem. Res., 2010, 49, 2107–2117 CrossRef CAS.
- L. Sheng, X. Wang and X. Yang, Prediction model of biocrude yield and nitrogen heterocyclic compounds analysis by hydrothermal liquefaction of microalgae with model compounds, Bioresour. Technol., 2018, 247, 14–20 CrossRef CAS PubMed.
- S. Mahadevan Subramanya and P. E. Savage, Identifying and Modeling Interactions between Biomass Components during Hydrothermal Liquefaction in Sub-, Near-, and Supercritical Water, ACS Sustain. Chem. Eng., 2021, 9, 13874–13882 CrossRef CAS.
- A. A. Peterson, F. Vogel, R. P. Lachance, M. Fröling, J. M. J. Antal and J. W. Tester, Thermochemical biofuel production in hydrothermal media: A review of sub- and supercritical water technologies, Energy Environ. Sci., 2008, 1, 32–65 RSC.
- J. Zhang, W. T. Chen, P. Zhang, Z. Luo and Y. Zhang, Hydrothermal liquefaction of Chlorella pyrenoidosa in sub- and supercritical ethanol with heterogeneous catalysts, Bioresour. Technol., 2013, 133, 389–397 CrossRef CAS PubMed.
- W. Chen, H. Yang, Y. Chen, K. Li, M. Xia and H. Chen, Influence of Biochar Addition on Nitrogen Transformation during Copyrolysis of Algae and Lignocellulosic Biomass, Environ. Sci. Technol., 2018, 52, 9514–9521 CrossRef CAS PubMed.
- S. Guo, T. Liu, J. Hui, D. Che, X. Li, B. Sun and S. Li, Effects of calcium oxide on nitrogen oxide precursor formation during sludge protein pyrolysis, Energy, 2019, 189, 116217 CrossRef CAS.
- Z. X. Xu, L. Xu, J. H. Cheng, Z. X. He, Q. Wang and X. Hu, Investigation of pathways for transformation of N-heterocycle compounds during sewage sludge pyrolysis process, Fuel Process. Technol., 2018, 182, 37–44 CrossRef CAS.
- H. Zhan, X. Zhuang, Y. Song, X. Yin and C. Wu, Insights into the evolution of fuel-N to NOx precursors during pyrolysis of N-rich nonlignocellulosic biomass, Appl. Energy, 2018, 219, 20–33 CrossRef CAS.
- P. T. Williams and J. Onwudili, Composition of Products from the Supercritical Water Gasification of Glucose: A Model Biomass Compound, Ind. Eng. Chem. Res., 2005, 44, 8739–8749 CrossRef CAS.
Footnote |
| † Electronic supplementary information (ESI) available. See DOI: https://doi.org/10.1039/d3ra03809b |
| This journal is © The Royal Society of Chemistry 2023 |


