 Open Access Article
Solvothermal synthesis of organoclay/Cu-MOF composite and its application in film modified GCE for simultaneous electrochemical detection of deoxyepinephrine, acetaminophen and tyrosine†
Edwige Mouafo-Tchindaab,
Justin Claude Kemmegne-Mbouguen *a,
Charles Peguy Nanseu-Njikib,
Henrietta W. Langmi
 c,
Chrispin Kowenjed,
Nicholas M. Musyoka
 e and
Robert Mokaya
 *f
*f
aLaboratory of Porous Materials for Sensors and Energy, Faculty of Science, University of Yaounde 1, P. O. Box 812, Yaoundé, Cameroon. E-mail: jkemmeg@yahoo.fr
bLaboratoire d’Electrochimie et de Génie des Materiaux, Faculté des Science, B. P 812, Yaoundé, Cameroon
cDepartment of Chemistry, University of Pretoria, Private Bag, X20 Hatfield, 0028, South Africa
dDepartment of Chemistry, Maseno University, P. O. Box, 333-40105, Maseno, Kenya
eNanotechnology Research and Application Center (SUNUM), Sabanci University, Istanbul, 34956, Turkey
fSchool of Chemistry, University of Nottingham, University Park, Nottingham, NG7 2RD, UK. E-mail: r.mokaya@nottingham.ac.uk
First published on 11th July 2023
Abstract
An organoclay/copper-based metal–organic framework (MOF) composite was synthesized using a solvothermal method by growing a Cu-BTC (copper(II) benzene-1,3,5-tricarboxylate) MOF from a mixture of the MOF precursor solution in which various amounts of organoclay had been dispersed. The organoclay was obtained by intercalating a cationic dye, namely thionin, into a natural Cameroonian clay sampled in Sagba deposit (North West of Cameroon). The organoclay and the as-synthesized composites were characterized by X-ray diffraction (XRD), Fourier-transform infrared spectroscopy (FT-IR), scanning electron microscopy (SEM) and Brunauer, Emmett and Teller (BET) techniques. From Scherrer's equation, the crystallite size of the composite was found to be between 55 and 58 nm, twice as large as the pristine MOF's crystallite size. The organoclay/Cu-MOF composite (Sa-TN50/Cu3(BTC)2) exhibiting a BET surface area of 192 m2 g−1, about twice that of pristine clay and about one seventh that of pristine MOF, was then utilized to form a stable thin film onto glassy carbon electrodes (GCE) by drop coating (Sa-TN50/Cu3(BTC)2/GCE). These electrodes demonstrated electrocatalytic behavior toward deoxyepinephrine (DXEP) and thus enabled selective and simultaneous sensitive detection of three analytes: DXEP, acetaminophen (AC) and tyrosine (TYR) compared with bare GCE and clay modified electrode. Under optimum conditions, Sa-TN50/Cu3(BTC)2/GCE exhibited good performance including large calibration curves ranging from 5.0 μM to 138.0 μM for DXEP, 4.0 μM to 153.0 μM for AC and 1.0 μM to 29.4 μM for TYR. The detection limits were found to be, 0.4 μM, 0.7 μM and 0.2 μM for DXEP, AC and TYR, respectively. The developed sensors have been applied successfully in the quantification of AC in a commercial tablet of AC, and DXEP, AC and TYR in tap water.
1. Introduction
Clay minerals are natural layered aluminosilicates consisting of a tetrahedral and an octahedral sheet in either 1![[thin space (1/6-em)]](https://www.rsc.org/images/entities/char_2009.gif) :
:![[thin space (1/6-em)]](https://www.rsc.org/images/entities/char_2009.gif) 1 or 2
1 or 2![[thin space (1/6-em)]](https://www.rsc.org/images/entities/char_2009.gif) :
:![[thin space (1/6-em)]](https://www.rsc.org/images/entities/char_2009.gif) 1 configuration. Clays may be used in a variety of applications ranging from agriculture to surface coating and environmental use1 because of their interesting features including, large specific area, good catalytic support properties, thermal stability and mechanical stability as well as low cost. Among clay materials, the smectite group which is a 2
1 configuration. Clays may be used in a variety of applications ranging from agriculture to surface coating and environmental use1 because of their interesting features including, large specific area, good catalytic support properties, thermal stability and mechanical stability as well as low cost. Among clay materials, the smectite group which is a 2![[thin space (1/6-em)]](https://www.rsc.org/images/entities/char_2009.gif) :
:![[thin space (1/6-em)]](https://www.rsc.org/images/entities/char_2009.gif) 1 phyllosilicate, has attracted considerable attention owing to its particle size, high surface area, ion exchange capacity, swelling property, chemical stability and thermal stability.2 Smectites have been efficiently used for the removal from the environment of heavy metals3 and dyes,4,5 both of which are longstanding environmental pollutants.
1 phyllosilicate, has attracted considerable attention owing to its particle size, high surface area, ion exchange capacity, swelling property, chemical stability and thermal stability.2 Smectites have been efficiently used for the removal from the environment of heavy metals3 and dyes,4,5 both of which are longstanding environmental pollutants.
Thanks to the attractive properties of smectites, they have also attracted much attention in the field of electrochemistry since the pioneering work of Gosh and Bard in 1983.6 In order to improve selectivity and sensitivity as electrode modifiers, organic–inorganic hybrids namely organoclays, may be prepared via either grafting of specific organic moieties onto the clay surface or by intercalating organic species in the interlayer region of the clay. In such scenarios, the organic species also convert the interlayer space of smectites from hydrophilic to hydrophobic.7,8 Organoclay and clay modified electrodes have been explored successfully as immunosensors, biosensors9,10 and sensors11,12 despite their insulating character which can be overcome by using redox mediators. The redox mediators are used for electroanalytical applications to either increase the electrochemical response or to decrease the overpotential, or both. The mediators, which can be organic or inorganic molecules, may be located within the clay13 or in the interlayer region of the clay.14
Recently, other organic–inorganic porous materials, namely metal–organic frameworks (MOFs), have emerged as possible electrode modifiers in voltammetry determination of inorganic or organic species11,15 although research in this area is still in the early stages.16 Several routes for MOF synthesis have been reported including electrochemical synthesis, microwave assisted synthesis, sonochemical synthesis, mechanochemical synthesis, evaporation synthesis, microfluidic synthesis, and solvothermal synthesis. Among these MOFs preparation techniques, solvothermal synthesis appears to be the most preferable method, owing to the fast reaction kinetics, and production of uniform products with high phase purity and crystallinity.17,18 MOFs display interesting physicochemical properties including high surface area, tunable pore size and good chemical reactivity.16 By combining highly porous structures with a specific functional group, MOF modified electrodes can offer rapid diffusion of the analyte into their pores and thus improve framework–analyte interactions, which would enhance analyte detection. In addition to these interesting properties, MOFs exhibit good redox conductivity, which is enabled by their large porosity,19 thus making them suitable for electrocatalytic reactions.19,20 More recently, research is growing in the area of the synthesis of MOF composites with synergetic and new interesting properties such as exceptional electrochemical activity, conductivity and stability, thus overcoming low conductivity and lack of chemical stability encountered for pristine MOFs.21 To date, MOF-based composites for electrochemical sensing have focused on MOF/carbon composites,22–24 MOF/metal nanoparticle composites,22 MOF/metal oxide composites,22,25 MOF/polymer composites,22 MOF/polyoxometalate composites22,23,26 and more recently organoclay MOF.11 Although MOF-based composite modified electrodes exhibit excellent sensitivity and selectivity toward organic and inorganic targets,16 the composite film on the electrode surface requires stabilization, which has mainly been achieved by using a conductive polymer such as Nafion.
In this work, we report on the solvothermal synthesis of an organoclay/Cu-MOF (Cu3(BTC)2) composite exhibiting the ability to form a stable film on glassy carbon electrode (GCE) without a polymer and further investigate the film GCE redox accessibility, electrochemical catalysis and electrochemical sensing activity toward three physiologically important compounds: deoxyepinephrine (DXEP), acetaminophen (AC) and tyrosine (TYR). Deoxyepinephrine or N-methyldopamine, is a derivative of catecholamine, which is present in insects and plants.27 As a drug, DXEP is suitable for epinephrine substitution and is used to relieve high blood pressure, and for the treatment of cardiovascular arrest and congestive heart failure.28 Acetaminophen or paracetamol (N-aminophenol) is a popular analgesic and antipyretic drug, of which an overdose can cause serious health complications.29 Tyrosine (4-hydroxyphenylalanine) is an amino acid derivative of phenylalanine indispensable for maintainance of nitrogen (N) balance in humans. It is also a very important precursor for the synthesis of some catecholamines.30 In biological fluids, acetaminophen often coexist and interfere with catecholamines.31 For all these reasons, the monitoring of these three compounds is essential for the human wellbeing. Even if several successful methods for the quantification of these analytes are available,32–34 electrochemical methods offer a most promising approach even though electrochemical determination of catecholamine, acetaminophen and tyrosine at bare conventional electrodes suffer from electrode fouling, slow electron transfer and interference of their electrochemical response.35–37
2. Experimental
2.1 Materials, chemicals and reagents
The natural clay, predominantly containing smectite, was collected from Sabga deposit (North West Cameroon in Central Africa) and its fine fraction was utilized to prepare the organoclay. The clay fine fraction (particles <2 μm) was obtained by the process of sedimentation of the pristine clay and then converted into its sodium form as reported elsewhere.13 The homoionic fine fraction (namely Sa) was then collected as reported in the literature.38 Copper(II) nitrate trihydrate (Cu(NO3)2·3H2O) (Abcr Chemical, 99.5%), trimesic acid (Sigma Aldrich, 98%), ethanol (Abcr Chemical, 99.8%)), N,N-dimethylformamide (DMF, Abcr Chemical, 99.8%), hydrochloric acid (HCl, Sigma Aldrich, 36.8–38%), deoxyepinephrine (DXEP, Abcr Chemical, 99%), acetaminophen (AC, Sigma, 98.%), tyrosine (TYR, Sigma, 98%), K2HPO4 (Sigma, 98%), KH2PO4 (Sigma, 98%), KCl (Synth Lab, 99%), CH3COOH (Synth Lab, 99.8%), and CH3COONa (Synth Lab, 99%) were purchased and used without any treatment.2.2 Dye adsorption study and preparation of organoclay
The organoclay was prepared by absorbing thionin acetate dye into a natural Cameroonian, clay predominantly made of smectite, with surface area and cation exchange capacity (CEC) of 86 m2 g−1 and 0.89 meq. g−1, respectively.39 Optimal conditions for the absorption of the dye by the clay were firstly determined. Experimentally, a known amount of sodium homoionic clay (fine fraction) was introduced into a 50 mL vial containing the thionin acetate dye (20.0 μM). The suspension was sonicated for 30 minutes and then magnetic stirred for a fixed time (1–60 min) after which it was allowed to attain exchange equilibrium. The solid was collected and the filtrate had no thionin dye according to spectrophotometry, which showed no characteristic absorption band at 600 nm.40 The amount of dye adsorption was evaluated using eqn (1).
 | (1) |
The organoclay was prepared by intercalating the thionin acetate dye into a natural Cameroonian clay (Sa) interlayer space. 2.0 g of Sa was dispersed in 250.0 mL of dye (20.0 μM, pH 7) and stirred for 30 min. The solid organoclay, designated as Sa-TN, was collected by centrifugation and washed with distilled water and then dried in an oven at 50 °C.
2.3 Preparation of Cu-MOF and organocly/Cu-MOF composite
The copper MOF (Cu3 (BTC)2) was synthesized following a solvothermal method, as previously reported41 but with slight modification. In this case, 1 mmole of Cu(NO3)2·3H2O and 0.67 mmoles of trimesic acid were dissolved in a solvent mixture made of DMF (12 mL), ethanol (8 mL) and water (10 mL). The obtained solution was transferred into a 50 mL PTFE Teflon lined autoclave and thoroughly mixed for 10 min and then heated in an oven for 17 h at 80 °C. After cooling to room temperature, the resulting suspension was filtered and the resulting blue material was thoroughly washed with DMF/Ethanol/water mixture before being dried for 24 hours at 80 °C42,43 to yield a blue colored powder.The organoclay MOF composite was synthesized following a solvothermal method. Typically, a solvent mixture containing Cu-MOF precursors (i.e., that which is used to prepare the pristine MOF) was added slowly to a PTFE Teflon lined autoclave containing well dispersed organoclay suspension, which was prepared by suspending a given amount of organoclay in ethanol/water (2/3) solvent mixture under stirring. The mixture was then heated in an oven at 80 °C for 17 h. The amount of organoclay was varied from nil to 50% while the composition of MOF precursor was kept constant, and the obtained composite was denoted Sa-TNx/Cu-BTC (x is the mass percentage of organoclay added i.e. 5% for Sa-TN5/Cu3(BTC)2, 10% for Sa-TN10/Cu3(BTC)2, 25% for Sa-TN25/Cu3(BTC)2 and 50% for Sa-TN50/Cu3(BTC)2).
2.4 Preparation of the working electrodes
The working electrode was made using glassy carbon (GCE, Ø = 2 mm) as substrate. Prior to its utilization and modification, the bare glassy carbon was polished to a mirror like surface with three different sizes of alumina (1, 0.3 and 0.05 μm) suspension slurry on individual polishing pad, followed by thorough rinsing with distilled water and sonication in a 1![[thin space (1/6-em)]](https://www.rsc.org/images/entities/char_2009.gif) :
:![[thin space (1/6-em)]](https://www.rsc.org/images/entities/char_2009.gif) 1 mixture of ethanol and water. Modification of the glassy carbon was achieved by depositing some microliters of the suspension of composite prepared in DMF onto the electrode surface. The coating was left to dry for 4 h at room temperature. The obtained electrode was denoted Sa/GCE, Sa-TN/GCE, Sa-TN/Cu3(BTC)2/GCE when the modifier suspension was made of pristine clay (Sa), organoclay (Sa-TN) and the composite (Sa-TN/Cu3(BTC)2), respectively.
1 mixture of ethanol and water. Modification of the glassy carbon was achieved by depositing some microliters of the suspension of composite prepared in DMF onto the electrode surface. The coating was left to dry for 4 h at room temperature. The obtained electrode was denoted Sa/GCE, Sa-TN/GCE, Sa-TN/Cu3(BTC)2/GCE when the modifier suspension was made of pristine clay (Sa), organoclay (Sa-TN) and the composite (Sa-TN/Cu3(BTC)2), respectively.
2.5 Instrumentation
Fourier transform infrared (FTIR) spectra of pristine samples and composites were recorded using an attenuated total reflection FT-IR spectrophotometer (Bruker Alpha – T-Spectrophotometer). Powder X-ray diffraction (XRD) analyses were performed with a Bruker X-ray diffractometer D8-Advance with Cu-Kα radiation. Scanning electron microscopy (SEM) coupled with energy dispersed spectroscopy (EDS) analyses were performed with Auriga SEM. A micromeritics sorptometer was used to determine the surface area and porosity from nitrogen adsorption–desorption isotherms obtained at 77 K. μ-Autolab Potentiostat (PGSTAT 12) controlled by GPES software was used for electrochemistry experiments in aerobic condition in three electrodes cell: glassy carbon electrode (GCE) as solid substrate for working electrode, saturated calomel electrode (SCE) as reference electrode and platinum wire as counter electrode. Differential pulse voltammetry (DPV) was carried out in the potential interval ranging from 0 to 0.9 V with scan rate of 50 mV s−1 (modulation amplitude of 0.04995 V, step potential of 0.00495 V, modulation time of 0.05 s and interval time of 0.1 s).3. Results and discussion
3.1 Kinetic study of the adsorption of thionin by Sa clay
The adsorption kinetics of the thionin dye onto clay fine fraction (Sa) are shown in Fig. S1.† As observed an adsorption rate was achieved in the first 7 min., and equilibrium was achieved within 30 min. The adsorption kinetic study of TN by clay is better fitted for a pseudo second order model (R2 = 0.9999) (Fig. S1B†), indicating that the adsorption process of TN by Sa likely involved chemical interactions.44 The adsorption isotherm of TN by Sa is presented in Fig. S1C.† As revealed by Fig. S1D and data in Table S1,† the equilibrium data fitted the Langmuir model better. These results suggest that the adsorption of the dye occurs as monolayer onto clay surface. At pH 7, the clay shows high adsorption capacity (1.99 μmol g−1), given that at this pH the clay is negatively charged thus, it will interact electrostatically with the cationic dye.453.2 Physicochemical properties of organoclay and organoclay Cu-MOF composite
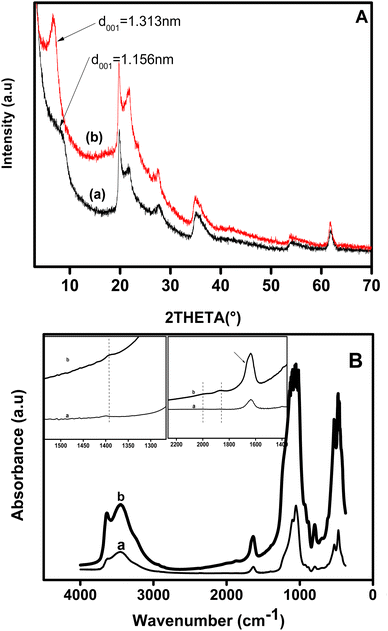
The homoionic clay and organoclay were characterized by XRD and their patterns are shown in Fig. 1A. As shown on both diffraction patterns of pristine clay (pattern a) and modified clay (pattern b), the d001 peak is located at 2θ of 8.12° and 6.79°, respectively. This finding indicates that the interlayer space of the pristine clay has expanded from 11.56 to 13.13 Å, i.e. by ca. 1.56 Å, indicating that the dye was located in the interlayer space. The expansion indicated that the cationic dye intercalated into clay with the plane of its carbon parallel to the clay sheet plane, given that the cationic thionin dye is a flat molecule of size 7.2 × 15 Å on the basis of van der Waals radii.2Fig. 1B shows the FT-IR spectrum of pristine clay before (Fig. 1B, spectra a) and after the intercalation of the dye into its interlayer (Fig. 1B, spectra b). For the pristine clay (curve a), the –OH stretching vibration band was observed at 3627 cm−1, while bands at 3460 and 1630 cm−1 were attributed to the bending mode vibration of absorbed water. The broad band at 1050 cm−1 was ascribed to the asymmetric stretching vibration of Si–O in the Si–O–Si group, and shifted to 1060 cm−1 for the organoclay (curve b). The band at ca 1600 cm−1 on the spectrum of dye intercalated clay showed a little shoulder 1660 cm−1 attributed to the N–H bending mode of the dye. Two weak bands that appeared at 1869 and 2038 cm−1 in curve b and were absent in spectrum a, may be assigned to the overtone band of the aromatic. The band occurring at 1393 cm−1 for organoclay was attributed to the C![[double bond, length as m-dash]](https://www.rsc.org/images/entities/char_e001.gif) C skeleton stretching.
C skeleton stretching.
Fig. 2A presents the XRD patterns of pristine Cu-MOF (pattern a) and organoclay/Cu-MOF composites (patterns b and c) prepared with different amounts of organoclay. The patterns show narrow and intense peaks, indicating good crystallinity for the as-synthesized products. The XRD pattern of the pristine MOF shows characteristic peaks of Cu-MOF at 2θ = 5.6°, 6.7°, 9.5°, 11.6°, 13.5°, 17.5°,19.0° and 25.8°. The as-synthesised material contained CuO and Cu2O as revealed by the characteristic XRD peaks at 2θ = 35.5° and 38.7° for the first copper oxide and 36.4° for the second.46,47 The patterns of the as-synthesized composites, Sa-TN10/Cu3(BTC)2 (curve b), and Sa-TN50/Cu3(BTC)2 (curve c), exhibited the same characteristic diffraction peaks as the pristine MOF, indicating that these composites featured the typical Cu organic framework and, secondly, that the embedment of the Cu-MOF with the organoclay did not modify the well-known structure of Cu-MOF. In addition, the organoclay composites exhibited sharp peaks similar to those of the pristine MOF, indicating that the MOF within the composites was crystalline. However, the intensities of these peaks for the composite became weaker as the organoclay content increased, revealing that high content of the organoclay in the starting mixture containing MOF precursors had an impact on the formation of the Cu-MOF crystals, and thus a less ordered crystalline structure was formed in the hybrid material. These observations also indicate that loading of an appropriate amount of organoclay is required to maintain the crystallinity as well as the octahedral shape of the MOF.
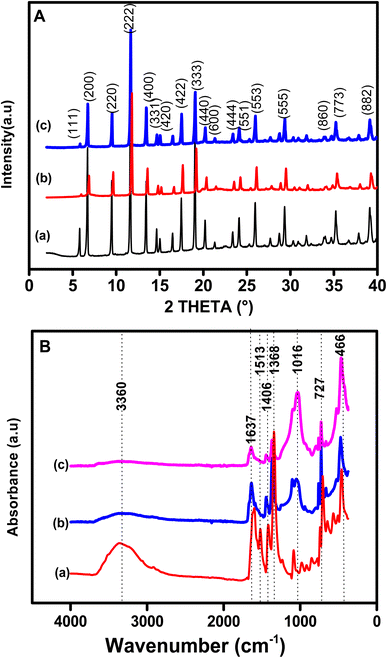 | ||
| Fig. 2 (A) XRD patterns and (B) FT-IR spectra of (a) Cu3(BTC)2, (b) Sa-TN5/Cu3(BTC)2 and (c) Sa-TN50/Cu3(BTC)2. | ||
The FTIR spectrum of pristine Cu-MOF (curve a) and those of various composites are shown in Fig. 2B (curve b for Sa-TN10/Cu3(BTC)2 and curve c for Sa-TN50/Cu3(BTC)2). For spectrum (a), the characteristic vibration bands of Cu-BTC can be observed, namely, at 1642 and 1513 cm−1, corresponding to the asymmetric stretching modes (1642 cm−1 is the aromatic C![[double bond, length as m-dash]](https://www.rsc.org/images/entities/char_e001.gif) C and 1513 cm−1 from C
C and 1513 cm−1 from C![[double bond, length as m-dash]](https://www.rsc.org/images/entities/char_e001.gif) O of H3BTC),48 and at 1406 cm−1 and 1368 cm−1 arising from symmetric stretching modes (1406 cm−1 due to C
O of H3BTC),48 and at 1406 cm−1 and 1368 cm−1 arising from symmetric stretching modes (1406 cm−1 due to C![[double bond, length as m-dash]](https://www.rsc.org/images/entities/char_e001.gif) O and 1368 cm−1 from C–O of H3BTC).48 The band at 1060 cm−1 can be assigned to the C–H vibration of the aromatic ring. In addition the vibration at 725 cm−1 is likely a Cu–O stretching vibration due to the coordination of the oxygen atom to Cu2+. The bands at 630 cm−1, 550 cm−1 and 460 cm−1 can be related to CuO and Cu2O. The characteristic bands of the Cu-MOF are generally present in the spectra of the various composites as shown in Fig. 2B (spectra b and c). Moreover, comparison of the FTIR spectrum of the composites shows that there is a good agreement in terms of position and intensity of the characteristic bands of Cu-MOF. These findings are consistent with the fact that the introduction of appropriate amounts of organoclay did not interfere with the structure of the Cu-MOF. The only significant difference between the spectrum of the composites and that of the pristine MOF is the broad band for curve a at 3000–3800 cm−1, ascribed to stretching of hydrogen-bonded O–H group and the intense band at 1500 cm−1 attributed to Si–O–Si. The EDS analysis of the Sa-TN10/Cu3(BTC)2 composite confirmed the presence Si and Al together with C, O and interestingly Cu, thus demonstrating that the composite was likely made of clay interconnected to the Cu-MOF (Fig. S2†). The average crystallite sizes of the pristine MOF and the composites were calculated using the Scherrer equation:
O and 1368 cm−1 from C–O of H3BTC).48 The band at 1060 cm−1 can be assigned to the C–H vibration of the aromatic ring. In addition the vibration at 725 cm−1 is likely a Cu–O stretching vibration due to the coordination of the oxygen atom to Cu2+. The bands at 630 cm−1, 550 cm−1 and 460 cm−1 can be related to CuO and Cu2O. The characteristic bands of the Cu-MOF are generally present in the spectra of the various composites as shown in Fig. 2B (spectra b and c). Moreover, comparison of the FTIR spectrum of the composites shows that there is a good agreement in terms of position and intensity of the characteristic bands of Cu-MOF. These findings are consistent with the fact that the introduction of appropriate amounts of organoclay did not interfere with the structure of the Cu-MOF. The only significant difference between the spectrum of the composites and that of the pristine MOF is the broad band for curve a at 3000–3800 cm−1, ascribed to stretching of hydrogen-bonded O–H group and the intense band at 1500 cm−1 attributed to Si–O–Si. The EDS analysis of the Sa-TN10/Cu3(BTC)2 composite confirmed the presence Si and Al together with C, O and interestingly Cu, thus demonstrating that the composite was likely made of clay interconnected to the Cu-MOF (Fig. S2†). The average crystallite sizes of the pristine MOF and the composites were calculated using the Scherrer equation:
 | (2) |
The SEM images of the Cu-BTC MOF, clay and Sa-TN/Cu3(BTC)2 composites are shown in Fig. 3. In the SEM images of the pristine MOF (Fig. 3A), it can clearly be seen that Cu3(BTC)2 particles are well-formed with a truncated octahedral geometry, which is in agreement with their XRD patterns. Their average edge to edge length was estimated to be between 10–12 μm. The image of organoclay (Fig. 3B) depicts a compiled platy morphology characteristic of smectite clay minerals. The SEM image of composites Sa-TN10/Cu-BTC (Fig. 3C) and Sa-TN50/Cu-BTC (Fig. 3D) shows the clay sheets and the typical truncated octahedral structure of Cu-MOF, the crystal being covered by organoclay leading to a rough surface as observed in Fig. 3C and D. The presence of the organoclay on the surface of the MOF acts to prevent the aggregation between crystals and favor the formation of a stable film at the electrode substrate.
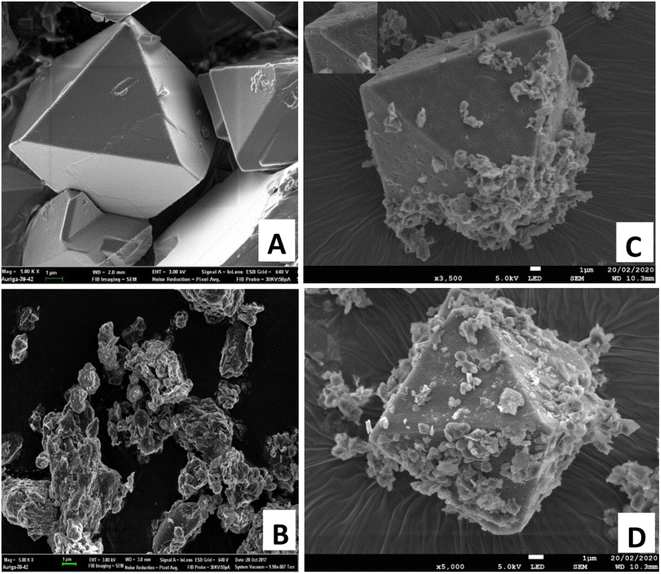 | ||
| Fig. 3 SEM images of pristine Cu3(BTC)2 (A), organoclay (B), Sa-TN25/Cu3(BTC)2 (C) and Sa-TN50/Cu3(BTC)2 (D). | ||
Fig. 4b shows the N2 adsorption–desorption isotherms of pristine Cu-MOF (plot a) and the composites (plot b for Sa-TN10/Cu3(BTC)2, plot c for Sa-TN50/Cu3(BTC)2 and the pristine clay (plot d). A type IV isotherm was obtained with the pristine MOF and Sa-TN10/Cu3(BTC)2, highlighting their microporosity, while that of clay was type IV with a H3 hysteresis loop attributed to the layer structure of the clay. Interestingly Sa-TN50/Cu3(BTC)2 composites exhibited type IV isotherm along with a small hysteresis loop at high relative pressure, which indicates the presence macro- and mesopores associated with the interparticle spaces50 in the composite. The surface area of the pristine Cu-MOF was 1408 m2 g−1, close to the value reported elsewhere in the literature for bulk Cu-MOF.51 The surface area of the composites was 569 m2 g−1 for Sa-TN10/Cu3(BTC)2, and 192 m2 g−1 for Sa-TN50/Cu3(BTC)2. The reduced surface area of the composites is likely due to the low porosity nature of organoclay (91 m2 g−1, curve d, Fig. 4) covering the MOF surface. The detail data of pore volume of the pristine MOF, pristine clay and clay MOF composites are presented in Table 1.
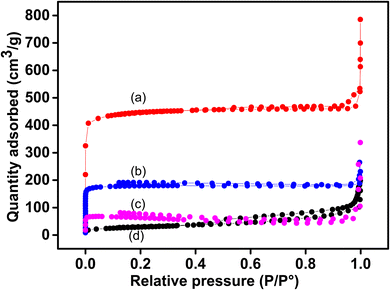 | ||
| Fig. 4 N2 isotherms of pristine Cu3(BTC)2 (a) and those of composites: Sa-TN10/Cu3(BTC)2 (b), Sa-TN50/Cu3(BTC)2 (c) and pristine clay (d). | ||
| Materials | BET surface area (m2 g−1) | Micropore volume (cm3 g−1) | Micropore size (nm) |
|---|---|---|---|
| Cu3 (BTC)2 | 1408 | 0.70 | 0.57 |
| Sa-TN10/Cu3(BTC)2 | 569 | 0.28 | 0.31 |
| Sa-TN50/Cu3(BTC)2 | 192 | 0.09 | 0.30 |
| Sa | 91 | 0.05 | 0.86 |
3.3 Electrochemical behavior of DXEP, AC and TYR on Sa-TN/Cu-BTC/GCE
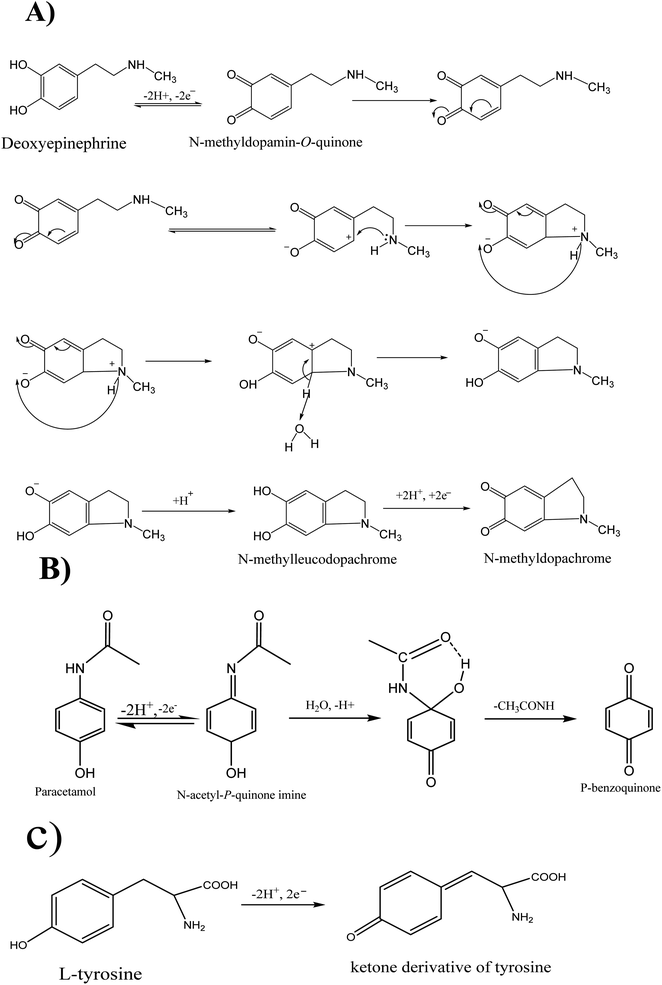
As reported in the literature, deoxyepinephrine (DXEP) and acetaminophen (AC) undergo multistep reactions corresponding to Electrochemical-Chemical-Electrochemical (ECE) (Scheme 1A) and Electrochemical-Chemical (EC) (Scheme 1B) mechanisms. As catecholamine, DXEP in aqueous media undergoes a first two-electron oxidation process leading to a catecholamine o-quinone, which can then result in a cyclisation and yield leucoaminochrome. Leucoaminochrome is easily oxidisable by exchanging two electrons to form aminochrome.8 In the EC mechanism of AC, its two-electron oxidation leads to N-acetyl-p-benzoquinone imine and after chemical reaction it is transformed to p-benzoquinone.Cyclic voltammetry (CV) was employed to investigate the electrochemical behavior of the three analytes individually in acetate buffer (AcB) pH 5 at bare GCE, pristine clay film electrode (Sa-GCE) and composite modified electrode (Sa-TN/Cu3(BTC)2/GCE). Fig. 5 shows CVs recorded at 50 mV s−1 in AcB containing either 138 μM DXEP (Fig. 5A) or 154 μM AC (Fig. 5B) at bare GCE (curve a), Sa/GCE (curve b) and Sa-TN50/Cu3(BTC)2/GCE (curve c). As shown in Fig. 5A, when the electrolyte solution contained the catecholamine and the potential scan was run in the positive direction, a well-defined peak appeared. However, in the reverse potential scan, no peak appeared within the potential range examined. This reveals that the electrochemical process is irreversible. This behavior can be rationalized by the fact that the dopamichrome can undergo polymerisation reaction on GCE electrode surface leading to the fouling of the electrode. Interestingly, contrary to CV recorded at bare electrode, those recorded in the same conditions at Sa/GCE and Sa-TN50/Cu3(BTC)2/GCE exhibited a pair of redox peak centered at E1/2 = +0.26 V and E1/2 = +0.17 V, respectively, besides the peak current ratio Ipa/Ipc was different from unity, corroborating the quasi-reversible nature of the electrochemical reaction of DXEP at the modified electrodes. These results show complementarity between the clay and MOF. Indeed, the quasi-reversible process observed at the modified electrode may be due to the fact that at pH 5 the DXEP and its electrooxidation products are positively charged, favoring the electrostatic attraction between the negatively charged clay sheet and these products. Moreover, the intracyclization of the protonated product of the oxidation of DXEP cannot take place under acidic condition, but the amine group was being transformed to ammonium, thus resulting in less electrode fouling. In addition, the amino or hydroxy group of the three analytes can undergo van der Waals/electrostatic interactions with silanol groups on the clay surface, favoring their diffusion through the film at the electrode surface. Although the CVs recorded at modified electrode exhibited a quasi-reversible process, the current ratio, Ipc/Ipa, was ca 0.6 for Sa-TN50/Cu3(BTC)2/GCE and ca 0.2 for Sa/GCE. The anodic and cathodic potential separation at CV recorded at Sa/GCE was found to be 0.61 V, three times higher than that obtained at Sa-TN50/Cu3(BTC)2/GCE. The increase in reversibility associated to the negative shift of the oxidation potential and the positive shift in reduction potential of DXEP in addition to peaks current increase, suggests that the MOF within the film onto the electrode surface likely catalyzed the oxidation of DXEP. This may have occurred through the intermediary of an adduct formed between the oxidized product of DXEP and the MOF.
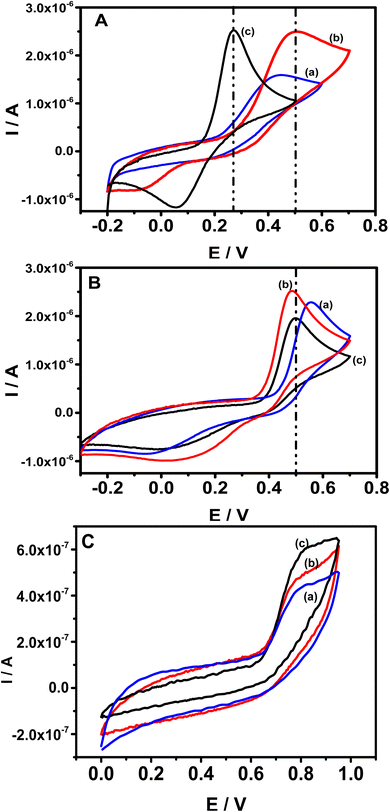 | ||
| Fig. 5 CVs recorded at bare GCE (a), Sa (b) and SaTN50/Cu3(BTC)2/GCE (c) in 0.1 M AcB (pH 5.0) containing either: (A) 138.0 μM of DXEP, (B) 154.0 μM of AC or (C) 44.2 μM of TYR. Scan rate 50 mV s−1. | ||
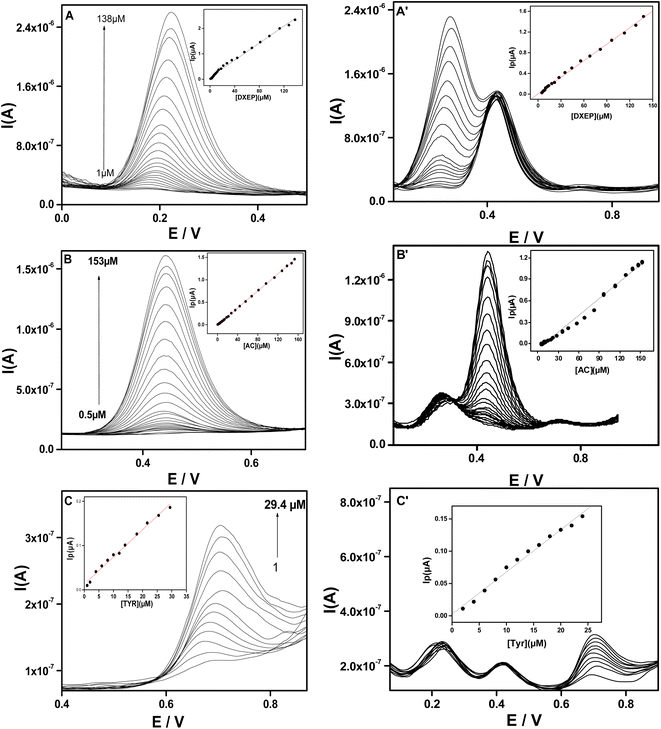
When the electrolyte solution contained AC, although CVs recorded at bare GCE exhibited an anodic and a cathodic peak (see Fig. 5B), the anodic peak was positively shifted whereas the cathodic peak was negatively shifted compared with the corresponding CVs recorded at modified electrode, with a larger peak to peak separation ΔE estimated to be 0.54 V and Ipc/Ipa ≈ 0.2. This ΔE value is 10 mV higher than that obtained at Sa/GCE, which exhibited a current ratio of ca. 0.45, suggesting that as for DXEP, the presence of clay film onto the electrode surface favored the redox reaction of positively charged AC. Interestingly, although the redox potentials recorded at Sa-TN50/Cu3(BTC)2/GCE are aligned with those of Sa/GCE, the electrochemical response of the AC oxidation at Sa-TN50/Cu3(BTC)2/GCE was slightly lower than that recorded at Sa/GCE. These observations suggest that Cu-MOF does not have catalytic effect on the oxidation of AC contrary to what was observed with DXEP. It is worthy to note that the oxidation peak potential corresponding to the oxidation of AC at Sa/GCE appeared nearly at the same potential as the oxidation of DXEP, resulting in an overlap of their voltammetry response, as for bare glassy carbon, while at Sa-TN50/Cu3(BTC)2/GCE these corresponding peak potentials are well separated.
In the presence of TYR as shown in Fig. 5C, when the potential was scanned in the positive direction, an oxidation peak appeared at +0.78 V at TN50/Cu3(BTC)2/GCE (curve c), and +0.81 V at Sa–Sa/GCE (curve b) and GCE (curve a). Meanwhile in the reverse potential scan, as expected no peak was observed, indicating that at modified and unmodified electrodes, the electrochemical process of TYR is an irreversible process. The enhancement of the current at modified electrodes is likely due to the fact that this analyte, as do DXEP and AC, can diffuse through the negatively charged film onto the electrode surface through van der Waals/electrostatic interactions with silanol group on the clay surface.
Fig. 6 compares the differential pulse voltammograms (DPV) recorded at bare GCE and composite electrodes (Sa-TN50/Cu3(BTC)2/GCE) in AcB (pH 5) containing the mixture of DXEP, AC and TYR. As expected from the CV results of Fig. 5, the voltammogram recorded at the composite modified electrode shows three well-defined oxidation peaks at +0.20 V, +0.42 V and +0.72 V, attributed, respectively, to the electro-oxidation of DXEP, AC and TYR. At the bare GCE, two well resolved peaks appear at +0.48 V and 0.74 V attributable to the electro-oxidation of AC and TYR, respectively, the first peak being overlapped by dome due to the oxidation of DXEP. This result is consistent with the CV response, confirming that the electrochemical response of AC at bare GCE interfered with that of DXEP as reported in the literature.52–54 The peak-to-peak separations at Sa-TN50/Cu3(BTC)2/GCE were found to be ΔEDXEP-AC = 22 mV and ΔEDXEP-TYR = 27 mV. Thus at modified electrode the simultaneous detection of the three analytes is feasible.
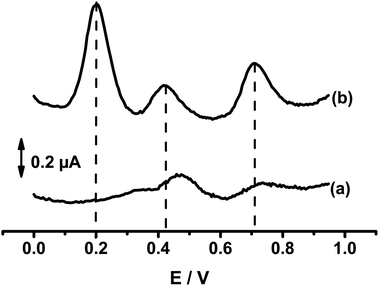 | ||
| Fig. 6 DPVs recorded at bare GCE (a) and SaTN50/Cu3(BTC)2/GCE (b) in 0.1 M AcB (pH 5) containing 19.8 μM of DXEP, 23.8 μM of AC and 44.2 μM of TYR. | ||
The electrochemical response of glassy carbon modified with different composites, namely, (Sa-TN5/Cu3(BTC)2, 5% for Sa-TN10/Cu3(BTC)2, 25% for Sa-TN25/Cu3(BTC)2 and 50% for Sa-TN50/Cu3(BTC)2) modified GCE were examined under the same conditions of pH and electrolyte solution containing 19.8 μM of DXEP, 23.8 μM AC and 44.2 μM TYR. It was found (Fig. S3†) that at the composite modified electrode Sa-TN50/Cu3(BTC)2, three well-defined oxidation peaks appeared on sweep voltammograms corresponding to the oxidation of DXEP, AC and TRR, while at the other composite film electrodes, only the oxidation peak of DXEP and AC were observed. In addition, the Sa-TN50/Cu3(BTC)2 modified electrode demonstrated better sensitivity associated with a negatively shifted potential mainly for DXEP and AC, in comparison with electrochemical response recorded at Sa-TN5/Cu3(BTC)2, Sa-TN10/Cu3(BTC)2 and Sa-TN25/Cu3(BTC)2. These results also demonstrate the synergistic effect of the MOF and organoclay, which can be explained by the good crystallinity of Cu3(BTC)2 within the composite film at Sa-TN50/Cu3(BTC)2 and its stability, with the organoclay forming an interconnected network which may favor charge transfer as well as the stability of the film at the electrode surface. For these reasons, Sa-TN50/Cu3(BTC)2 modified glassy carbon electrodes were further explored as sensors.
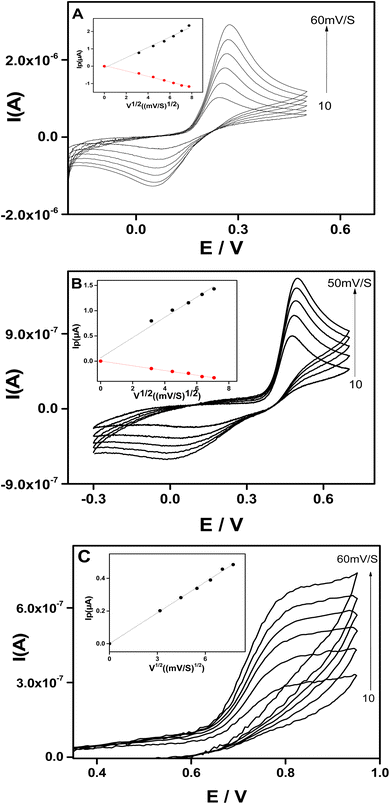
To investigate the electrochemical reaction kinetics at Sa-TN50/Cu3(BTC)2/GCE, the effect of scan rate was studied (Fig. 7). For the three analytes, the electrochemical response increased with the scan rate and the oxidation peak potentials were positively shifted while the reduction peak potentials were negatively shifted. Although the redox peak potential shifted with the increase of the scan rate, their potential difference remained nearly constant (≈200 mV for DXEP (Fig. 7A) and 400 mV for AC (Fig. 7B)). The insets of Fig. 7 show that for all analytes, the plot of current peak versus the square root of the scan rate (v1/2) resulted in a straight line. This linearity suggests that the electrochemical reaction of the three analytes at Sa-TN50/Cu3(BTC)2/GCE is an apparent diffusion controlled process. The plot of log of the oxidation current versus log of scan rate was also obtained and were found to be linear with the slope of 0.6 (R2 = 0.996), 0.4 (R2 = 0.995) and 0.5 (R2 = 0.996) for DXEP, AC and TYR, respectively. These values are not far from 0.5, which confirms that the electro-oxidation of these analytes at Sa-TN/Cu3(BTC)2/GCE is predominantly controlled by an apparent diffusion10 and that the electrode was not fouled by these analytes and/or the product of the reaction.
3.4 Optimization of the experimental parameters
The estimation of the optimal experimental parameters were achieved using Sa-TN50/Cu3(BTC)2/GCE.3.4.2 Effect of the pH of the electrolytic solution
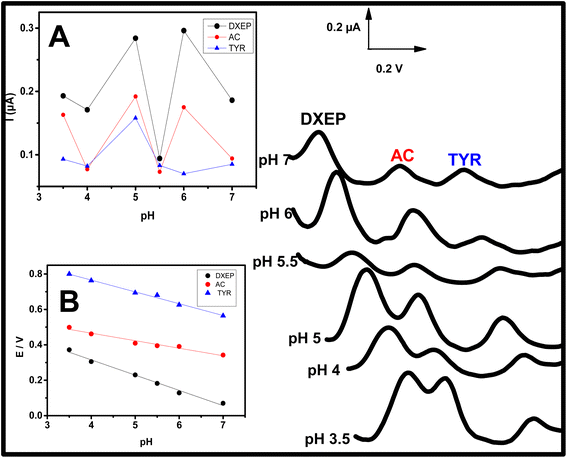
The oxidation peak potentials as well as the electrochemical responses of DXEP (pKa = 9.27 & 10.29), AC (pKa = 9.5) and TYR (pKa = 9.76) at Sa-TN50/Cu3(BTC)2/GCE were found to vary with the pH of the buffer solution, indicating that the electrochemical behavior of these analytes was affected by the acidity of the electrolyte solution. This behavior was examined in buffer solution with pH ranging from 3.5 to 7.0 and containing simultaneously 18.0 μM DXEP, 14.0 μM AC and 24.0 μM Tyr. As can be observed in Fig. 8 and inset A, in the pH range from 3.0 to 7.0, the peak current was also found to augment from 3.0 to 5.0 then diminish before increasing again reaching the maximum current at pH 6 and then leveling off. Although the current was greater at pH 6 for DXEP and AC, the oxidation peak current as a result of TYR oxidation was very low. Thus, pH = 5.0 acetate buffer (shortened as AcB) where the electrochemical response vis-a-vis the three analytes were maximum, was chosen for further experiments. Interestingly, it was noted that for the three analytes, the oxidation peak potentials were negatively shifted as the electrolyte solution pH increased (Fig. 8A), revealing that protons were involved in the electrochemical reaction.35 The inset B of the Fig. 8 shows that the oxidation peak potential and the electrolyte pH are linearly dependent with slope value of 79.1 (R2 = 0.992) for DXEP, 42.98 (R2 = 0.912) for AC and 61.5 (R2 = 0.966) for TYR. All these values are close to the theoretical Nernstian value of 59.0 mV at 25 °C, suggesting that protons are involved in the electrochemical reaction process at the modified electrode as indicated in the following mechanisms in Scheme 1.3.5 Determination of DXEP, AC and TYR at Sa-TN50/Cu3(BTC)2/GCE
Under the optimal conditions the individual and simultaneous determination of DXEP, AC and TYR were investigated at Sa-TN50/Cu3(BTC)2/GCE using DPV.| Modified electrodes | Analytes | Linear range (μM) | Detection limit (μM) | Reference |
|---|---|---|---|---|
| a AuNP: gold nanoparticle, HNRs: hybrid nanorods; CPE: carbon paste electrode; HMIPF6: n-hexyl-3-methylimidazolium hexafluorophosphate H3MBr: 1-hexyl 1-3 methylimidazolium bromide; ZIF zeolitic imiazole framework; Val: valine; MWMOF: microwave organic framework; DPID: 2-(3,4-dihydroxyphenethyl) isoindoline-1,3-dione; H3MTFB: 1-hexyl 3-methylimidazolium tetrafluoroborate; L-Asp: L-aspartic acid, ZX: zeolite X; ZA: zeolite A; SPE: screen printed electrode. | ||||
| CuFe2O4/1H3MBr/PE | DXEP | 0.3–300 | 0.09 | 58 |
| (CPE/CuO-NPs/HMIPF6 | 0.7–900 | 0.2 | 59 | |
| ZA/CPE | 0.5–70 | 0.2 | 60 | |
| ZX/CPE | 0.5–70 | 0.08 | 60 | |
| Sa-TN50/Cu-BTC/GCE | 1–138 | 0.4 | This work | |
| AuNPs/poly(trisamine)/GCE | AC | 1.9–188 | 0.1 | 61 |
| NiO/CNTs/DPID/CPE | 0.8–550 | 0.3 | 62 | |
| CoTPyPRu(bipy)2–Ba/GCE | 1–50 | 0.2 | 63 | |
| Au@Pd HNRs/BG/GCE | 130–1010 | 6.35 | 64 | |
| poly-L-Asp/GPE | 0.05–108.25 | 0.011 | 65 | |
| poly(Val)/CPE | 5– 60 | 0.29 | 66 | |
| AuNPs/MWCNT/GCE | 0.09–35.0 | 0.03 | 67 | |
| TCPP–Sa/CPE | 1 – 90 | 0.2 | 68 | |
| HKUST-1/GCE | 12.5–75 | 0.11 | 69 | |
| MWMOF-199/GCE | 0.1–5 | 1.3 | 70 | |
| ZA/CPE | 0.5–70 | 0.3 | 60 | |
| ZX/CPE | 0.5–70 | 0.2 | 60 | |
| Sa-TN50/Cu-BTC/GCE | 4–154.3 | 0.7 | This work | |
| AuNPs/poly(trisamine)/GCE | TYR | 3.9–61.8 | 0.9 | 61 |
| NiO/CNTs/DPID/CPE | 5.0–750.0 | 1 | 62 | |
| CoTPyPRu(bipy)2–Ba/GCE | 1–25 | 0.5 | 63 | |
| Au@Pd HNRs/BG/GCE | 30.00–360.00 | 3.71 | 64 | |
| poly-L-Asp/GPE | 0.1–93.9 | 0.31 | 65 | |
| AuNPs/MWCNT/GCE | 0.4–80 | 0.21 | 67 | |
| TCPP–Sa/CPE | 3–51 | 0.7 | 68 | |
| Sa-TN50/Cu-BTC/GCE | 1–21.6 | 0.2 | This work | |
3.6 Interference study
The influence of inorganic (Ca2+, Mg2+, Zn2+ and Cu2+) and organic (dopamine, uric acid, ascorbic acid and tryptophan) interferences on the determination of DXEP, AC and TYR was evaluated by adding various species to the analyte mixture (5.0 μM DXEP + 5.0 μM AC + 5.0 μM TYR) in 0.1 AcB pH 5.0. In the presence of inorganic species, the electrochemical response toward DXEP, AC and TYR was not affected. When dopamine, ascorbic acid, uric acid or tryptophan were added at concentration lower than 2.0 μM in the electrolyte solution containing the three analytes, the response of the sensor toward these analytes was unaffected. However, for greater concentrations (i.e. >2 μM), the electrochemical response of DXEP was significantly affected by dopamine and that of AC was also affected by uric acid while the tryptophan interfered with the quantification of TYR.3.7 Real sample analysis
Sa-TN/Cu-BTC/GCE was applied to estimate the AC content in a commercial tablet of Paracetamol 1000 mg (i.e. 1000 mg of AC/tablet) using the standard addition method. The tablet was finely ground in a mortar and the powder was then dissolved in water. The aqueous solution was centrifuged and 0.5 mL of the supernatant was transferred into an electrochemical cell containing 24.5 mL of AcB (pH 5) and DPV response was recorded (dashed line in Fig. S5†). Five successive additions of AC standard were then employed and the electrochemical response recorded each time (solid line in Fig. S5†). From the regression equation shown in the inset (Fig. S5†), the estimated amount of acetaminophen in the tablet was 96.75% of the theoretical amount AC of the paracetamol tablet. This result shows that the developed sensors can be used efficiently for AC quantification in real samples. The amount of the three targeted analytes in tap water was also determined using the same method. Experimentally, in order to perform real sample analysis of tap water, a known amount of DXEP, AC and TYR was spiked into the tap water. The sample was then added to the electrolytic solution so that the total volume of electrochemical cell was 10.0 mL. The DPVs were then recorded at the developed sensors. Five successive standards of the analytes were added to the solution and the DPVs recorded. The amount of each spiked sample obtained and recovery values are presented in Table S2.† For the three analytes the recovery value ranged from 90% to 102%, demonstrating the applicability of the developed sensors in real milieu.3.8 Stability, repeatability and reproducibility of Sa-TN50/Cu3(BTC)2/GCE
The results displayed in Fig. 9 show that the oxidation peak potentials obtained for simultaneous or individual detection of DXEP, AC and TYR are well correlated and show similar sensitivity. This confirms the good operational stability of the modified electrode toward the oxidation of the three analytes. Since the electrode preparation is easy and rapid, it does not need to be stable for a long time. A repeatability study based on successive measurements of the electrochemical response using Sa-TN50/Cu3(BTC)2/GCE prepared by drop coating of the composite suspension in the mixture of analytes in the electrolyte solution was carried out. The relative standard deviation (RSD) of seven successive measurements for the three analytes were estimated to be 1.5%, 1.2% and 1.4% for DXEP, AC and TYR, respectively, which indicate that Sa-TN/Cu3(BTC)2/GCE exhibited good repeatability and short term stability. The reproducibility of Sa-TN50/Cu3(BTC)2/GCE was studied using five independent modified electrodes prepared similarly and used in electrolytic solution containing a mixture of analytes. RSD was 3.4%, 4.1% and 3.7% for DXEP; AC and TYR, respectively; which confirmed good reproducibility.4. Conclusion
A copper MOF composite was prepared by growing the MOF crystals in a mixture containing MOF precursors and an organoclay. The organoclay was obtained by intercalating thionin dye into the interlayer of a natural Cameroonian clay. The characterization of the resulting blue crystal composite showed that it exhibited high surface area and appeared to be made of well-shaped hexagonal Cu-MOF crystals covered with clay. The composite film modified glassy carbon electrodes were fabricated by drop casting a suspension onto the electrode surface followed by drying at room temperature. The modified electrode demonstrated electrocatalytic activity vis-a-vis DXEP, thus allowing some selectivity of the modified electrode for the simultaneous determination of DXEP and AC, which was found to cause interference when using bare GCE. Thanks to the synergistic effect of organoclay and Cu-MOF at the surface of GCE, the composite modified glassy carbon electrode showed good selectivity and sensitivity for both the individual and simultaneous detection of DXEP, AC and TYR. The composite modified glassy carbon electrodes were successfully applied in the quantification of AC in a commercial tablet and the three analytes (DXEP, AC and TYR) in a tape water.Conflicts of interest
There are no conflicts to declare.Acknowledgements
Financial support from the Royal Society ACBI programme (Grant AQ150029) is gratefully acknowledged. HWL acknowledges the South African Research Chairs Initiative (SARChI) of the Department of Science and Innovation, and the National Research Foundation.References
- F. Carniato, G. Gatti and C. Bisio, New J. Chem., 2020, 44, 9969–9980 RSC.
- C.-W. Chiu, T.-K. Huang, Y.-C. Wang, B. G. Alamani and J.-J. Lin, Prog. Polym. Sci., 2014, 39, 443–485 CrossRef CAS.
- M. K. Uddin, Chem. Eng. J., 2017, 308, 438–462 CrossRef CAS.
- A. Czımerová, J. Bujdák and A. Gáplovský, Colloids Surf., A, 2004, 243, 89–96 CrossRef.
- A. A. Adeyemo, I. O. Adeoye and O. S. Bello, Appl. Water Sci., 2017, 7, 543–568 CrossRef CAS.
- P. K. Ghosh and A. J. Bard, J. Phys. Chem., 1984, 88, 5519–5526 CrossRef CAS.
- R. Zhu, Q. Zhou, J. Zhu, Y. Xi and H. He, Clays Clay Miner., 2015, 63, 199–221 CrossRef CAS.
- M. Janek and G. Lagaly, Colloid Polym. Sci., 2003, 281, 293–301 CrossRef CAS.
- J. Kemmegne Mbouguen, E. Ngameni and A. Walcarius, Anal. Chim. Acta, 2006, 578, 145–155 CrossRef CAS PubMed.
- J. K. Mbouguen, E. Ngameni and A. Walcarius, Biosens. Bioelectron., 2007, 23, 269–275 CrossRef CAS PubMed.
- M. C. N. Ngwem, J. C. Kemmegne-Mbouguen, H. W. Langmi, N. M. Musyoka and R. Mokaya, ChemistrySelect, 2022, 7, e202202308 CrossRef CAS.
- J. C. K. Mbouguen, I. T. Kenfack, A. Walcarius and E. Ngameni, Talanta, 2011, 85, 754–762 CrossRef CAS.
- J. C. Kemmegne-Mbouguen, L. Angnes, E. Mouafo-Tchinda and E. Ngameni, Electroanalysis, 2015, 27, 2387–2398 CrossRef CAS.
- J. C. Kemmegne-Mbouguen and L. Angnes, Sens. Actuators, B, 2015, 212, 464–471 CrossRef CAS.
- J. C. Kemmegne-Mbouguen, F. P. Tchoumi, E. Mouafo-Tchinda, H. W. Langmi, S. E. Bambalaza, N. M. Musyoka, C. Kowenje and R. Mokaya, New J. Chem., 2020, 44, 13108–13117 RSC.
- A. D. Pournara, G. D. Tarlas, G. S. Papaefstathiou and M. J. Manos, Inorg. Chem. Front., 2019, 6, 3440–3455 RSC.
- K. Kamal, M. A. Bustam, M. Ismail, D. Grekov, A. Mohd Shariff and P. Pré, Materials, 2020, 13, 2741–2750 CrossRef CAS PubMed.
- Y.-R. Lee, J. Kim and W.-S. Ahn, Korean J. Chem. Eng., 2013, 30, 1667–1680 CrossRef CAS.
- A. Doménech, H. García, M. T. Doménech-Carbó and F. Llabrés-i-Xamena, J. Phys. Chem. C, 2007, 111, 13701–13711 CrossRef.
- J. Albo, D. Vallejo, G. Beobide, O. Castillo, P. Castaño and A. Irabien, ChemSusChem, 2017, 10, 1100–1109 CrossRef CAS.
- J. M. Gonçalves, P. R. Martins, D. P. Rocha, T. A. Matias, M. S. S. Julião, R. A. A. Munoz and L. Angnes, J. Mater. Chem. C, 2021, 9, 8718–8745 RSC.
- T. Ma, H. Li, J.-G. Ma and P. Cheng, Dalton Trans., 2020, 49, 17121–17129 RSC.
- W. Zhang, G. Jia, Z. Li, C. Yuan, Y. Bai and D. Fu, Adv. Mater. Interfaces, 2017, 4, 1601241 CrossRef.
- X. Wang, Q. Wang, Q. Wang, F. Gao, F. Gao, Y. Yang and H. Guo, ACS Appl. Mater. Interfaces, 2014, 6, 11573–11580 CrossRef CAS.
- B. Peng, J. Cui, Y. Wang, J. Liu, H. Zheng, L. Jin, X. Zhang, Y. Zhang and Y. Wu, Nanoscale, 2018, 10, 1939–1945 RSC.
- D. M. Fernandes, A. D. S. Barbosa, J. Pires, S. S. Balula, L. Cunha-Silva and C. Freire, ACS Appl. Mater. Interfaces, 2013, 5, 13382–13390 CrossRef CAS PubMed.
- M. Shabani-Nooshabadi, H. Karimi-Maleh and F. Tahernejad-Javazmi, J. Electrochem. Soc., 2019, 166, H218 CrossRef CAS.
- F. Boomsma, G. Alberts, F. A. J. van der Hoorn, A. J. Man in 't Veld and M. A. D. H. Schalekamp, J. Chromatogr. B: Biomed. Sci. Appl., 1992, 574, 109–117 CrossRef CAS PubMed.
- F. Patel, Med., Sci. Law, 1992, 32, 303–310 CrossRef CAS PubMed.
- M. M. Rahman, N. S. Lopa, K. Kim and J.-J. Lee, J. Electroanal. Chem., 2015, 754, 87–93 CrossRef CAS.
- S. Wilson, D. Kamin and J. Feldman, Clin. Chem., 1985, 31, 1093–1094 CrossRef CAS.
- H. Y. Wang, Y. Sun and B. Tang, Talanta, 2002, 57, 899–907 CrossRef CAS PubMed.
- W. Lohmann and U. Karst, Anal. Bioanal. Chem., 2006, 386, 1701–1708 CrossRef CAS PubMed.
- J. M. Wilson, J. T. Slattery, A. J. Forte and S. D. Nelson, J. Chromatogr. B: Biomed. Sci. Appl., 1982, 227, 453–462 CrossRef CAS PubMed.
- B. Habibi, M. Jahanbakhshi and M. H. Pournaghi-Azar, Electrochim. Acta, 2011, 56, 2888–2894 CrossRef CAS.
- N. F. Atta and M. F. El-Kady, Talanta, 2009, 79, 639–647 CrossRef CAS PubMed.
- J. Huang, Y. Liu, H. Hou and T. You, Biosens. Bioelectron., 2008, 24, 632–637 CrossRef CAS PubMed.
- J. C. Kemmegne-Mbouguen, I. T. Kenfack, A. Walcarius and E. Ngameni, Talanta, 2011, 85, 754–762 CrossRef PubMed.
- I. K. Tonle, E. Ngameni, D. Njopwouo, C. Carteret and A. Walcarius, Phys. Chem. Chem. Phys., 2003, 5, 4951–4961 RSC.
- B. Narayana, M. Mathew, K. Vipin, N. V. Sreekumar and T. Cherian, J. Anal. Chem., 2005, 60, 706–709 CrossRef CAS.
- Y. Zhang, X. Bo, C. Luhana, H. Wang, M. Li and L. Guo, Chem. Commun., 2013, 49, 6885–6887 RSC.
- J. Kim, S.-H. Kim, S.-T. Yang and W.-S. Ahn, Microporous Mesoporous Mater., 2012, 161, 48–55 CrossRef CAS.
- X. Mu, Y. Chen, E. Lester and T. Wu, Microporous Mesoporous Mater., 2018, 270, 249–257 CrossRef CAS.
- C.-M. Dai, J. Zhang, Y.-L. Zhang, X.-F. Zhou, Y.-P. Duan and S.-G. Liu, Chem. Eng. J., 2012, 211–212, 302–309 CrossRef CAS.
- V. E. Nicotra, M. F. Mora, R. A. Iglesias and A. M. Baruzzi, Dyes Pigm., 2008, 76, 315–318 CrossRef CAS.
- R. Senthil Kumar, S. Senthil Kumar and M. Anbu Kulandainathan, Electrochem. Commun., 2012, 25, 70–73 CrossRef CAS.
- M. Hartmann, S. Kunz, D. Himsl, O. Tangermann, S. Ernst and A. Wagener, Langmuir, 2008, 24, 8634–8642 CrossRef CAS PubMed.
- L. D. O'Neill, H. Zhang and D. Bradshaw, J. Mater. Chem., 2010, 20, 5720–5726 RSC.
- F. A. Sofi, M. A. Bhat and K. Majid, New J. Chem., 2019, 43, 3119–3127 RSC.
- J. de Haro, A. Benítez, Á. Caballero and J. Morales, Eur. J. Inorg. Chem., 2021, 2021, 177–185 CrossRef CAS.
- M. Perfecto-Irigaray, J. Albo, G. Beobide, O. Castillo, A. Irabien and S. Pérez-Yáñez, RSC Adv., 2018, 8, 21092–21099 RSC.
- M. Yadav, P. Singh, V. Ganesan, R. Gupta, P. K. Sonkar and D. K. Yadav, Electroanalysis, 2020, 32, 248–257 CrossRef CAS.
- X. Kang, Y. Song, J. Zhao and Y. Li, J. Electroanal. Chem., 2021, 895, 115482 CrossRef CAS.
- A. R. Rajamani and S. C. Peter, ACS Appl. Nano Mater., 2018, 1, 5148–5157 CrossRef CAS.
- U. E. Majewska, K. Chmurski, K. Biesiada, A. R. Olszyna and R. Bilewicz, Electroanalysis, 2006, 18, 1463–1470 CrossRef CAS.
- A. K. Vidyadharan, D. Jayan and T. Mary Nancy, J. Solid State Electrochem., 2014, 18, 2513–2519 CrossRef CAS.
- J. Chen, Y. Chen, S. Li, J. Yang, J. Dong and X. Lu, Carbon, 2022, 199, 110–118 CrossRef CAS.
- M. Shabani-Nooshabadi, H. Karimi-Maleh and F. Tahernejad-Javazmi, J. Electrochem. Soc., 2019, 166, H218–H223 CrossRef CAS.
- H. Karimi-Maleh, M. Sheikhshoaie, I. Sheikhshoaie, M. Ranjbar, J. Alizadeh, N. W. Maxakato and A. Abbaspourrad, New J. Chem., 2019, 43, 2362–2367 RSC.
- J. C. Kemmegne-Mbouguen and F. P. Tchoumi, J. Solid State Electrochem., 2023, 27, 939–953, DOI:10.1007/s10008-022-05355-z.
- M. Taei and G. Ramazani, Colloids Surf., B, 2014, 123, 23–32 CrossRef CAS PubMed.
- H. Karimi-Maleh, M. R. Ganjali, P. Norouzi and A. Bananezhad, Mater. Sci. Eng. C, 2017, 73, 472–477 CrossRef CAS PubMed.
- J. C. Kemmegne-Mbouguen, H. E. Toma, K. Araki, V. R. L. Constantino, E. Ngameni and L. Angnes, Microchim. Acta, 2016, 183, 3243–3253 CrossRef CAS.
- X. Chen, G. Zhang, Y. He, L. Shi, J. Zhang, G. Yang, H. Pan, W. Liu and S. Feng, Int. J. Electrochem. Sci., 2020, 15, 5927–5944 CrossRef CAS.
- Y. Luo, Y. Zhang, L. Lu and H. Luo, J. Electroanal. Chem., 2020, 856, 113737 CrossRef CAS.
- T. V. Gopal, T. M. Reddy, G. Venkataprasad, P. Shaikshavalli and P. Gopal, Colloids Surf., A, 2018, 545, 117–126 CrossRef.
- T. Madrakian, E. Haghshenas and A. Afkhami, Sens. Actuators, B, 2014, 193, 451–460 CrossRef CAS.
- J. C. Kemmegne-Mbouguen and E. Ngameni, Anal. Methods, 2017, 9, 4157–4166 RSC.
- F. A. Sofi, M. A. Bhat and K. Majid, New J. Chem., 2019, 43, 3119–3127 RSC.
- T. T. Minh, N. H. Phong, H. Van Duc and D. Q. Khieu, J. Mater. Sci., 2018, 53, 2453–2471 CrossRef CAS.
Footnote |
| † Electronic supplementary information (ESI) available. See DOI: https://doi.org/10.1039/d3ra03850e |
| This journal is © The Royal Society of Chemistry 2023 |

