 Open Access Article
pH-Sensitive nanodiamond co-delivery of retinal and doxorubicin boosts breast cancer chemotherapy†
Jicheng Cui‡
a,
Bo Hu‡c,
Yuejun Fu d,
Zhengkun Xue and
Yingqi Li
 *ab
*ab
aKey Laboratory of Chemical Biology and Molecular Engineering of Ministry of Education, Institute of Molecular Science, Shanxi University, Taiyuan 030006, P. R. China. E-mail: wkyqli@sxu.edu.cn
bSchool of Chemistry and Chemical Engineering, Shanxi University, Taiyuan 030006, PR China
cChina Institute for Radiation Protection, Taiyuan 030006, P. R. China
dKey Laboratory of Chemical Biology and Molecular Engineering of Ministry of Education, Institute of Biotechnology, Shanxi University, Taiyuan 030006, China
eFaculty of Science, McMaster University, Hamilton, L8S 4K1, ON, Canada
First published on 13th September 2023
Abstract
Herein for the first time we take the advantage of nanodiamonds (NDs) to covalently immobilize all-trans retinal (NPA) by an imine bond, allowing pH-mediated drug release. DOX is then physically adsorbed onto NPA to form an NPA@D co-loaded double drug in the sodium citrate medium, which is also susceptible to pH-triggered DOX dissociation. The cytotoxicity results showed that NPA@D could markedly inhibit the growth of DOX-sensitive MCF-7 cells in a synergetic way compared to the NP@D system of single-loaded DOX, while NPA basically showed no cytotoxicity and weak inhibition of migration. In addition, NPA@D can overcome the drug resistance of MCF-7/ADR cells, indicating that this nanodrug could evade the pumping of DOX by drug-resistant cells, but free DOX is nearly ineffective against these cells. More importantly, the fluorescence imaging of tumor-bearing mice in vivo and ex vivo demonstrated that the NPA@D was mainly accumulated in the tumor site rather than any other organ by intraperitoneal injection after 24 h, in which the fluorescence intensity of NPA@D was 19 times that of the free DOX, suggesting that a far reduced off-target effect and side effects would be expected. Therefore, this work presents a new paradigm for improving chemotherapy and reversing drug resistance using the ND platform for co-delivery of DOX and ATR.
1. Introduction
Female breast cancer as the number one killer of women's health has become the number one cancer in the world. Doxorubicin (DOX) is a widely used clinical chemotherapeutic agent for breast cancer treatment.1 However, the low specificity of DOX for tumor cells, especially serious toxicity to heart and poor prognosis limit its application.2 Combination chemotherapy has attracted widespread attention as it can overcome drug resistance and maximize therapeutic effects by modulating different signaling pathways in cancer.3–5 Therefore, how to combine other chemotherapeutic agents with DOX to improve the chemotherapeutic effect and reduce side effects has attracted extensive interest of researchers.6To address this problem effectively, combining two drugs7–9 in one nanocarrier is a good choice. To date, a wide variety of nanomedicines (e.g., nanozymes,10 nanodots,11 nanospheres,12 gold nanostructures13 and carbon nanoparticles14) has attracted much attention from researchers. Among them, previous studies have demonstrated that nanodiamonds (NDs) have good biocompatibility and easy surface modification,15 which make them excellent candidates for drug delivery applications. For example, NDs can load various chemotherapeutic agents by physical adsorption and covalent linkage and reduce the leakage of chemotherapeutic agents.16–19 Besides, they can provide slow release of chemotherapeutic drugs and reverse the drug resistance of tumor cells.20,21 Recent research by Wang et al. has shown that NDs can be excreted in Naïve Beagle canine's urine, taking their research to a new level.22 All-trans retinal (ATR) is a precursor of all-trans retinoic acid and can be oxidized to all-trans retinoic acid (ATRA) in lysosomes.23 ATRA is a vitamin A derivative commonly used in the clinical treatment of acute promyelocytic leukemia (APL),24 and it is also a powerful differentiation agent, induces malignant cell differentiation, and acts as a cellular senescence agent to prevent and inhibit the growth of many cancerous malignancies.25,26 In addition, ATRA binds to specific cytoplasmic proteins, such as cytosolic retinoic acid binding protein II (CRABP-II) and fatty acid binding protein 5 (FABP5), forming ligand protein complexes, which are then transferred to the nucleus. The anticancer effects of ATRA are mainly derived from its ability to activate retinoic acid receptors (RARs and PPARβ/δ),27,28 thereby regulating multiple gene expression. However, the poor water solubility of ATRA hampers its extensive application. In recent years, many studies have shown that ATRA can synergistically enhance the cytotoxicity of chemotherapeutic agents. For instance, it has been shown to increase the sensitivity of cisplatin in vitro for squamous head and neck cancer and ovarian cancer cells and the combination of ATRA and chemotherapy agents also boosts efficacy.29 Karmakar et al. used a glioblastoma U87MG xenograft model to explore the efficacy of ATRA and paclitaxel combination. They found that the combination of ATRA and paclitaxel down regulated survival factors availably and has the ability to activate multiple mitochondria-dependent apoptotic pathways.30 Liu et al. developed a folic acid-modified chitosan-derived polymer (FA-CSOSA) as a carrier loaded with DOX and ATRA to prepare FA-CSOSA/DOX and FA-CSOSA/ATRA micelles, respectively. And the results showed that the combined treatment using both nanodrugs synergistically induced the apoptosis of 4T1 cells and reduced the expression of relevant proteins compared to free DOX alone. Besides, metastasis inhibition was also observed when the two nanodrugs are combined for treatment.26 Unfortunately, ATRA and other chemotherapy drugs were either co-loaded on the nanoparticles by physical adsorption, causing low drug availability at the tumor site, and the premature release of the drug causes toxic side effects, or they were not co-loaded on the same nanoparticles, resulting in cumbersome operations. In order to solve this problem, it is very necessary to construct a tumor microenvironment-responsive and dual-drug mode system on the same nanoplatform to improve their anticancer effects.
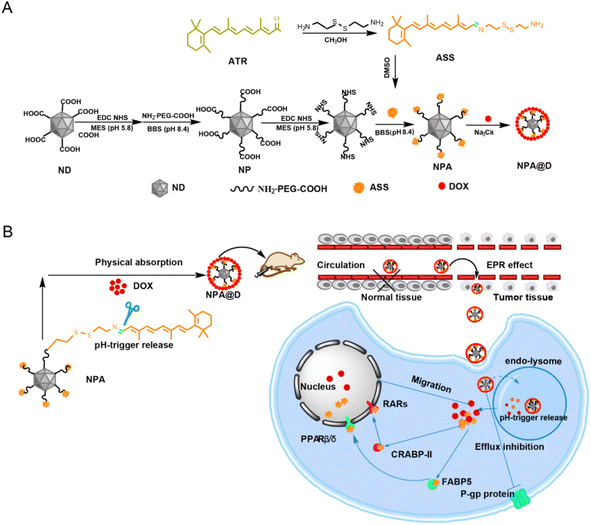
Herein we engineered a pH-responsive NPA@D nanodrug with synergistic efficacy, for enhancement of DOX cytotoxicity against breast tumor MCF-7 cells and MCF-7/ADR cells. As shown in Scheme 1A, all-trans retinal (ATR) as the precursor of all-trans retinoic acid is grafted onto cystamine through an imine bond to form cystamin-lated all-trans retinal (ASS), and then coupled with PEG-modified nanodiamonds (NDs) to generate ND-PEG-ASS (NPA) nanoparticles, which were further loaded with DOX to form dual-drug functionalized ND-PEG-ASS@DOX (NPA@D) nanoparticles. The cytotoxicity results showed that NPA@D could markedly inhibit the growth of DOX-sensitive MCF-7 cells in a synergetic way compared to the NP@D system with single-loaded DOX. In addition, NPA@D can overcome the drug resistance of MCF-7/ADR cells by bypassing P-gp proteins, thereby inhibiting their proliferation. More importantly, NPA@D nanoparticles can be effectively targeted to the tumor site through EPR effect (Scheme 1B). Hence the developed NPA@D demonstrated excellent pH-responsive modulation and could be a good candidate as an intelligent nanodrug for achieving enhanced therapeutic efficacy.
2. Experimental
2.1 Reagents
Nanodiamond (ND) powders (sizes ≈ 140 nm) were purchased from Element Six (Shanghai, China). Doxorubicin hydrochloride (DOX) was purchased from Pude Pharmaceutical Co., Ltd (Shanxi, China). All-trans retinal (ATR) was purchased from Biotechnology Co., Ltd (Shanghai, China). Cystamine dihydrochloride was purchased from Solarbio (Beijing, China). 1-Ethyl-3-(3-dimethylaminopropyl)carbodiimide (EDC) was purchased from Solarbio (Beijing, China). N-Hydroxysuccinimide (NHS) was purchased from Solarbio (Beijing, China). MES monohydrate was purchased from Solarbio (Beijing, China). Dulbecco Minimum Essential Medium (DMEM) and penicillin-streptomycin mixture and paraformaldehyde and trypisin-EDTA were purchased from Solarbio (Beijing, China). Fetal bovine serum (FBS) was purchased from Hangzhou Sijiqing Biological Engineering Materials Co., Ltd (Hangzhou, China). Cell counting kit-8 (CCK-8) and 4, 6-diamidino-2-phenylindole (DAPI) and Lyso-Tracker green were purchased from Solarbio (Beijing, China). HL-7702 (human liver epithelial cells) and MCF-7 cells (human breast cancer cell line) were kindly provided by the Institute of Molecular Science. MCF-7/ADR cells (DOX-resistant human breast cancer cell line) were purchased from Procell Life Science&Technology Co., Ltd (Wuhan, China). All other chemicals and solvents were of analytical grade and procured from local suppliers unless otherwise mentioned. Millipore filtered water was used for all aqueous solutions.2.2 Preparation of ASS
To synthesize the ATR–C![[double bond, length as m-dash]](https://www.rsc.org/images/entities/char_e001.gif) N–CH2–CH2–S–S–CH2–CH2–NH2 (ASS) conjugate, ATR (28.4 mg) in 2.0 mL of anhydrous methanol and cystamine dihydrochloride (H2N–CH2–CH2–S–S–CH2–CH2–NH2) (67.5 mg) in 3 mL of anhydrous methanol were mixed. The reaction was stirred for 24 h under a nitrogen atmosphere at a temperature of 40 °C. The ASS was obtained and the resulting solution was removed by rotary evaporation under reduced pressure, then DMSO was added to dissolve the product, and it was preserved at −20 °C for further experiments. The as-prepared ASS was verified using High Resolution Mass Spectrometry (HRMS) (Thermo Scientific Q Exactive LC-MS/MS instrument, China).
N–CH2–CH2–S–S–CH2–CH2–NH2 (ASS) conjugate, ATR (28.4 mg) in 2.0 mL of anhydrous methanol and cystamine dihydrochloride (H2N–CH2–CH2–S–S–CH2–CH2–NH2) (67.5 mg) in 3 mL of anhydrous methanol were mixed. The reaction was stirred for 24 h under a nitrogen atmosphere at a temperature of 40 °C. The ASS was obtained and the resulting solution was removed by rotary evaporation under reduced pressure, then DMSO was added to dissolve the product, and it was preserved at −20 °C for further experiments. The as-prepared ASS was verified using High Resolution Mass Spectrometry (HRMS) (Thermo Scientific Q Exactive LC-MS/MS instrument, China).
2.3 Preparation and characterization of NPA@D
First, the ND-PEG-COOH (NP) was synthesized following the reported method by us.31 Briefly, ultrasonically dispersed ND (10.0 mg) was in 10.0 mL of MES buffer solution (0.1 M, pH 5.8) and EDC (2.0 mg) and NHS (2.5 mg) were added into the above suspension, respectively. After reaction for 6 h at room temperature, the activated ND was dispersed in 10.0 mL of sodium borate buffer solution (BBS, 0.1 M, pH 8.4) rapidly, and H2N-PEG-COOH was added into the activated ND suspension under magnetic stirring. Finally, the product of NP was obtained. Then the carboxyl groups of the NP were activated by the method described above, and ASS was dropped slowly to react in BBS buffer solution. After 24 h, the product of ND-PEG-ASS (NPA) was centrifuged at 10![[thin space (1/6-em)]](https://www.rsc.org/images/entities/char_2009.gif) 000 rpm for 5 min and washed three times with anhydrous ethanol until the supernatant was colorless. The amount of all-trans ATR in NPA was determined by UV-vis spectroscopy.
000 rpm for 5 min and washed three times with anhydrous ethanol until the supernatant was colorless. The amount of all-trans ATR in NPA was determined by UV-vis spectroscopy.
Next, the NPA (8.0 mg) nanoparticles were dispersed in 8 mL of sodium citrate (Na3Cit, 1.0 M) medium and sonicated for 30 min, and then DOX was added under stirring to make it fully adsorbed on NPA nanoparticles according to a previously reported method,20 then centrifuged and washed with deionized water to remove any non-adsorbed DOX, yielding NPA@D, which was used for further experiments. Similarly, the NP@D was prepared as a control.
The hydrodynamic diameter, polydispersity index (PDI) and zeta potential of ND, NP, NPA, and NPA@D were investigated in deionized water using a Malvern Zetasizer (DLS, Malvern Nano S90, UK). Fourier transform infrared spectra of the samples were obtained using an FT-IR 8400s spectrometer (Shimadzu, Japan). The UV-vis spectra of ND, NP, ASS, DOX, ATR, NPA and NPA@D were monitored on a UH-5300 spectrophotometer (HITACHI, Japan). Their fluorescence emission spectra were recorded on an F-4700 fluorescence spectrophotometer (HITACHI, Japan). Raman spectra were collected on a Bruker Senterra dispersive Raman microscope. The fluorescence imaging of various materials was conducted using a fluorescence microscope (ZEISS, Vert. A1, Germany).
2.4 In vitro pH-responsive drug release
The release profiles of ATR and DOX from NPA@D were investigated by a stirring method. Briefly, 3 mL of the ultrasonically dispersed NPA@D (1 mg mL−1) were enclosed in a centrifuge tube with PBS buffer solution (pH 7.4, 6.0 and 4.5) containing 10% (w/v) Tween 80. Every sample was gently stirred at 37 °C, and at the scheduled interval time, 2 mL of sample was removed and an equal volume of fresh medium was replenished. The UV-vis absorption spectra of these solutions containing released ATR and DOX were measured to determine the cumulative release rate, respectively.2.5 Cytotoxicity by calcein AM/PI staining
MCF-7, HL-7702 and MCF-7/ADR cells were cultured at 37 °C using commercially available DMEM and RPMI-1640 medium, respectively, containing 10% or 15% fetal bovine serum and 1% penicillin-streptomycin using the standard cell culture procedure.MCF-7 cells or HL-7702 cells (5 × 10⁴ cells per dish) were seeded and then incubated with NP, ATR (0.75 μg mL−1), DOX (3 μg mL−1), NPA (0.75 μg mL−1 ATR equivalent), NP@D (3 μg mL−1 DOX equivalent), and NPA@D (3 μg mL−1 DOX equivalent, 0.75 μg mL−1 ATR equivalent) for 48 h after attachment, and after that, calcein AM (CA) and propidium iodide (PI) solutions were added into plates and maintained for 15 min before observation using an inverted fluorescent microscope. MCF-7/ADR cells were seeded in cell culture dishes with a density of 1 × 10⁵ cells. After the cells attached, they were incubated with ATR (25 μg mL−1), DOX (100 μg mL−1), NPA (25 μg mL−1 ATR equivalent), NP@D (100 μg mL−1 DOX equivalent), and NPA@D (100 μg mL−1 DOX equivalent, 25 μg mL−1 ATR equivalent) for 72 h. The rest of the steps are the same as described above.
2.6 Cytotoxicity by CCK-8 and real-time tracking
For CCK-8 cytotoxicity assay, MCF-7 cells were seeded into 96-well plates (5.0 × 10³ per well) until adherent and then incubated with ATR (0.75 μg mL−1), DOX (3 μg mL−1), NPA (0.75 μg mL−1 ATR equivalent), NP@D (3 μg mL−1 DOX equivalent) and NPA@D (3 μg mL−1 DOX equivalent, 0.75 μg mL−1 ATR equivalent), cells in each well were incubated with the culture medium containing 10% of CCK-8 for 1 h and the absorbance at 450 nm of each well was obtained using a microplate reader.Next, an xCELLigence system (Roche Diagnostics) was used to monitor the change in the cell index. This system measures electrical impedance on the bottom of the tissue culture E-plate 16, which contains interdigitated electrodes, as the cell index and the data point is collected every 5 minutes.32,33 MCF-7 cells were seeded on the E-plate 16 at 5 × 10³ cells per well and were precultured for 24 h. Then the cells were treated with ATR (0.75 μg mL−1), DOX (3 μg mL−1) NPA (0.75 μg mL−1 ATR equivalent), NP@D (3 μg mL−1 DOX equivalent) and NPA@D (3 μg mL−1 DOX equivalent, 0.75 μg mL−1 ATR equivalent) at the same time. The cell index was measured for 3 days after treatment. The normalized cell index was calculated as follows: (cell index at each point)/(cell index at the point of nanodrug treatment).33
2.7 The uptake and intracellular distribution
MCF-7 and MCF-7/ADR (2.0 × 10⁴) cells were cultured in glass-bottomed dishes overnight to allow cell attachment. Then, the free DOX and NPA@D were added at the same final concentration (8 μg mL−1 DOX equivalent) for 4 h. At predetermined time points, all of the cells were washed using PBS and fixed using 4% paraformaldehyde. DAPI was applied to stain the nucleus for 15 min (blue channel, excitation at 358 nm, emission at 461 nm), fluorescence images of the cellular DOX and NPA@D (red channel, excitation at 488 nm, the fluorescence of DOX was collected from 500 to 545 nm) followed by observing under a CLSM (LSM880 + Airyscan, Germany).Confocal fluorescence imaging was also used to determine the cellular distribution of the NPA@D nanoparticles in MCF-7 cells, the cells were seeded in glass-bottomed dishes at a density of 1.5 × 10⁴/dish, and after cell attachment, the medium was replaced by 1 mL of culture medium containing NPA@D (5 μg mL−1 DOX equivalent), followed by incubation for 2, 6, and 10 h, respectively, using the free DOX-added experimental group incubated for 1 h as the control group. Then the cells were treated using the method described above.
To further determine the position of the NPA@D nanoparticles in the cells, a commercial LysoTracker Green probe (Green channel, excitation: 504 nm, emission at 511 nm) was introduced. Briefly, MCF-7 cells were incubated with NPA@D (5 μg mL−1 DOX equivalent) for 2 h. After that, the cells were washed with PBS and stained with Lysotracker Green for 30 min. Finally, the cells were washed with PBS and then fixed with 4% paraformaldehyde at room temperature. The cells were visualized with a LSCM and the fluorescence images of NPA@D and Lysotracker Green were simultaneously obtained.
2.8 In vivo biodistribution
Female BALB/c-nude mice (20 ± 2 g, 5–7 weeks old) were purchased from Beijing Vital River Laboratory. All animal experiments were performed in accordance with the National Institutes of Health Guidelines on Laboratory Research and approved by the Radiation Protection Institute of Drug Safety Evaluation (Shanxi, China) (Production license: SYXK (Jin) 2018-0005). 4T1 cells (2 × 10⁶) were subcutaneously injected on the right back of the BALB/C mice to establish the tumor model.The 4T1 tumor-bearing mice were administered with 0.2 mL of free DOX (5.0 mg kg−1) and NPA@D (at a dose of 5 mg kg−1 DOX equivalent) by intraperitoneal injection when the tumor sizes reached about 100 mm3, respectively. Of note, NPA@D was dispersed by ultrasound for 30 min before injection. At 4 h and 24 h post-injection, the in vivo fluorescence images were acquired using an in vivo imaging system with 500 nm excitation and 600 nm emission with a bandwidth of 15 nm. After 24 h post-injection imaging, the above mice were sacrificed. Major organs such as the heart, liver, spleen, lungs, kidneys, and tumor were collected and washed with saline for ex vivo fluorescence imaging.
2.9 Statistical analysis
Data were presented as mean value ± SD. Statistical analysis and comparisons were performed via one-way ANOVA or Student's t-test (*p < 0.05, **p < 0.01, and ***p < 0.001).3. Results and discussion
3.1 Preparation and characterization of NPA@D
When nanoparticles loaded with drugs enter the blood circulation, they will face the danger of being captured and cleared by the reticuloendothelial system (RES).34,35 The modification of nanoparticles with polyethylene glycol (PEG) can effectively reduce the clearance by the RES.36,37 Moreover, based on the difference of pH between the tumor microenvironment and normal tissue environment, the introduction of pH-responsive linkage between drugs and the carrier can not only improve the stability of the drug but also achieve the controlled and sustained-release properties of the drug through the breaking of the stimulant linker.38 Herein, the ND was firstly modified with H2N-PEG-COOH (PEG) to obtain PEGylated ND (NP), as shown in Scheme 1A, and then the as-prepared ASS through ATR and cystamine linked via an acid-breakable imine bond was covalently coupled onto NP to form NPA in BBS buffer solution. Next, DOX was loaded onto NPA via electrostatic interactions in Na3Cit buffer solution to acquire the NPA@D nanodrug according to our previously reported method.20 In terms of the synergistic effect of ATRA and DOX,39 NPA@D with a mass ratio of 1![[thin space (1/6-em)]](https://www.rsc.org/images/entities/char_2009.gif) :
:![[thin space (1/6-em)]](https://www.rsc.org/images/entities/char_2009.gif) 4 of ATRA and DOX was selected for further studies. It can be determined that the loadings of ATR and DOX onto the NP were 30 ± 1.8 μg mg−1 and 120.1 ± 5.0 μg mg−1, respectively, based on the absorption standard equation of ASS in Fig. S1† and the absorbance of DOX at 480 nm by means of DOXε480 nm = 11
4 of ATRA and DOX was selected for further studies. It can be determined that the loadings of ATR and DOX onto the NP were 30 ± 1.8 μg mg−1 and 120.1 ± 5.0 μg mg−1, respectively, based on the absorption standard equation of ASS in Fig. S1† and the absorbance of DOX at 480 nm by means of DOXε480 nm = 11![[thin space (1/6-em)]](https://www.rsc.org/images/entities/char_2009.gif) 500 cm−1 mol−1 L−1.
500 cm−1 mol−1 L−1.
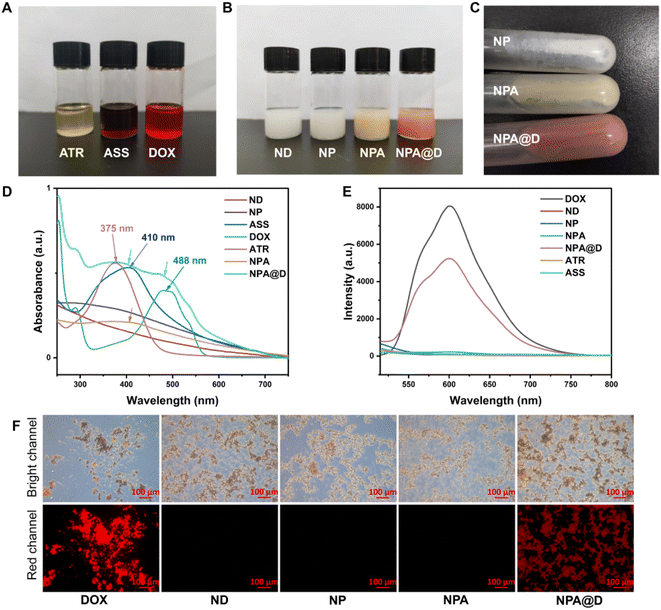
In order to verify whether the NPA@D was acquired, the most intuitive method with the naked eye was used to observe the color of the different drug solutions. As shown in Fig. 1A, ATR, ASS and DOX were in turn yellow, rust red, and bright red under a daylight lamp, and high resolution mass spectrometry (HRMS) also proved that the ASS was smoothly obtained (Fig. S2†). Meanwhile, the intermediate of NP (white), NPA (yellow) and the as-prepared dual-drug nanodrug NPA@D (pale pink) could be visually judged by the color of the solution (Fig. 1B). After centrifugation, the color of the solid-state nanodrug on the wall of the tube can be viewed (Fig. 1C), in which the ND was white, NPA was yellow and NPA@D was pale pink from top to bottom. Collectively, the ATR and DOX were successfully loaded on the NPA@D nanoparticles.
The UV-vis absorption behavior of ND, NP, ASS, DOX, ATR, NPA and NPA@D was further analyzed. As shown in Fig. 1D, we found that the ATR displays a strong absorption peak at 375 nm attributed to the n–π* transition of conjugated alkenes/C![[double bond, length as m-dash]](https://www.rsc.org/images/entities/char_e001.gif) O, while the wavelength is red-shifted to 410 nm when ATR reacted with cystamine dihydrochloride to form ASS, which illustrated that the C
O, while the wavelength is red-shifted to 410 nm when ATR reacted with cystamine dihydrochloride to form ASS, which illustrated that the C![[double bond, length as m-dash]](https://www.rsc.org/images/entities/char_e001.gif) N generated after ATR is transformed into ASS. The absorption spectrum of NPA in Fig. 1D (brown line) is similar to ASS absorption spectrum, that is, the one indicated by the arrow, confirming the successful coupling of ASS to NP. As expected, the absorption peaks of both ASS and DOX indicated by two arrows are observed simultaneously in NPA@D (fruit green line), confirming the successful preparation of NPA@D.
N generated after ATR is transformed into ASS. The absorption spectrum of NPA in Fig. 1D (brown line) is similar to ASS absorption spectrum, that is, the one indicated by the arrow, confirming the successful coupling of ASS to NP. As expected, the absorption peaks of both ASS and DOX indicated by two arrows are observed simultaneously in NPA@D (fruit green line), confirming the successful preparation of NPA@D.
Moreover, the fluorescence emission spectra of DOX, ND, NP, NPA, NPA@D, ATR and ASS are demonstrated in Fig. 1E. Interestingly, for the ND, NP, NPA, ATR and ASS almost no fluorescent signal appeared. Nevertheless, the NPA@D exhibited a broad emission from 500 to 750 nm under the excitation wavelength of 488 nm, which matches the fluorescence spectra of the free DOX, suggesting that the NPA@D maintained the excellent fluorescence characteristics of DOX. Furthermore, as uncovered in Fig. 1F, both NPA@D and free DOX rather than other nanoparticles showed obvious red fluorescence under a fluorescent microscope, again demonstrating successful NPA@D acquisition. Overall, these findings verify that the NPA@D was successfully prepared.
To further determine whether the PEG, ATR and DOX were conjugated onto the surface of the ND, FTIR analysis was used to characterize the nanoparticles (Fig. 2A and B). In NP, the characteristic peaks of the amide band II appeared at 1618 cm−1 compared to the ND; meanwhile, the immobilization of PEG was verified by the absorption bands at 1390 cm−1 attributed to C–N stretching vibration, indicating that PEG was successfully conjugated on the ND surface. From the spectra of NPA and ATR, we can see the disappearance of the C![[double bond, length as m-dash]](https://www.rsc.org/images/entities/char_e001.gif) O absorption vibration peak at 1710 cm−1, verifying the disappearance of the aldehyde group of ATR when forming NPA, and the appearance of the characteristic peak of the disulfide bond at 550 cm−1 proved that the ASS was indeed coupled on the NP. It not only can be seen that all the characteristic peaks of NPA were present in the NPA@D, but also the proton stretching vibration peak of DOX at 1409 cm−1 benzene ring and the C
O absorption vibration peak at 1710 cm−1, verifying the disappearance of the aldehyde group of ATR when forming NPA, and the appearance of the characteristic peak of the disulfide bond at 550 cm−1 proved that the ASS was indeed coupled on the NP. It not only can be seen that all the characteristic peaks of NPA were present in the NPA@D, but also the proton stretching vibration peak of DOX at 1409 cm−1 benzene ring and the C![[double bond, length as m-dash]](https://www.rsc.org/images/entities/char_e001.gif) C stretching vibration peak at 1580 cm−1 benzene ring were present, as shown in Fig. 2B, which revealed the successful loading of ATR and DOX onto the NPA@D nanoparticles. In addition, Raman spectroscopy can be used as an effective method for characterization of nanoparticles (Fig. 2C); the ND showed a sharp characteristic absorption peak at 1332 cm−1,40 as well as a G-band at 1580 cm−1 representing graphite. After coupling PEG, both the characteristic peak of the ND and the G-band of the graphite layer were significantly weakened due to the coverage of PEG. After the grafting of ASS, the absorption peak at 555 cm−1 in the spectrum of NPA, representing the stretching vibration of the disulfide bond and the C
C stretching vibration peak at 1580 cm−1 benzene ring were present, as shown in Fig. 2B, which revealed the successful loading of ATR and DOX onto the NPA@D nanoparticles. In addition, Raman spectroscopy can be used as an effective method for characterization of nanoparticles (Fig. 2C); the ND showed a sharp characteristic absorption peak at 1332 cm−1,40 as well as a G-band at 1580 cm−1 representing graphite. After coupling PEG, both the characteristic peak of the ND and the G-band of the graphite layer were significantly weakened due to the coverage of PEG. After the grafting of ASS, the absorption peak at 555 cm−1 in the spectrum of NPA, representing the stretching vibration of the disulfide bond and the C![[double bond, length as m-dash]](https://www.rsc.org/images/entities/char_e001.gif) N peak at 1680 cm−1 in ASS, approved the successful acquisition of NPA. However, after the NPA was coated with DOX, it can be found for NP@D and NPA@D (Fig. 2D) that the characteristic peaks at 1332 cm−1 of the ND were all masked and no longer visible, indicating that the outer layer of DOX affects the Raman signal, which likewise confirmed the synthesis of NPA@D. Moreover, the detection of particle size, zeta potential and polydispersity index (PDI) can be achieved using a Malvern Nano Particle Sizer. As displayed in Table S1,† the hydrodynamic size of the ND gradually became larger after layer by layer attachment of ATR and DOX. The particle size of NPA@D reached 272.6 ± 2.7 nm, satisfying the enhanced permeability and retention effect (EPR) size at tumor sites.41,42 For the zeta potential of NPA@D (−19.9 mV), which is considered stable in the negatively charged blood circulation due to electrostatic repulsion resulting in prolonged blood circulation and reduced clearance by the reticuloendothelial system (RES).43 This may well explain the distribution of the NPA@D nanoparticles targeting tumor in vivo (Fig. 8). Moreover, the PDI of all nanoparticles was less than 0.2, indicating good dispersity to facilitate access to cells. In addition, the dispersion stability of both the NPA and NPA@D nanoparticles was demonstrated visually with the naked eye (Fig. S3†). It is worth noting that the NPA@D nanoparticles have long-term storage stability; for example, ATR is basically non-leaking, while DOX is only 8.7% after standing for 120 days at 4 °C (Fig. S4†). All this clearly shows that the ND-based drug delivery system had good dispersion and facilitated entry into cells and good blood circulation.
N peak at 1680 cm−1 in ASS, approved the successful acquisition of NPA. However, after the NPA was coated with DOX, it can be found for NP@D and NPA@D (Fig. 2D) that the characteristic peaks at 1332 cm−1 of the ND were all masked and no longer visible, indicating that the outer layer of DOX affects the Raman signal, which likewise confirmed the synthesis of NPA@D. Moreover, the detection of particle size, zeta potential and polydispersity index (PDI) can be achieved using a Malvern Nano Particle Sizer. As displayed in Table S1,† the hydrodynamic size of the ND gradually became larger after layer by layer attachment of ATR and DOX. The particle size of NPA@D reached 272.6 ± 2.7 nm, satisfying the enhanced permeability and retention effect (EPR) size at tumor sites.41,42 For the zeta potential of NPA@D (−19.9 mV), which is considered stable in the negatively charged blood circulation due to electrostatic repulsion resulting in prolonged blood circulation and reduced clearance by the reticuloendothelial system (RES).43 This may well explain the distribution of the NPA@D nanoparticles targeting tumor in vivo (Fig. 8). Moreover, the PDI of all nanoparticles was less than 0.2, indicating good dispersity to facilitate access to cells. In addition, the dispersion stability of both the NPA and NPA@D nanoparticles was demonstrated visually with the naked eye (Fig. S3†). It is worth noting that the NPA@D nanoparticles have long-term storage stability; for example, ATR is basically non-leaking, while DOX is only 8.7% after standing for 120 days at 4 °C (Fig. S4†). All this clearly shows that the ND-based drug delivery system had good dispersion and facilitated entry into cells and good blood circulation.
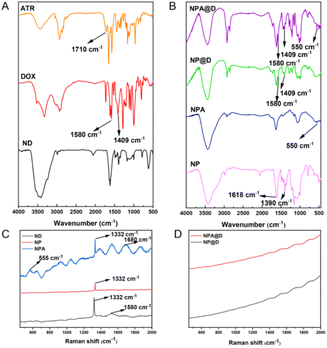 | ||
| Fig. 2 Characterization of NPA@D. (A) FTIR spectra of ND, DOX and ATR. (B) FTIR spectra of NP, NPA, NP@D, and NPA@D. (C) Raman spectra of ND, NP and NPA. (D) Raman spectra of NP@D, and NPA@D. | ||
3.2 In vitro pH-responsive drug release
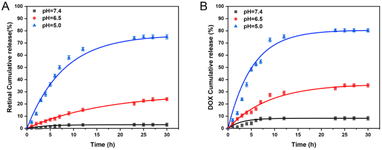
As we all know, the imine bond is sensitive to acidity, so it could be broken in an acidic tumor microenvironment.44 To verify the release of ATR from NPA nanoparticles, HRMS was adopted to assess this under sodium acetate buffer solutions (Fig. S5†). The results show that NPA can release ATR in an acidic environment and that some of the ATR is also oxidized to ATRA. Next, pH responsive drug release profiles of NPA@D were measured in PBS at pH 7.4, 6.5 and 5.0, which mimicked the physiological environment, tumor microenvironment and intracellular acidic conditions of endosomes/lysosomes, respectively. As shown in Fig. 3A, the cumulative release of ATR was basically zero for 30 h at pH 7.4, while cumulative release of ATR was slightly increased at pH 6.5 and remarkably enhanced at pH 5.0 with nearly 80% of ATR released during 30 h. Similarly, DOX was released approximately 5% at pH 7.4, more than 30% at pH 6.5 and 80% at pH 5.0, respectively (Fig. 3B).In addition, the cumulative release of ATR was lower than that of DOX at different pH during 15 h; this might be explained by the covalent coupling of ATR on the nanoparticles, so it needed breakage firstly from the conjugate and then continuous diffusion, which was a little more sophisticated than DOX. Hence, these results proved that the NPA@D nanodrug possessed pH-responsiveness, and it is beneficial to release drugs at more acidic tumor sites rather than the physiological environment. Such a phenomenon is conducive to the protection of normal tissues.
3.3 In vitro cytotoxicity
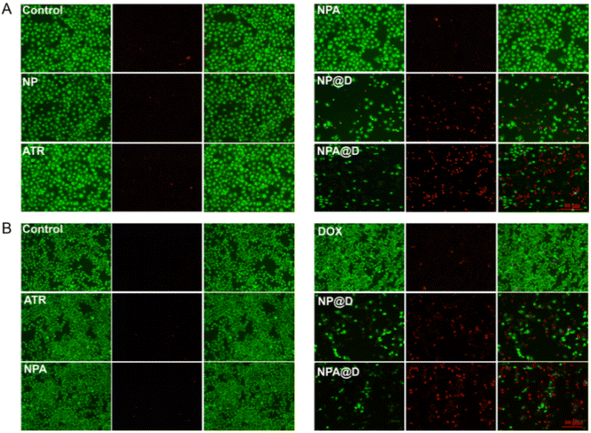
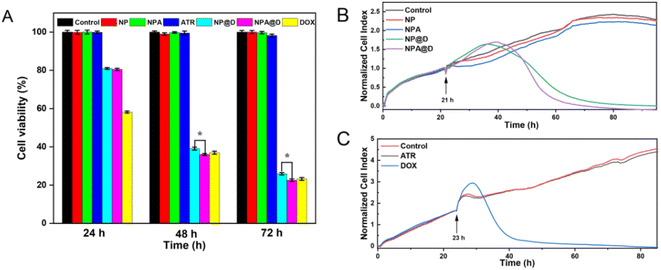
The toxicity of drugs against MCF-7 cells and MCF-7/ADR cells (DOX-resistant cell line) was evaluated by calcein AM/PI staining, and observed using a fluorescent microscope after staining, where calcein AM colored the living cells green, and PI colored the dead cells red. In Fig. 4A, the cells untreated as the control group and the cells treated with NP, ATR, and NPA were wholly green, signifying no apparent cell damage. For the NP@D or NPA@D group, almost all cells were stained by PI to prove death. It is worth noting that NPA@D displayed a brighter red fluorescent signal than NP@D, implying more cell death. However, due to the acute toxicity of free DOX, the MCF-7 cells were completely dead and floated before imaging (Fig. S6†), so no fluorescence imaging was performed. Moreover, the cells treated with free DOX had almost no red fluorescence (Fig. 4B), which indicated that the cells were basically not dead and this is related to the resistance of MCF-7/ADR cells to DOX. As expected, NPA@D was more effective in killing MCF-7/ADR cells than the NP@D, suggesting that the NPA@D could reverse the multidrug resistance, and ATR enhanced the cytotoxicity of DOX on the NPA@D platform.Likewise, the results of the CCK-8 assay of MCF-7 cells depicted in Fig. 5A were consistent with the double-staining assay (Fig. 4A). The ATR, NP and NPA groups showed negligible toxicity to cells at any time, while there was no significant difference in cell viability in NP@D and NPA@D treated cells for 24 hours. Interestingly, compared with the NP@D, NPA@D had a more pronounced cell killing ability with the prolongation of time such as 48 or 72 h, which is presumed to be the fact that it took time for the ATR released by the cleavage of the acid-sensitive imine bond to convert into all-trans retinoic acid (ATRA) after NPA@D was uptaken into cells, and then it will work with DOX to kill cells. In addition, the calcein AM/PI staining was also performed on HL-7702 cells as normal cells (Fig. S7†), which showed that the NP@D and NPA@D had negligible toxicity to HL-7702 cells. This is mainly due to the fact that the microenvironment in normal cells is not conducive to acid-sensitive drug release. The results uncovered that the nanodrug has the ability to selectively kill tumor cells. Consistently, the CCK-8 assay of MCF-7 cells exhibited the highest level of cell mortality for the NPA@D nanodrug.
To further investigate the real-time effect of NPA@D on tumor cells, the normalized cell index was quantified using a label-free method (RTCA S16). Here, different nanoparticles were added to MCF-7 cells in the logarithmic growth phase at 21 h (arrow in the picture), and the cells without drug treatment were used as a control group (Fig. 5B). It can be noticed that although NPA@D exhibited a later curve inflection point with a delay of about 3 hours than that of NP@D, its curve decreased more rapidly, and almost all cells died at about 60 hours, which is 15 hours earlier than NP@D. This result probably resulted from that intracellular released ATR transforms into ASS and collaborates with DOX to promote cell death. The NP and NPA were shown to be nearly non-toxic, similar to the results of control group treatment. Next, the MCF-7 cells were treated with ATR and DOX alone. As shown in Fig. 5C, the cells were killed in large numbers within a short period of time when free DOX entered the cells. Such a result indicated that both NP@D and NPA@D had sustained drug release properties. Similarly, cells treated with ATR alone had little effect on cell proliferation. It is further shown by calculation that a half of normalized cell index (NCI50) for the free DOX is about 11 h, NP@D about 33 h and NPA@D about 30 h, respectively, indicating that DOX kills cells at a fast rate, while the nanodrug has a delayed effect and the synergistic effect of NPA@D shortens the time compared to NP@D. The above results matched well with CCK-8 assay, proving that the NPA@D was an excellent synergistic therapy system and enhanced the effect of DOX on chemotherapy.
3.4 Drug uptake
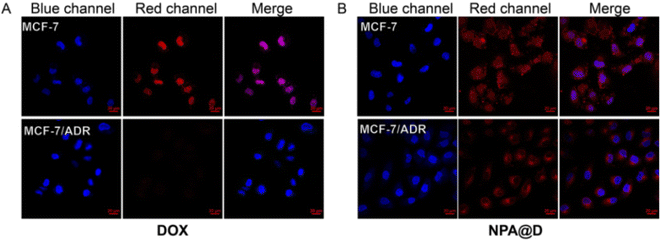
In recent decades, despite improved patient survival due to advances in targeted treatment, breast cancer patients often suffer relapse due to drug resistance mechanisms.21 To determine if the NPA@D nanodrug reverses resistance, the potential multidrug resistance (MDR) overcoming efficacy was further estimated by monitoring the intracellular internalization of free DOX and NPA@D in DOX-resistant MCF-7/ADR and DOX-sensitive MCF-7 cells as controls. As depicted in Fig. 6, the fluorescence signals of free DOX in MCF-7/ADR cells were obviously weaker than those in MCF-7 cells after 4 h of co-incubation; presumably, a lot of free DOX was pumped out by the P-gp transporter in MCF-7/ADR cells.45,46 On the contrary, DOX endocytosis efficacy in MCF-7/ADR cells was enhanced by the delivery of NAP@D nanoparticles, which is mainly attributed to that NAP@D nanoparticles avoid the capture of P-gp transporter and escape being pumped out of the cells. We speculate that this phenomenon is due to the difference in particle size and the mechanism by which the drug enters the cells. The NAP@D with nanometer particle size is caveolin that mediates endocytosis into cells (Fig. S8C†), while DOX as small molecules enters the cells through passive diffusion.47 This results in NAP@D enrichment in tumor cells and further facilitates overcoming resistance in MCF-7/ADR cells. This potential resistance to drug resistance suggested that NAP@D may have clinical benefits, especially for patients with drug-resistant cancers or recurrence following chemotherapy.3.5 Intracellular distribution
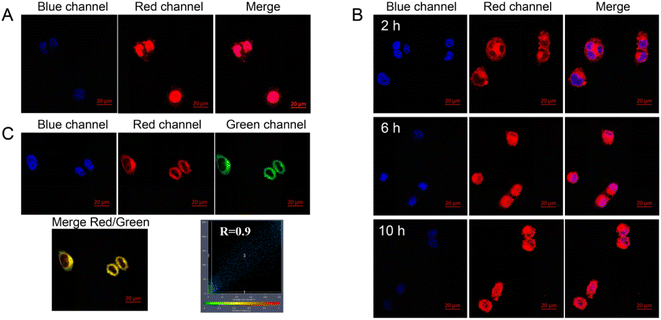
Laser confocal microscopy was used to verify the NPA@D cellular uptake and intracellular localization behavior. As shown in Fig. 7A, free DOX as the control was located in the cell nucleus after 1 h, which is attributed to the truth that small molecules can quickly diffuse into the cells.31 However, it can be observed from the cells treated with the NPA@D nanodrug that the red fluorescence of DOX only appears in the cytoplasm at 2 h and begins to transfer to the nucleus as time goes on in Fig. 7B. This proves once again that NPA@D has sustained drug release, which is consistent with the cytotoxicity assay in vitro.To track the intracellular fate of the NPA@D after being internalized by the cells, co-localization imaging experiments were performed to identify where the NPA@D is located. Lyso-Tracker green probe (LGR), a commercial fluorescent dye, was employed to label lysosomes, and the intracellular distribution of NPA@D can be determined by whether the Lyso-Tracker fluorescence can be superimposed with DOX fluorescence present on the NPA@D. Fig. 7C illustrates that the fluorescence of NPA@D overlapped well with that of the green lysosome probe with a colocalization index of R = 0.90. It is well known that when the colocalization index is greater than 0.5,48 the colocalization effect is considered to be good. Therefore, it implied that the NPA@D mainly located in the lysosomes with the acidic environment after entering the cells, and the acid-responsive covalent bond in the NPA@D was broken to release ATR, which was transformed into ATRA in the lysosomes,49 and exerted a synergistic anti-tumor effect with DOX. Besides, the NPA@D nanoparticles entered cells through an endocytic pathway, which is caveolin and temperature-dependent (Fig. S8†). This is a bit different from our previous report on the ND-based drug delivery system,18,20 possibly ascribed to the loading of the nanodrug surface by two different chemotherapeutic drugs.
Moreover, the rapid migration ability of tumor cells is the main cause of tumor spread. Hence the effect of NPA@D on tumor cell migration inhibition was assessed by transwell assay. The number of cells migrating from the upper compartment to the lower compartment of the transwell chamber can reflect their migration ability in Fig. S9A.† The migration inhibition rate of NPA@D was 9% higher than that of NP@D at 36 h, where the migration inhibition rates of NP@D and NPA@D were up to 70% and 85% at 48 h, respectively (Fig. S9B and C†). In addition, the effect on cellular migration was also studied by wound assay with similar results (Fig. S10†). Collectively, the cell-migration ability could be highly inhibited with the NPA@D nanodrug.
3.6 In vivo bio-distribution
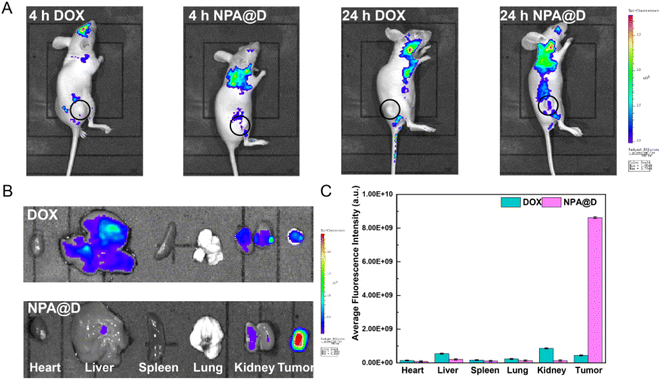
To explore the potential of the designed NPA@D nanodrug in vivo, in vivo distribution of drugs is studied in tumor-bearing mice. An in vivo imaging system was used to assess the distribution of free DOX and NPA@D nanodrug within 4 h and 24 h after administration. NPA@D in vivo distribution was tracked by the DOX fluorescence signal following intraperitoneal injection (Fig. 8A), and free DOX acted as a control. Faint fluorescence concentrated at the tumor sites in NAP@D-treated mice at 4 h, while fluorescence remained relatively weak in the DOX group. After 24 h of injection, the fluorescence of the tumor in the DOX group was negligible, while the fluorescence of the NPA@D group increased and was stronger than that of the DOX group. This is likely due to the enhanced permeability and retention effect (EPR).50–54At the predetermined time, the main organs and tumors were dissected for imaging. As observed in Fig. 8B, after 24 h, the mice with the intraperitoneally injected NPA@D exhibited much stronger fluorescence intensity in tumors than the DOX group, which is attributed to the appropriate particle size for EPR effect. And the average fluorescence intensity in the tumor for the NPA@D treated mice was 19 times higher than that of the DOX group, which is attributed to the appropriate particle size for EPR effect. And the average fluorescence intensity in the tumor for the NPA@D treated mice was 19 times higher than that of the DOX group, as shown in Fig. 8C. However, significant fluorescence was also found in the liver and kidneys for the free DOX group, while this signal was lacking in the NPA@D group. These phenomena suggested that the nanoparticles can escape the capture of the RES to enter the tumor site, but also are not quickly cleared by lymphatic fluid return, and NPA@D was retained at the tumor site by EPR effect for a long time, keeping the drug on site to kill tumors.
4. Conclusions
Although DOX is a widely used chemotherapy drug, the MDR effect and systemic toxic side effects hinder its clinical applications. To circumvent these side effects of DOX, a new type of pH-sensitive NPA@D co-delivery system with outstanding physiological stability was fabricated, which can simultaneously deliver ATR and DOX to breast cancer cells. The synergistic therapeutic effect of the two drugs was utilized to improve the curative effect of chemotherapeutic DOX on cancer cells. More importantly, NPA@D nanoparticles can effectively target and enrich tumor sites through the EPR effect in vivo rather than any other organ. Therefore, combination therapy of ATR and DOX with simultaneous delivery based on the ND platform may have an extensive outlook, particularly for patients who have developed resistance or recurrence due to single chemotherapeutic agent treatment. The results yielded new information about combination therapy, which may provide new insights into the efficient application of NDs in biomedical applications.Author contributions
Jicheng Cui: methodology, investigation, resources, data curation, writing original draft. Bo Hu: conceptualization, methodology, writing review and editing. Yuejun Fu: investigation, writing review and editing. Zhengkun Xu: investigation, writing review and editing. Yingqi Li: conceptualization, methodology, project administration, supervision, writing review and editing, funding acquisition.Conflicts of interest
The authors declare that there are no competing financial interests or personal relationships that influence our work.Acknowledgements
This work is supported by the Central Government Guiding Local Science and Technology Development (Grant No. YDZX20191400002477), the Shanxi Province Natural Science Foundation (Grant No. 202203021221003), Shanxi Province patent transformation project (Grant No. 202304015), CIRP Open Fund of Radiation Protection Laboratories (Grant No. CIRP-CAEA20220203), Interdisciplinary construction project of Shanxi University (Grant No. 113541028).References
- H. Sung, J. Ferlay, R. L. Siegel, M. Laversanne, I. Soerjomataram, A. Jemal and F. Bray, Ca-Cancer J. Clin., 2021, 71, 209–249 CrossRef PubMed.
- J. Prados, C. Melguizo, R. Ortiz, C. Velez, P. J. Alvarez, J. L. Arias, M. A. Ruiz, V. Gallardo and A. Aranega, Anti-Cancer Agents Med. Chem., 2012, 12, 1058–1070 CrossRef CAS PubMed.
- C.-M. J. Hu, S. Aryal and L. Zhang, Ther. Delivery, 2010, 1, 323–334 CrossRef CAS PubMed.
- X. Wang, X. Zhong, Z. Liu and L. Cheng, Nano Today, 2020, 35, 100946 CrossRef CAS.
- X. Wang, F. Li, X. Yan, Y. Ma, Z.-H. Miao, L. Dong, H. Chen, Y. Lu and Z. Zha, ACS Appl. Mater. Interfaces, 2017, 9, 41782–41793 CrossRef CAS PubMed.
- X. Wang, Y. Ma, H. Chen, X. Wu, H. Qian, X. Yang and Z. Zha, Colloids Surf., B, 2017, 152, 449–458 CrossRef CAS PubMed.
- X. Wang, X. Wang, Q. Yue, H. Xu, X. Zhong, L. Sun, G. Li, Y. Gong, N. Yang, Z. Wang, Z. Liu and L. Cheng, Nano Today, 2021, 39, 101170 CrossRef CAS.
- Y. Yang, X. Wang, H. Qian and L. Cheng, Appl. Mater. Today, 2021, 25, 101215 CrossRef.
- S. Ning, X. Dai, W. Tang, Q. Guo, M. Lyu, D. Zhu, W. Zhang, H. Qian, X. Yao and X. Wang, Acta Biomater., 2022, 152, 562–574 CrossRef CAS PubMed.
- D. Zhu, R. Ling, H. Chen, M. Lyu, H. Qian, K. Wu, G. Li and X. Wang, Nano Res., 2022, 15, 7320–7328 CrossRef CAS.
- D. Liu, X. Dai, W. Zhang, X. Zhu, Z. Zha, H. Qian, L. Cheng and X. Wang, Biomaterials, 2023, 292, 121917 CrossRef CAS PubMed.
- W. Guo, T. Wang, C. Huang, S. Ning, Q. Guo, W. Zhang, H. Yang, D. Zhu, Q. Huang, H. Qian and X. Wang, Nano Res., 2023, 16, 782–791 CrossRef CAS.
- L. Zhang, X.-Q. Yang, J.-S. Wei, X. Li, H. Wang and Y.-D. Zhao, Theranostics, 2019, 9, 5424–5442 CrossRef CAS PubMed.
- D. H. Jariwala, D. Patel and S. Wairkar, Mater. Sci. Eng. C, 2020, 113, 110996 CrossRef CAS PubMed.
- K. Turcheniuk and V. N. Mochalin, Nanotechnology, 2017, 28, 252001 CrossRef CAS PubMed.
- U. T. Uthappa, O. R. Arvind, G. Sriram, D. Losic, J. Ho Young, M. Kigga and M. D. Kurkuri, J. Drug Delivery Sci. Technol., 2020, 60, 101993 CrossRef CAS.
- S. Garifo, D. Stanicki, G. Ayata, R. N. Muller and S. Laurent, Front. Mater. Sci., 2021, 15, 334–351 CrossRef.
- X. Du, L. Li, S. Wei, S. Wang and Y. Li, J. Mater. Chem. B, 2020, 8, 1660–1671 RSC.
- S. Wei, L. Li, X. Du and Y. Li, J. Mater. Chem. B, 2019, 7, 3390–3402 RSC.
- L. Li, L. Tian, Y. Wang, W. Zhao, F. Cheng, Y. Li and B. Yang, J. Mater. Chem. B, 2016, 4, 5046–5058 RSC.
- T. B. Toh, D. K. Lee, W. Hou, L. N. Abdullah, J. Nguyen, D. Ho and E. K. H. Chow, Mol. Pharm., 2014, 11, 2683–2691 CrossRef CAS PubMed.
- L. Wang, W. Su, K. Z. Ahmad, X. Wang, T. Zhang, Y. Yu, E. K.-H. Chow, D. Ho and X. Ding, Nano Res., 2021, 1–11 Search PubMed.
- Y. Zhang, P. Li, H. Pan, L. Liu, M. Ji, N. Sheng, C. Wang, L. Cai and Y. Ma, Biomaterials, 2016, 83, 219–232 CrossRef CAS PubMed.
- Y. Abaza, H. Kantarjian, G. Garcia-Manero, E. Estey, G. Borthakur, E. Jabbour, S. Faderl, S. O'Brien, W. Wierda, S. Pierce, M. Brandt, D. McCue, R. Luthra, K. Patel, S. Kornblau, T. Kadia, N. Daver, C. DiNardo, N. Jain, S. Verstovsek, A. Ferrajoli, M. Andreeff, M. Konopleva, Z. Estrov, M. Foudray, D. McCue, J. Cortes and F. Ravandi, Blood, 2017, 129, 1275–1283 CrossRef CAS PubMed.
- F. Rodier and J. Campisi, J. Cell Biol., 2011, 192, 547–556 CrossRef CAS PubMed.
- Y. Liu, F. Yu, S. Dai, T. Meng, Y. Zhu, G. Qiu, L. Wen, X. Zhou, H. Yuan and F. Hu, Mol. Pharm., 2021, 18, 3966–3978 CrossRef CAS PubMed.
- T. T. Schug, D. C. Berry, N. S. Shaw, S. N. Travis and N. Noy, Cell, 2007, 129, 723–733 CrossRef CAS PubMed.
- L. Hou, J. Yao, J. Zhou and Q. Zhang, Biomaterials, 2012, 33, 5431–5440 CrossRef CAS PubMed.
- K. Seiter, E. J. Feldman, H. D. Halicka, A. Deptala, F. Traganos, H. B. Burke, A. Hoang, H. Goff, M. Pozzuoli, R. Kancherla, Z. Darzynkiewicz and T. Ahmed, Br. J. Haematol., 2000, 108, 40–47 CrossRef CAS PubMed.
- S. Karmakar, N. L. Banik and S. K. Ray, Cancer, 2008, 112, 596–607 CrossRef CAS PubMed.
- L. Li, L. Tian, W. Zhao, F. Cheng, Y. Li and B. Yang, RSC Adv., 2016, 6, 36407–36417 RSC.
- S. Zhu, J. Hong, M. K. Tripathi, V. Sehdev, A. Belkhiri and W. El-Rifai, Mol. Cancer Res., 2013, 11, 86–94 CrossRef CAS PubMed.
- Y. Yamashita-Kashima, S. Iijima, K. Yorozu, K. Furugaki, M. Kurasawa, M. Ohta and K. Fujimoto-Ouchi, Clin. Cancer Res., 2011, 17, 5060–5070 CrossRef CAS PubMed.
- W. Ngo, S. Ahmed, C. Blackadar, B. Bussin, Q. Ji, S. M. Mladjenovic, Z. Sepahi and W. C. W. Chan, Adv. Drug Delivery Rev., 2022, 185, 114238 CrossRef CAS PubMed.
- Y. Y. Chen, A. M. Syed, P. MacMillan, J. V. Rocheleau and W. C. W. Chan, Adv. Mater., 2020, 32, 1906274 CrossRef CAS PubMed.
- B. Nearingburg and A. L. Elias, Thermochim. Acta, 2011, 512, 247–253 CrossRef CAS.
- D. Wang, Y. Tong, Y. Li, Z. Tian, R. Cao and B. Yang, Diamond Relat. Mater., 2013, 36, 26–34 CrossRef CAS.
- T. Kaasgaard and T. L. Andresen, Expert Opin. Drug Delivery, 2010, 7, 225 CrossRef CAS PubMed.
- H. Li, M. Ma, J. Zhang, W. Hou, H. Chen, D. Zeng and Z. Wang, ACS Appl. Mater. Interfaces, 2019, 11, 20341–20349 CrossRef CAS PubMed.
- V. N. Mochalin, O. Shenderova, D. Ho and Y. Gogotsi, Nat. Nanotechnol., 2011, 7, 11–23 CrossRef PubMed.
- M. Ikeda-Imafuku, L. L.-W. Wang, D. Rodrigues, S. Shaha, Z. Zhao and S. Mitragotri, J. Controlled Release, 2022, 345, 512–536 CrossRef CAS PubMed.
- Y. Liu, D. Sun, Q. Fan, Q. Ma, Z. Dong, W. Tao, H. Tao, Z. Liu and C. Wang, Nano Res., 2020, 13, 564–569 CrossRef CAS.
- K. Xiao, Y. Li, J. Luo, J. S. Lee, W. Xiao, A. M. Gonik, R. G. Agarwal and K. S. Lam, Biomaterials, 2011, 32, 3435–3446 CrossRef CAS PubMed.
- J. G. Li, X. S. Yu, Y. Wang, Y. Y. Yuan, H. Xiao, D. Cheng and X. T. Shuai, Adv. Mater., 2014, 26, 8217–8224 CrossRef CAS PubMed.
- G. Zhao, Y. Sun and X. Dong, Langmuir, 2020, 36, 2383–2395 CrossRef CAS PubMed.
- A. Cao, P. Ma, T. Yang, Y. Lan, S. Yu, L. Liu, Y. Sun and Y. Liu, Mol. Pharm., 2019, 16(6), 2502–2510 CrossRef CAS PubMed.
- Y. Li, X. Zhou, D. Wang, B. Yang and P. Yang, J. Mater. Chem., 2011, 21, 16406 RSC.
- Y. K. Lee, J. Choi, W. Wang, S. Lee, T. H. Nam, W. S. Choi, C. J. Kim, J. K. Lee, S. H. Kim and S. S. Kang, ACS Nano, 2013, 7, 8484–8497 CrossRef CAS PubMed.
- H. N. Li, D. P. Zeng, Z. Y. Wang, L. Q. Fang, F. Q. Li and Z. B. Wang, Nanomedicine, 2018, 13, 981–996 CrossRef CAS PubMed.
- J. Li, Y. Zhu, W. Li, X. Zhang, Y. Peng and Q. Huang, Biomaterials, 2010, 31, 8410–8418 CrossRef CAS PubMed.
- H. Maeda, H. Nakamura and J. Fang, Adv. Drug Delivery Rev., 2013, 65, 71–79 CrossRef CAS PubMed.
- B. Torres-Herrero, I. Armenia, M. Alleva, L. Asín, S. Correa, C. Ortiz, Y. Fernández-Afonso, L. Gutiérrez, J. M. de la Fuente, L. Betancor and V. Grazú, ACS Nano, 2023, 17, 12358–12373 CrossRef CAS PubMed.
- A. H. Colby, J. Kirsch, A. N. Patwa, R. Liu, B. Hollister, W. McCulloch, J. E. Burdette, C. J. Pearce, N. H. Oberliels, Y. L. Colson, K. Liu and M. W. Grinstaff, ACS Nano, 2023, 17, 2212–2221 CrossRef CAS PubMed.
- N. N. Parayath, A. Parikh and M. M. Amiji, Nano Lett., 2018, 18, 3571–3579 CrossRef CAS PubMed.
Footnotes |
| † Electronic supplementary information (ESI) available. See DOI: https://doi.org/10.1039/d3ra03907b |
| ‡ These authors contributed equally to this work. |
| This journal is © The Royal Society of Chemistry 2023 |

