 Open Access Article
High quantum efficiency and excellent color purity of red-emitting Eu3+-heavily doped Gd(BO2)3-Y3BO6-GdBO3 phosphors for NUV-pumped WLED applications
Manh Trung Tran a,
Nguyen Van Quangb,
Nguyen Thi Huyenb,
Nguyen Tu
 *c,
Nguyen Van Duc,
Do Quang Trung
 c,
Nguyen Tri Tuand,
Nguyen Duy Hunge,
Dao Xuan Viete,
Duong Thanh Tunge,
Nguyen Duc Trung Kienf,
Tong Thi Hao Tamg and
Pham Thanh Huy
 a
a
aFaculty of Materials Science and Engineering, Phenikaa University, Yen Nghia, Ha-Dong district, Hanoi 10000, Vietnam
bDepartment of Chemistry, Hanoi Pedagogical University 2, Phuc Yen, Vinh Phuc, Vietnam
cFaculty of Fundamental Sciences, Phenikaa University, Yen Nghia, Ha-Dong district, Hanoi 10000, Vietnam. E-mail: tu.nguyen@phenikaa-uni.edu.vn
dCollege of Science, Cantho University, 3/2 Ninh Kieu, Cantho 94000, Vietnam
eInternational Training Institute for Materials Science (ITIMS), Hanoi University of Science and Technology (HUST), 01 Dai Co Viet, Hanoi, 10000, Vietnam
fFaculty of Electrical and Electronic Engineering, Phenikaa University, Yen Nghia, Ha-Dong district, Hanoi 10000, Vietnam
gSchool of Information Technology and Digital Economics (SITDE), National Economics University (NEU), 207 Giai Phong Street, Hanoi 10000, Vietnam
First published on 22nd August 2023
Abstract
Eu3+-doped phosphors have been much attractive owing to their narrow-band red emission peak at 610–630 nm with high color purity; however, the weak and narrow absorption band in the NUV region limits their applications. Doping a higher amount of Eu3+ ions into a non-concentration quenching host could be key to enhancing the efficiency of the absorption value and emission intensity. Hence, the design of Eu3+-heavily doped phosphors with a suitable host lattice is key for applications. In this study, red-emitting Eu3+-doped Gd(BO2)3-Y3BO6-GdBO3 (GdYGd:Eu3+) phosphor with a high quantum efficiency of 58.4% and excellent color purity of 99.5% is reported for the first time. The phosphor is efficiently excited by NUV light at 394 nm and emits a strong red emission band in the 590–710 nm range, peaking at 612 nm. The optimal annealing temperature and Eu3+ doping content to obtain the strongest PL intensity are 1100 °C and 20 mol%, respectively. The optimized GdYGd:Eu3+ phosphor possesses a high activation energy of 0.319 eV and a lifetime of 1.14 ms. An illustration of phosphor-coated NUV LED with chromaticity coordinates (x = 0.5636,y = 0.2961) was successfully synthesized, demonstrating the great potential of GdYGd:Eu3+ phosphor for NUV-pumped WLED applications.
1. Introduction
Phosphor-converted white light-emitting diodes (pc-WLEDs) are widely used in industry and life because of their many advantages, such as a long lifetime, less thermal radiation, high efficiency, low energy consumption, and eco-friendliness.1 Pc-WLEDs are typically fabricated by combining LED chips with down-converting phosphors.2 Commercially available WLEDs are often obtained by placing the yellow-emitting YAG:Ce3+ phosphor on a blue LED chip (InGaN-460 nm).3 However, this approach has some drawbacks, such as a poor color rendering index (CRI < 80) and highly unexpected correlated color temperature (>4000 K) due to the shortage of red emission.4 Consequently, significant efforts have been dedicated to exploring viable solutions to manipulate white light through the relevant combination of red, green, and blue (RGB) emissions.5 The most common high-CRI pc-WLED is produced by two main techniques: (i) covering green and red-emitting phosphors on a blue LED chip and (ii) coating a mixture of blue, green, and red-emitting phosphors on a near-UV (NUV) LED chip.6 Over the past few decades, enormous RGB phosphors have been discovered; however, the efficiency of red-emitting phosphors has not satisfied the need for practical application in low brightness.1 This obstacle has become more severe for red-emitting phosphors because of the low sensitivity of human eyes to the red and far-red spectral region.7 According to the literature, europium (Eu2+ and Eu3+) and manganese (Mn4+) ions are prevalently used as activators for red-emitting phosphors.8 The most favorable selection for commercial applications is Eu2+-doped phosphors owing to their broad absorption band in the range of 400–480 nm is well matched with the blue LED chip emission.9 Unfortunately, the synthesis of these phosphors requires very harsh conditions, such as extreme temperature (1800 °C), excessive atmosphere (0.9 MPa), and an inert gas (N2), leading to high cost.10 In addition, the use of blue excitation causes significant reabsorption and reduces the quality of output light.11 Eu3+-doped phosphors could solve this issue because of the featured excitation in the NUV region (360–420 nm).5 Owing to the characteristic 5D0 → 7FJ (J = 1, 2, 3, and 4) transitions, Eu3+-doped phosphors could produce narrow-band orange-red/red emissions, in which the orange-red (610–630 nm) emission, corresponding to the 5D0 → 7F2 transition, is appropriate for indoor or full-color display applications with high color purity.8 However, NUV-pumped pc-WLED using the Eu3+-doped phosphors show a low quantum efficiency (QE) owing to the negligible absorption in the NUV and blue region, resulting from the parity-forbidden transitions (7F0 → 5D4, 5L6, 5D3).12 It is well known that red-emitting Y2O2S:Eu3+, green-emitting ZnS:Cu+, Al3+, and blue-emitting BaMgAl10O17:Eu2+ phosphors are currently used for UV InGaN-based WLED; however, the efficiency of green and blue phosphors is eight times higher than that of red phosphor.13 In addition, the life duration of Y2O2S:Eu3+ material is insufficient under prolonged UV irradiation.6 Thus, NUV-pumped novel red-emitting phosphors with high efficiency are in great demand to replace the current Y2O2S:Eu3+ material for emerging applications.4On the one hand, higher efficiency of absorption value and emission intensity could be achieved by doping more Eu3+ dopant content in non-concentration quenching hosts, such as Ca3Y2−xB4O12:xEu3+ (ref. 14) or Ba6Gd2(1−x)Ti4O17:xEu3+.5 On the other hand, developing a suitable host matrix for NUV-excited WLED is also considered to provide non-inversion symmetry sites for dopant Eu3+ ions.15 Accordingly, high-brightness red-emitting Eu3+-doped phosphors well excited at 395 nm, such as Ca3(PO4)2:Eu3+ (ref. 16) and Sr3Y(BO3)3:Eu3+,3 are interesting for use in NUV-pumped LEDs. Another prominent candidate, the AlPO4:Eu3+ phosphor, with high quantum efficiency and excellent thermal stability for NUV-pumped WLED, has been reported in our previous study.8 It was previously reported that GdBO3,17–19 Gd(BO2)3,20 and Y3BO6 (ref. 21 and 22) are excellent host lattices to dope a high amount of Eu3+ ions; however, only a low quantum efficiency of 14.30% could be obtained under the excitation of NUV light. It is well known that the introduction of dopants at a critical concentration in a material often leads to a decrease in photoluminescence (PL) intensity, resulting in a lower quantum efficiency of the synthesized material.8 To enhance quantum efficiency, one effective approach is the heavy doping of the host lattice.23,24 Significantly, this can be accomplished within multiphase lattices, offering a compelling pathway for optimizing the optical properties of the material.25
Herein, a novel Eu3+-heavily doped Gd(BO2)3-Y3BO6-GdBO3 (GdYGd:Eu3+) NUV-pumped red-emitting phosphors with high quantum efficiency and excellent color purity. The influence of synthesis parameters on the crystal structure and luminescence characteristics has been systematically studied. Further, the chromaticity coordinates, color purity, thermal stability, and quantum efficiency of synthesized phosphors are discussed. A prototype of a phosphor-converted NUV LED is fabricated, demonstrating the high potential for NUV-pumped WLED applications.
2. Materials and methods
2.1. Material preparation
The red-emitting GdYGd:Eu3+ phosphor was obtained by applying a simple sol–gel method using the initial materials, including Y2O3 (Sigma-Aldrich 99.99%), Eu2O3 (Sigma-Aldrich 99.99%), Gd2O3 (Sigma-Aldrich 99.99%), H3BO3 (Sigma-Aldrich 99.99%), C6H8O7·H2O (Sigma-Aldrich 99.99%) and HNO3 (Merck, 67%). First, Y2O3, Eu2O3, and Gd2O3 oxides were magnetically stirred at room temperature in an HNO3 solution for 60 minutes to dissolve completely. During this process, H3BO3 and C6H8O7·H2O solutions were gradually dropped to obtain a transparent solution. Then, this solution was continuously stirred at 120 °C for 6 h to obtain a wet gel product. The wet gel was also stirred at 200 °C for 5 h to obtain a dry gel. The dry gel was ground using an agate mortar for 30 minutes in the next step. Finally, the received product was annealed at 600–1200 °C in the air for 5 h to achieve the final GdYGd:Eu3+ phosphor powders.2.2. LED device fabrication
A red LED was produced using the following procedure. First, an elastomer and a hardener were mixed in a proportion of 1![[thin space (1/6-em)]](https://www.rsc.org/images/entities/char_2009.gif) :
:![[thin space (1/6-em)]](https://www.rsc.org/images/entities/char_2009.gif) 1 to obtain a polydimethylsiloxane solution (PDMS, Dow Corning OE-7340 Optical Encapsulant). Then, the optimized GdYGd:Eu3+ phosphor was incorporated with a PDMS solution (phosphor
1 to obtain a polydimethylsiloxane solution (PDMS, Dow Corning OE-7340 Optical Encapsulant). Then, the optimized GdYGd:Eu3+ phosphor was incorporated with a PDMS solution (phosphor![[thin space (1/6-em)]](https://www.rsc.org/images/entities/char_2009.gif) :
:![[thin space (1/6-em)]](https://www.rsc.org/images/entities/char_2009.gif) PDMS = 1
PDMS = 1![[thin space (1/6-em)]](https://www.rsc.org/images/entities/char_2009.gif) :
:![[thin space (1/6-em)]](https://www.rsc.org/images/entities/char_2009.gif) 4) by applying a 27-second process utilizing a planetary mixer (Kurabo Mazerustar KK-V300SS). The red LED prototype was obtained by putting the prepared mixture on the cover of a NUV 395 nm chip utilizing a dispenser (i-DR S310A Desktop Dispensing Systems), followed by a 4 h dried process at 150 °C using an oven (ASONE AVO-310SB-D). The schematic fabrication procedure for GdYGd:Eu3+ phosphors and LED device are presented in Fig. 1.
4) by applying a 27-second process utilizing a planetary mixer (Kurabo Mazerustar KK-V300SS). The red LED prototype was obtained by putting the prepared mixture on the cover of a NUV 395 nm chip utilizing a dispenser (i-DR S310A Desktop Dispensing Systems), followed by a 4 h dried process at 150 °C using an oven (ASONE AVO-310SB-D). The schematic fabrication procedure for GdYGd:Eu3+ phosphors and LED device are presented in Fig. 1.
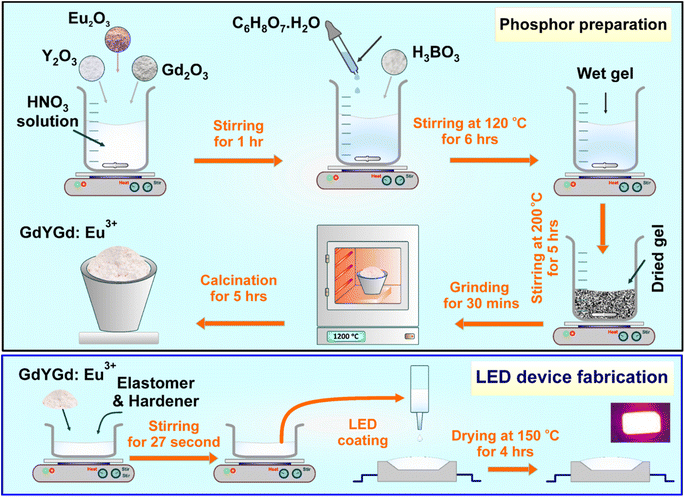 | ||
| Fig. 1 Schematic fabrication procedure for the Eu3+-doped Gd(BO2)3-Y3BO6-GdBO3 phosphors and LED device. | ||
2.3. Characterization
The crystalline structure of all samples was characterized by a D8 Advance X-ray diffractometer using CuKα (λCu = 1.5406 Å) radiation. The surface morphology of the samples was investigated by field emission scanning electron microscopy (FESEM-JEOL/JSM-7600F). The grain size variation was evaluated using an LB-550 dynamic light scattering system (Horiba, USA). Photoluminescence (PL, 3D PL) and photoluminescence excitation (PLE) spectra were studied using a NanoLog fluorescence spectrophotometer (Horiba, USA) with a 450 W xenon lamp. The optical characterization of the red LED illustration was investigated with a GS-1290-3 spectroradiometer (Gamma Scientific, USA) using an integrating sphere with a diameter of 50 cm. All the above characterizations were carried out under ambient conditions.3. Results and discussion
3.1. Surface morphology and structure analysis
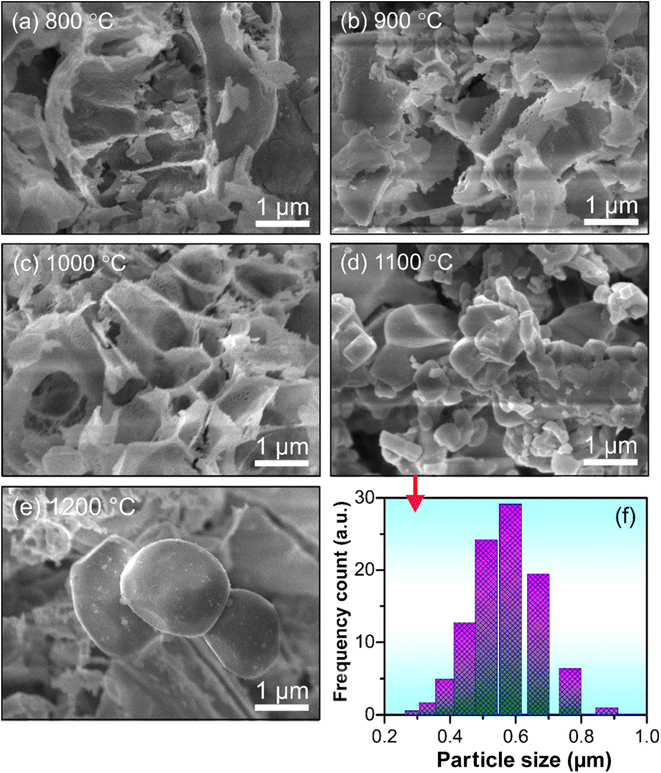
Fig. 2a–e shows the FESEM images of GdYGd:20 mol% Eu3+ phosphor annealed at different temperatures in the range of 800–1200 °C for 5 h. It was observed that the particle size of the samples tended to increase gradually with an increase in annealing temperature. This could be explained by the agglomeration of small clusters forming larger particles at high temperatures.26 As shown in Fig. 2d and f, the FESEM image and the size variation of GdYGd:20 mol% Eu3+ phosphor annealed at 1100 °C confirmed that the average size of particles is about 0.6 μm. The largest particle size of 2 μm is obtained at 1200 °C.Fig. 3 shows the XRD patterns of GdYGd:20 mol% Eu3+ phosphors annealed in the air for 5 h at 600–1200 °C. Only low-intensity diffraction peaks could be observed in the XRD patterns of samples annealed at low temperatures of 600–700 °C, indicating a low crystalline quality of obtained samples. At 800 °C, multiple sharp peaks are obtained at 2θ = 21.5°, 26.5°, 28.5°, 30.4°, 31.9°, 33.5°, 34.4°, 36.2°, 43.2°, 45.8°, 48.7°, 51.2°, and 54.2°, corresponding to the coexistence of three different phases, including monoclinic Gd(BO2)3 (JCPDS no. 23-0986),27 monoclinic Y3BO6 (JCPDS no. 34-0291)6 and hexagonal GdBO3 structures (JCPDS no. 13-0483).28 It is noteworthy that the peak intensity generally increases with an increase in the temperature from 800 to 1100 °C and then slightly decreases at 1200 °C, implying that Gd(BO2)3, Y3BO6, and GdBO3 phases started forming at 800 °C and reached the best crystalline quality at 1100 °C. It should also be noted that there is a modest shift toward lower angles with an increase in temperature from 800 to 1100 °C, probably relating to the substitution of the larger-radius ion (Eu3+: 0.95 Å) for the smaller one (Y3+: 0.88 Å) in the host lattice.29,30 The shift towards a higher angle at 1200 °C could possibly be related to the replacement of larger-sized Gd3+ ions (1.25 Å)27 by smaller-radius-size Eu3+ ions.3,16
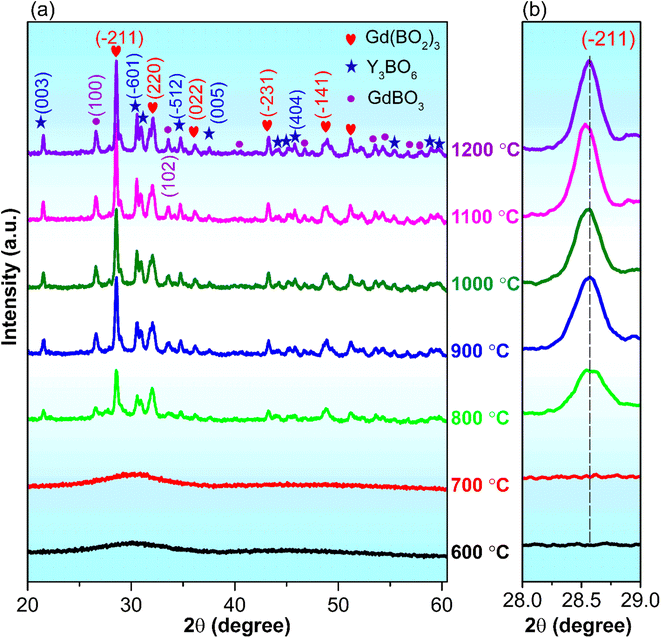 | ||
| Fig. 3 (a) XRD patterns of GdYGd:20 mol% Eu3+ phosphors annealed in air at the temperature range of 600–1200 °C for 5 h and (b) in-focused XRD pattern of the (−211) plane. | ||
Fig. 4a and b illustrate the XRD patterns and in-focused XRD pattern at the (−211) plane of GdYGd:x mol% Eu3+ (x = 1–35) phosphors annealed at 1100 °C for 5 h, respectively. As shown in Fig. 4a, all XRD patterns exhibit a similar shape, indicating a slight influence of Eu3+ ion concentration on the crystalline structure of GdYGd:Eu3+ phosphors. Fig. 4b reveals a fluctuation of peak position at the dopant level of 1–23 mol% and a shift towards a larger 2θ angle with a further increase in Eu3+ ion concentration. Although Eu3+ ions could replace Y3+ or/and Gd3+ ions in the host lattice,3,6,11 they are preferentially substituted by Y3+ ions owing to a slight difference in radius between Eu3+ and Y3+ ions.29,30 Hence, the negligible variation in the (−211) peak at Eu3+ doping concentrations of 1–23 mol% could be explained well by substituting Eu3+ with Y3+ ions. In contrast, the right shift at the higher Eu3+ doping content (>23 mol%) implies the dominance of the substitution of Eu3+ ions for Gd3+ ions when the saturated replacement of Eu3+ for Y3+ ions is reached in the host lattice.11,31
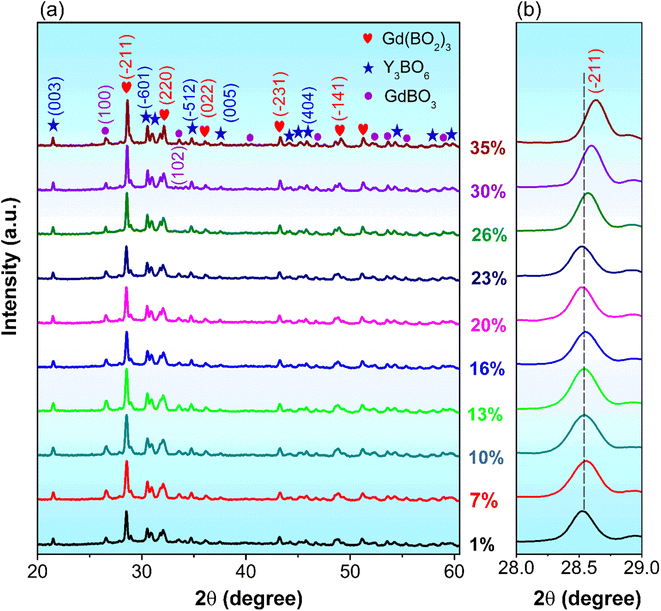 | ||
| Fig. 4 (a) XRD patterns of Gd(BO2)3-Y3BO6-GdBO3:x mol% Eu3+ (x = 1–35) phosphors annealed at 1100 °C for 5 h and (b) in-focused XRD pattern of the (−211) plane. | ||
3.2. Photoluminescence study
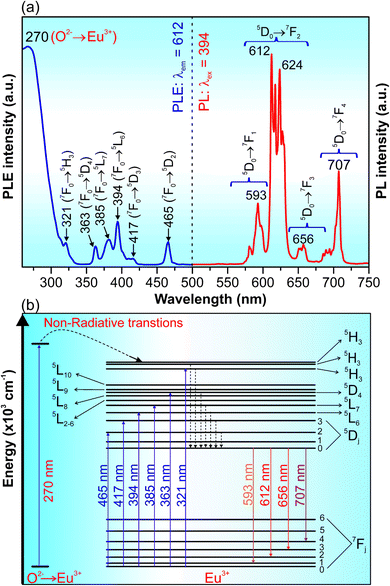
Fig. 5a presents the PLE and PL spectra of GdYGd:20 mol% Eu3+ phosphor annealed at 1100 °C for 5 h. The PLE spectrum monitored at 612 nm shows a strong broad absorption band peaking at 270 nm and lower-intensity peaks at 321, 363, 385, 394, 417 and 465 nm. It has been previously reported that the strong and broad peak at around 270 nm is due to the Eu3+–O2+ transition in the host lattice.8 The peaks at 321, 363, 385, 394, 417 and 465 nm correspond to the 7F0 → 5H3, 7F0 → 5D4, 7F0 → 5L7, 7F0 → 5L6, 7F0 → 5D3 and 7F0 → 5D2 transitions of Eu3+ ions,32–37 respectively. The PL spectrum excited at 394 nm shows multiple emissions in the red-light region at 593, 612, 617, 624, 627, 656, and 707 nm, attributing to the 5D0–7Fj (j = 1, 2, 3, 4) transitions of Eu3+ ions.6,34,38–47 Briefly, the peak at 593 nm is due to the 5D0–7F1 transition; the emission peaks at 612–627 nm and 656 nm originated from the 5D0–7F2 and 5D0–7F3 transitions, respectively. The peak at 707 nm is due to the 5D0–7F4 transition of Eu3+ ions. A diagram of the energy levels for the excitation and emission transitions of Eu3+ ions in GdYGd lattices is illustrated in Fig. 5b.The 3D emission and excitation spectrum and PL spectra under the excitation of different wavelengths of GdYGd:20 mol% Eu3+ phosphors annealed at 1100 °C for 5 h are illustrated in Fig. 6a and b, respectively. The 3D emission and excitation spectrum in Fig. 6a demonstrate that the as-synthesized phosphor has three absorption regions at (i) 280–330 nm; (ii) 355–425 nm with the highest intensity peak at 394 nm; and (iii) 450–470 nm with the most substantial peak at 465 nm. As shown in Fig. 6b, the intensity of the PL spectrum excited at 394 nm is the highest compared to the PL spectra excited at 270, 321, 363, 385, and 465 nm, which confirms the most suitable excitation wavelength at 394 nm. Several other emissions could also be observed in the red-light region, in the range of 590–710 nm.
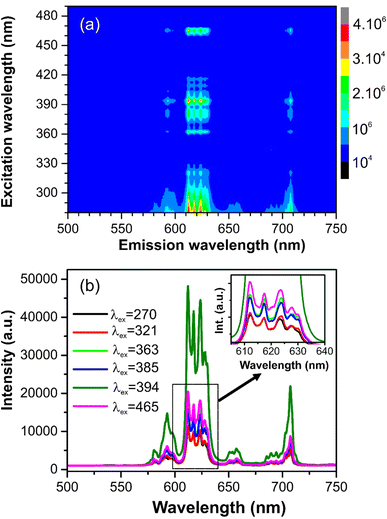 | ||
| Fig. 6 (a) 3D emission–excitation spectrum and (b) PL spectra excited at 270, 321, 363, 385, 394, and 465 nm of the GdYGd:20 mol% Eu3+ phosphors annealed in the air at 1100 °C for 5 h. | ||
Fig. 7 displays the PL spectra of GdYGd:20 mol% Eu3+ phosphors annealed at 700–1200 °C for 5 h. While no emission could be observed at 700 °C, multiple emission peaks are observed in the PL spectra of the phosphors annealed at 800–1200 °C. This observation is well explained by the better crystalline structure of the higher-temperature-annealed phosphors, as shown in Fig. 3. It is also noted that all PL spectra of samples annealed at 800–1200 °C show an indistinguishable shape; however, there is a strong relationship between the PL intensity and the synthesized temperature. As illustrated in the inset of Fig. 7, the 612 nm peak intensity first increases with the temperature in the range of 800–1100 °C, reaching the highest value at 1100 °C, and then decreases with the higher temperature of 1200 °C. The improvement in the PL intensity at 800–1100 °C could be associated with more efficient diffusion of Eu3+ ions into the GdYGd host lattice or/and a significant improvement in the quality of GdYGd crystalline phases at elevated temperatures.8 The lower PL intensity at 1200 °C could be explained by the reduction in the crystalline quality of the GdYGd phases, as previously shown in the XRD patterns.
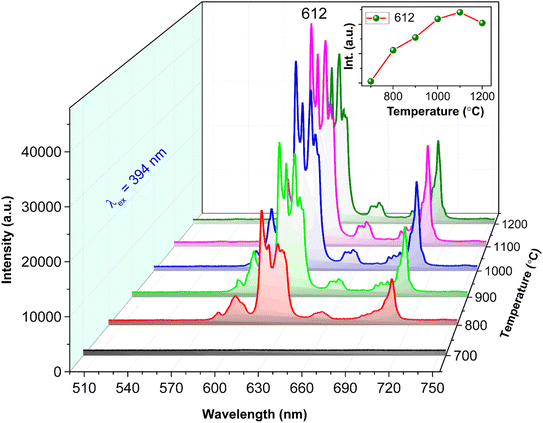 | ||
| Fig. 7 PL spectra excited by the 394 nm wavelength of GdYGd:20 mol% Eu3+ phosphors annealed in the air at 600–1200 °C for 5 h. | ||
Fig. 8 illustrates the PL spectra of GdYGd:x mol% Eu3+ (x = 1–35%) phosphors synthesized at 1100 °C in air for 5 h, showing a significant influence of Eu3+ dopant concentrations on the PL intensity. The inset of Fig. 8 establishes the change in the 612 nm peak intensity with the Eu3+ doping concentration. It is evident that the PL intensity gradually increases with the dopant Eu3+ concentration in the range of 1–20 mol%, which is explained by an increase in the luminescent centers.8 Then, it decreases with higher concentrations from 20 to 35 mol% Eu3+, possibly relating to the quenching effect of concentration.48 The most intense PL intensity is obtained at 20 mol%, indicating that the distance between neighbor Eu3+ ions reached its critical distance threshold, Rc.8,11,48 In this case, the Rc value of 7.02 Å can be determined using the Blasse equation, which is higher than the critical value of 5 Å for exchanging energy by interaction, implying the governance of the multipolar interaction for the quenching mechanism.8,16 It is well known that multipolar interaction often contains three types that correspond to the value of the characteristic function for multipolar interaction types: dipole–dipole, dipole–quadrupole, and quadrupole–quadrupole interactions.49 In this study, the dipole–quadrupole interaction majorly governs the multipolar interaction of Eu3+ ions in the GdYGd host lattice. Similar results have also been reported in our previous study.8
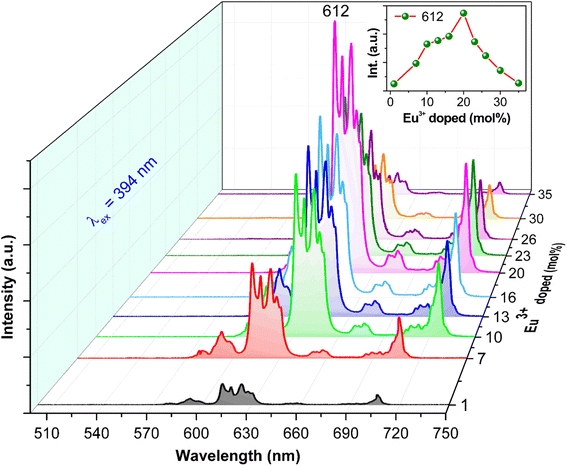 | ||
| Fig. 8 PL spectra excited at 394 nm of GdYGd:x mol% Eu3+ (x = 1–35) phosphors annealed at 1100 °C for 5 h. The inset shows the 612 nm peak intensity dependence on Eu3+ concentrations. | ||
Fig. 9a and b show the PLE spectra monitored at 612 nm and the time-resolved decay spectra using the excitation wavelength of 394 nm for GdYGd:x mol% Eu3+ (x = 7–30) samples, respectively. Although all the PLE spectra shown in Fig. 9a present a unique shape with three main absorption regions at 260–330 nm, 355–425 nm, and 450–470 nm, the PLE intensity strongly depends on the doping concentrations. It first increases as the dopant concentrations increase from 7 to 20 mol% and then decreases with higher concentrations of 23 and 30 mol%. The highest PLE intensity is reached at 20 mol%, as demonstrated in the inset of Fig. 9a. As described in our previous study, PL decay curves can be fitted using a double-exponential function.50 As shown in Fig. 9b, the fitted lifetime values of Eu3+-doped GdYGd phosphors are in the order of milliseconds, which is consistent with the values reported in recent studies.51,52 It is noteworthy that there is a slight decrease in the lifetime from 1.18 to 1.12 ms with an increase in Eu3+ doping concentration from 7 to 30 mol%, highly contributing to the quenching effect by concentration.51 This means that the highest PL intensity could be obtained at a doping concentration of 20 mol%.
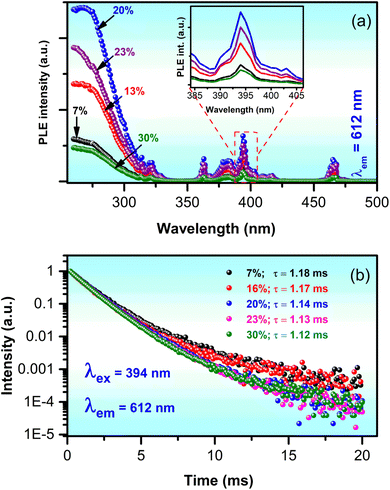 | ||
| Fig. 9 (a) PLE spectra mentioned at 612 nm and (b) lifetime curves of GdYGd:x mol% Eu3+ (x = 7–30) phosphors. | ||
3.3. Color purity, thermal stability, and quantum efficiency (QE)
It is well known that the chromaticity coordinates (x,y), color purity, and thermal stability of phosphors are important factors for LED applications.11 The calculated (x,y) values of all the samples are displayed in Fig. 10, beyond the red-light region of the CIE diagram. In addition, the color purity can be calculated from the CIE coordinates.53 Table 1 presents the (x,y) values of all the samples under an excitation wavelength of 394 nm. It is noteworthy that the GdYGd:x mol% Eu3+ (x = 1–35) phosphors possess excellent color purities (higher than 99% at all the Eu3+ doping concentrations), which is superior to those of K2SrGe8O18: Eu3+ (95.5%),54 Na2Gd(PO4)(MoO4):Eu3+ (92%),55 and Ca3Y2−xB4O12:xEu3+ (88.57%).14 Hence, these results indicate that GdYGd:Eu3+ phosphor is a great candidate for high color-purity LEDs.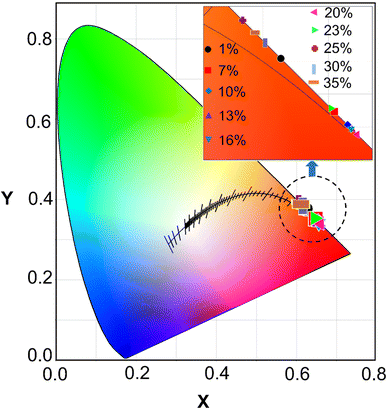 | ||
| Fig. 10 CIE coordinates of GdYGd:Eu3+ phosphors doped with different concentrations in the range of 1–35 mol%. | ||
| Eu3+ doping level (%) | Chromatic coordinates (x,y) | Color purity (%) |
|---|---|---|
| 1 | (0.6233,0.3762) | 99.1 |
| 7 | (0.6477,0.3520) | 99.3 |
| 10 | (0.6537,0.3460) | 99.2 |
| 13 | (0.6557,0.3440) | 99.5 |
| 16 | (0.6553,0.3444) | 99.4 |
| 20 | (0.6581,0.3416) | 99.5 |
| 23 | (0.6462,0.3535) | 99.3 |
| 26 | (0.6059,0.3936) | 99.4 |
| 30 | (0.6161,0.3834) | 99.1 |
| 35 | (0.6115,0.3880) | 99.3 |
Fig. 11a illustrates the relationship between the optimized GdYGd:Eu3+ phosphor emission spectra and the measured temperature. It can be observed that all PL spectra in Fig. 11a present a similar shape; however, the PL intensity gradually decreases with the annealing temperature in the range of 25–200 °C, as illustrated in Fig. 11b. At 150 °C, the PL intensity remains 52.8% that of the initial PL intensity at room temperature. The activation energy (ΔE) of phosphors can be derived from the temperature-dependence spectra using the Arrhenius equation, as reported in our recent study.8 The dependence of the  on 1/kT is illustrated in the inset of Fig. 11b, showing a slope of −0.319 by linear fitting. Thus, the activation energy of the GdYGd:20 mol% Eu3+ phosphor is 0.319 eV. This obtained value is significantly better than some reported values for commercial phosphors, such as Y2O3:Eu3+ red phosphor (0.17–0.24 eV),56,57 Sr3YBO3:0.9Eu3+ (0.137 eV),3 and Sr9LiMg(PO4)7:Eu3+ (0.160 eV).58
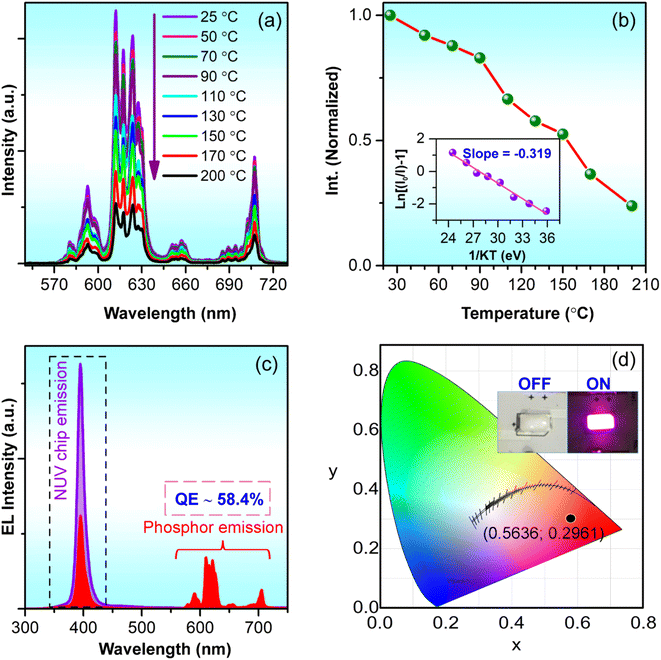 | ||
| Fig. 11 (a) Temperature-dependent PL spectra of GdYGd:20 mol% Eu3+ phosphor and (b) the change in the normalized PL intensities based on the measured temperature. The inset in Fig. 10b shows the linear relationship between ln[(I0/I) − 1] and 1/kT. (c) EL spectra of the NUV chip (non-coated) and the GdYGd:20 mol% Eu3+-coated NUV chip and (d) the CIE chromatic coordinates (x,y) of the red LED prototype. The inset in Fig. 10d shows a digital image of the red LED prototype at the OFF- and ON-mode states. | ||
To demonstrate the application ability of the resultant phosphor, a prototype of a red-emitting LED was fabricated by coating the optimized GdYGd:20 mol% Eu3+ phosphor on the top surface of a 395 nm LED chip. Fig. 11c illustrates the EL spectra of the NUV LED chip (non-coated) and GdYGd:20 mol% Eu3+-coated NUV LED. Additionally, a sharp emission peak at 395 nm from the NUV chip and red emissions in the 580–710 nm wavelength region is obvious in the EL spectrum of the GdYGd:Eu3+-coated LED prototype. The quantum efficiency (QE) of GdYGd:20 mol% Eu3+ phosphor can be estimated using the following eqn (1):59,60
 | (1) |
Table 2 compares the QE values of some reported red-emitting phosphors and the optimized GdYGd:20 mol% Eu3+ phosphor in this study. The high QE value of 58.4% of the GdYGd:20 mol% Eu3+ phosphor indicates a potential application of this phosphor in NUV-pumped WLED. It is noteworthy that this value is much higher than the QE value of GdBO3:Eu3+ phosphor (14.30%).18 Fig. 11d illustrates the CIE chromatic coordinates (x = 0.5636,y = 0.2961) of the fabricated red LED. The inset presents the digital image of the red LED prototype in the OFF- and ON-mode states, demonstrating the strong red light emitted from this prototype.
| Phosphors | Excitation wavelength (nm) | Emission wavelength (nm) | QE (%) | Ref. |
|---|---|---|---|---|
| AlPO4:3% Eu3+ | 395 | 594 | 38.7 | 8 |
| K4BaSi3O9:0.05Eu3+ | 395 | 617 | 27 | 62 |
| LiCaBO3:0.5% Eu3+ | 393 | 611 | 40 | 63 |
| CaB4O7:0.5% Eu3+ | 393 | 611 | 48 | 63 |
| Na3Sc2(PO4)3:0.35Eu3+ | 394 | 621 | 49 | 64 |
| KSGO:0.08Eu3+ | 394 | 617 | 57.6 | 54 |
| Ca8MgLu(PO4)7:Eu3+ | 394 | 612 | 69 | 65 |
| Ba3Y4O9:Eu3+ | 396 | 614 | 46 | 66 |
| YBO3:0.05Eu3+ | 394 | 591 | 44.59 | 67 |
| Sr2InTaO6:Eu3+ | 396 | 624 | 58.4 | 68 |
| La2W2O9:Eu3+ | 395 | 618 | 77 | 69 |
| GdBO3:Eu3+ | 391 | 591 | 14.3 | 18 |
| Gd(BO2)3:Eu3+ | 396 | 588 | — | 20 |
| Y3BO6:Eu3+ | 394 | 613 | — | 22 |
| GdYGd:20% Eu3+ | 395 | 612 | 58.4 | This study |
4. Conclusion
A novel red-emitting Eu3+-heavily doped Gd(BO2)3-Y3BO6-GdBO3 phosphor well excited at 394 nm was successfully synthesized by applying a simple sol–gel method. Among the samples, the highest photoluminescence (PL) intensity is achieved when doped with a high concentration of 20 mol% Eu3+ and annealed at 1100 °C in an air atmosphere for 5 hours. The optimized phosphor shows excellent color purity of 99.5%, a high activation energy of 0.319 eV, and an impressive quantum efficiency of 58.4%. To demonstrate the practical application of this phosphor, a red LED prototype was successfully fabricated using the GdYGd:20 mol% Eu3+ phosphor, resulting in chromatic coordinates of (x = 0.5636,y = 0.2961). These results unequivocally demonstrate that the prepared Gd(BO2)3-Y3BO6-GdBO3:20 mol% Eu3+ phosphor holds significant promise as an efficient candidate for phosphor materials in NUV-pumped WLED applications.Conflicts of interest
There are no conflicts to declare.Acknowledgements
This research is funded by the Vietnam National Foundation for Science and Technology Development (NAFOSTED) under grant number 103.03-2019.45.References
- T. Yaba, R. Wangkhem and N. S. Singh, J. Alloys Compd., 2020, 843, 156022 CrossRef CAS.
- G. Li, Y. Tian, Y. Zhao and J. Lin, Chem. Soc. Rev., 2015, 44, 8688–8713 RSC.
- Z. Sun, Z. Zhu, J. Luo, Z. chao Wu, L. Zhou and X. Zhang, Ceram. Int., 2019, 45, 22517–22522 CrossRef.
- Y. Jia, D. Xu, X. Yun, C. Wei, J. Zhou, J. Sun, S. Nay, P. O. F. Ce, Y. Jia, D. Xu, X. Yun, C. Wei, J. Zhou and J. Sun, Optik, 2020, 216, 164895 CrossRef CAS.
- J. Li, Q. Liang, Y. Cao, J. Yan, J. Zhou, Y. Xu, L. Dolgov, Y. Meng, J. Shi and M. Wu, ACS Appl. Mater. Interfaces, 2018, 10, 41479–41486 CrossRef CAS PubMed.
- A. Lakshmanan, R. S. Bhaskar, P. C. Thomas, R. S. Kumar, V. S. Kumar and M. T. Jose, Mater. Lett., 2010, 64, 1809–1812 CrossRef CAS.
- X. Huang, Nat. Photonics, 2014, 8, 748–749 CrossRef CAS.
- M. T. Tran, N. Tu, N. V. Quang, N. D. Hung, L. T. H. H. Thu, D. Q. Trung and P. T. Huy, J. Alloys Compd., 2020, 853, 156941 CrossRef.
- P. Pust, V. Weiler, C. Hecht, A. Tücks, A. S. Wochnik, A.-K. Henß, D. Wiechert, C. Scheu, P. J. Schmidt and W. Schnick, Nat. Mater., 2014, 13, 891–896 CrossRef CAS PubMed.
- Y. Zheng, H. Zhang, H. Zhang, Z. Xia, Y. Liu, M. S. Molokeev and B. Lei, J. Mater. Chem. C, 2018, 6, 4217–4224 RSC.
- L. T. Ha Thu, N. Tu, D. Duc Anh, D. Q. Trung, M. Trung Tran, T. T. Quynh Nhu, N. Thi Huyen, N. Van Quang, N. Duy Hung, D. Xuan Viet, N. D. Trung Kien and P. Thanh Huy, ChemistrySelect, 2021, 6, 937–944 CrossRef CAS.
- H. Lin, D. Yang, G. Liu, T. Ma, B. Zhai, Q. An, J. Yu, X. Wang, X. Liu and E. Yue-Bun Pun, J. Lumin., 2005, 113, 121–128 CrossRef CAS.
- S. Neeraj, N. Kijima and A. K. Cheetham, Chem. Phys. Lett., 2004, 387, 2–6 CrossRef CAS.
- G. H. Li, N. Yang, J. Zhang, J. Y. Si, Z. L. Wang, G. M. Cai and X. J. Wang, Inorg. Chem., 2020, 59, 3894–3904 CrossRef CAS PubMed.
- P. Dang, G. Li, X. Yun, Q. Zhang, D. Liu, H. Lian, M. Shang and J. Lin, Light: Sci. Appl., 2021, 10, 1–13 CrossRef PubMed.
- X. Zhang, L. Zhou and M. Gong, Opt. Mater., 2013, 35, 993–997 CrossRef.
- A. Szczeszak, T. Grzyb, S. Lis and R. J. Wiglusz, J. Chem. Soc., Dalton Trans., 2012, 41, 5824–5831 RSC.
- Z. Leng, N. Zhang, Y. Liu, L. Li and S. Gan, Appl. Surf. Sci., 2015, 330, 270–279 CrossRef CAS.
- Z. Leng, Y. Liu, N. Zhang, L. Li and S. Gan, Colloids Surf., A, 2015, 472, 109–116 CrossRef CAS.
- F. Meng, X. Zhang, W. Li, T. Xie and H. J. Seo, J. Phys. Chem. Solids, 2012, 73, 564–567 CrossRef CAS.
- D. Boyer, G. Bertrand-Chadeyron, R. Mahiou, A. Brioude and J. Mugnier, Opt. Mater., 2003, 24, 35–41 CrossRef CAS.
- Q. Zhu, Z. Fan, S. Wang, J. Xiahou and J. G. Li, J. Am. Ceram. Soc., 2019, 102, 7448–7461 CrossRef CAS.
- L. Sun, Y. Liu, B. Wang and S. Yang, J. Alloys Compd., 2022, 899, 163209 CrossRef CAS.
- N. Siraj, B. El-zahab, S. Hamdan, T. E. Karam, L. H. Haber, M. Li, O. Fakayode, S. Das, B. Valle, R. M. Strongin, G. Patonay, H. O. Sintim, G. A. Baker, A. Powe, M. Lowry, J. O. Karolin, C. D. Geddes and I. M. Warner, Anal. Chem., 2016, 88, 170–202 CrossRef CAS PubMed.
- N. T. Huyen, N. Tu, N. V. Quang, D. Quang Trung, M. T. Tran, N. V. Du, N. D. Hung, D. X. Viet, N. D. Trung Kien and P. T. Huy, ACS Appl. Electron. Mater., 2021, 4, 4322–4331 CrossRef.
- N. Van Quang, N. Thi Huyen, N. Tu, D. Quang Trung, D. Duc Anh, M. T. Tran, N. D. Hung, D. X. Viet and P. T. Huy, Dalton Trans., 2021, 50, 12570–12582 RSC.
- X. Zhang, F. Meng, W. Li, S. Il Kim, Y. M. Yu and H. J. Seo, J. Alloys Compd., 2013, 578, 72–76 CrossRef CAS.
- L. Yang, L. Zhou, Y. Huang and Z. Tang, Mater. Lett., 2010, 64, 2704–2706 CrossRef CAS.
- H. Forest and G. Ban, J. Electrochem. Soc., 1971, 118, 1999 CrossRef CAS.
- G. Jyothi and K. G. Gopchandran, Dyes Pigm., 2018, 149, 531–542 CrossRef CAS.
- J. Dalal, M. Dalal, S. Devi, R. Devi, A. Hooda, A. Khatkar, V. Taxak and S. Khatkar, J. Lumin., 2019, 210, 293–302 CrossRef CAS.
- Z. Wei, L. Sun, C. Liao, J. Yin, X. Jiang, C. Yan and S. Lü, J. Phys. Chem. B, 2002, 106, 10610–10617 CrossRef CAS.
- Z. Wei, L. Sun, C. Liao, C. Yan and S. Huang, Appl. Phys. Lett., 2002, 80, 1447–1449 CrossRef CAS.
- L. Jia, Z. Shao, Q. Lü, Y. Tian and J. Han, Ceram. Int., 2014, 40, 739–743 CrossRef CAS.
- N. T. K. Lien, N. V. Thang, N. D. Hung, N. D. Cuong, N. D. T. Kien, C. X. Thang, P. H. Vuong, D. X. Viet, N. T. Khoi and P. T. Huy, J. Electron. Mater., 2017, 46, 3427–3432 CrossRef CAS.
- B. Fan, J. Liu, W. Zhou and L. Han, Opt. Mater., 2019, 98, 109499 CrossRef CAS.
- G. Z. Li, M. Yu, Z. L. Wang, J. Lin, R. S. Wang and J. Fang, J. Nanosci. Nanotechnol., 2006, 6, 1416–1422 CrossRef CAS PubMed.
- J. Li, Y. Wang and B. Liu, J. Lumin., 2010, 130, 981–985 CrossRef CAS.
- S. H. Shin, J. H. Kang, D. Y. Jeon, S. H. Choi, S. H. Lee, Y. C. You and D. S. Zang, Solid State Commun., 2005, 135, 30–33 CrossRef CAS.
- X. Cui, W. Zhuang, Z. Yu, T. Xia, X. Huang and H. Li, J. Alloys Compd., 2008, 451, 280–285 CrossRef CAS.
- H. Song, H. Q. Yu, G. Pan, X. Bai, B. Dong, X. T. Zhang and S. K. Hark, Chem. Mater., 2008, 20, 4762–4767 CrossRef CAS.
- Y. F. Liu, Z. P. Yang and Q. M. Yu, J. Alloys Compd., 2011, 509, L199–L202 CrossRef CAS.
- P. Li, Z. Yang, L. Pang, Z. Wang and Q. Guo, J. Rare Earths, 2008, 26, 44–47 CrossRef.
- C. Xiangzhong, Z. Weidong, Z. Xiying, X. Tian, L. Zhen, Y. Zhijian, Z. Chunlei and H. Xiaowei, J. Rare Earths, 2006, 24, 149–152 CrossRef.
- B. Van Hao, P. T. Huy, T. N. Khiem, N. T. Thanh Ngan, P. H. Duong, N. T. T. Ngan and P. H. Duong, J. Phys.: Conf. Ser., 2009, 187, 2009 Search PubMed.
- N. J. Shivaramu, E. Coetsee and H. C. Swart, AIP Conf. Proc., 2018, 1953, 1–5 CrossRef.
- D. Kim, S. Yoon, C. Park, J. Park, B. Kim and B. Lee, In SID Symposium Digest of Technical Papers, 2001, vol. 32, pp. 742–745 Search PubMed.
- M. Seraiche, L. Guerbous, R. Mahiou and A. Potdevin, Opt. Mater., 2020, 109, 110339 CrossRef CAS.
- L. Shi, J. Li, Y. Han, W. Li and Z. Zhang, J. Lumin., 2019, 208, 201–207 CrossRef CAS.
- M. T. Tran, D. Q. Trung, N. Tu, D. D. Anh, L. T. H. Thu, N. Van Du, N. Van Quang, N. T. Huyen, N. D. T. Kien, D. X. Viet, N. D. Hung and P. T. Huy, J. Alloys Compd., 2021, 884, 161077 CrossRef CAS.
- A. Szczeszak, T. Grzyb, B. Barszcz, V. Nagirnyi, A. Kotlov and S. Lis, Inorg. Chem., 2013, 52, 4934–4940 CrossRef CAS PubMed.
- W. Pan, P. Wang, Y. Xu and R. Liu, Thin Solid Films, 2015, 578, 69–75 CrossRef CAS.
- N. Van Quang, N. Thi Huyen, D. Quang Trung, D. Duc Anh, M. T. Tran, H. D. Nguyen, D. X. Viet and P. T. Huy, Dalton Trans., 2021, 50, 12570–12582 RSC.
- Q. Zhang, X. Wang and Y. Wang, Inorg. Chem. Front., 2020, 7, 1034–1045 RSC.
- X. Huang, H. Guo and B. Li, J. Alloys Compd., 2017, 720, 29–38 CrossRef CAS.
- M. Fhoula and M. Dammak, J. Lumin., 2020, 223, 117193 CrossRef CAS.
- S. Som, S. Das, S. Dutta, H. G. Visser, M. K. Pandey, P. Kumar, R. K. Dubey and S. K. Sharma, RSC Adv., 2015, 5, 70887–70898 RSC.
- J. Luo, Z. Sun, Z. Zhu, X. Zhang, Z. Wu and F. Mo, Ceram. Int., 2020, 46, 11994–12000 CrossRef CAS.
- Y. Han, L. Shi, H. Liu and Z. Zhang, Optik, 2019, 195, 162014 CrossRef CAS.
- D. Q. Trung, N. V. Quang, M. T. Tran, N. V. Du, N. Tu, N. D. Hung, D. X. Viet, D. D. Anh and P. T. Huy, Dalton Trans., 2021, 50, 9037–9050 RSC.
- D. Q. Trung, N. Tu, N. V. Quang, M. T. Tran, N. V. Du, P. T. Huy, N. Tu, N. V. Quang, M. T. Tran, N. V. Du and P. T. Huy, J. Alloys Compd., 2020, 845, 156326 CrossRef CAS.
- D. Stefańska, M. Stefański and P. J. Dereń, Opt. Mater., 2014, 37, 410–413 CrossRef.
- I. I. Kindrat and B. V. Padlyak, Opt. Mater., 2018, 77, 93–103 CrossRef CAS.
- H. Guo, X. Huang and Y. Zeng, J. Alloys Compd., 2018, 741, 300–306 CrossRef CAS.
- F. Xie, Z. Dong, D. Wen, J. Yan, J. Shi, J. Shi and M. Wu, Ceram. Int., 2015, 41, 9610–9614 CrossRef CAS.
- J. Liang, L. Sun, G. Annadurai, B. Devakumar, S. Wang, Q. Sun, J. Qiao, H. Guo, B. Li and X. Huang, RSC Adv., 2018, 8, 32111–32118 RSC.
- B. Liu, X. Xiao, J. Yu, D. Mao and G. Lu, RSC Adv., 2016, 6, 69442–69453 RSC.
- J. Zhao, H. Gao, H. Xu, Z. Zhao, H. Bu, X. Cao, L. He, Z. Yang and J. Sun, RSC Adv., 2021, 11, 8282–8289 RSC.
- Q. Cheng, F. Ren, Q. Lin, H. Tong and X. Miao, J. Alloys Compd., 2019, 772, 905–911 CrossRef CAS.
| This journal is © The Royal Society of Chemistry 2023 |

