 Open Access Article
A nanoscale electrochemical guanine DNA-biosensor based on a flower-like nanocomposite of Tb-doped ZnO for the sensitive determination of pemetrexed
Mahmoud Abbasia,
Shohreh Jahani *b,
Saeed Biroudianc,
Mohammadesmaeil Aramesh Boroujenid,
Fatemeh Maghfourye,
Mohammad Amini-Zadehe,
Leila Malekyanf,
Hamid Reza Faramarzpoorg and
Mohammad Mehdi Foroughi
 h
h
aMedical Ethics and Law Research Center, Shahid Beheshti University of Medical Sciences, Tehran, Iran. E-mail: shohre_jahani@yahoo.com; Tel: +98 34331321750
bNoncommunicable Diseases Research Center, Bam University of Medical Sciences, Bam, Iran
cDepartment of Medical Ethics, Medical School, Iran University of Medical Sciences, Tehran, Iran
dCardiology Department, Shahrekord University of Medical Sciences, Shahrekord, Iran
eKerman University of Medical Sciences, Kerman, Iran
fDepartment of Nursing, School of Nursing and Midwifery, Bam University of Medical Sciences, Bam, Iran
gDepartment of Education, Narmanshir, Iran
hDepartment of Chemistry, Kerman Branch, Islamic Azad University, Kerman, Iran
First published on 9th October 2023
Abstract
Pemetrexed is an antineoplastic drug used in chemotherapeutic treatments, especially in malignant mesothelioma and non-small cell lung carcinoma, but can also cause a variety of complications, like stomach pain, nausea, burning, vomiting, numbness, and tingling, emphasizing the need for an approach to quantify the drug in biological matrices. Herein, a DNA-based biosensor was introduced for pemetrexed determination. A hydrothermal approach was used for synthesizing flower-like nanoparticles (NPs) of zinc oxide (ZnO) doped with Tb (FL-NP Tb3+/ZnO). Moreover, energy dispersive X-ray (EDX), field-emission scanning electron microscopy (FESEM), zeta potential, Brunauer–Emmett–Teller (BET), and X-ray diffraction (XRD) analyses were used for characterizing the as-prepared nanocomposite. According to the impedance analysis, FL-NP Tb3+/ZnO was accompanied by very good electrochemical functions for a simple transfer of electrons. In the case of the immobilization of double-stranded deoxyribonucleic acid (ds-DNA) on the FL-NP Tb3+/ZnO and polypyrrole (PP)-modified pencil graphite electrode (ds-DNA/PP/FL-NP Tb3+/ZnO/PGE), a considerable enhancement was found in the electrochemical oxidation of guanine in ds-DNA residue bases. Since there was an interaction between ds-DNA and pemetrexed, the voltammetric current of guanine over the ds-DNA/PP/FL-NP Tb3+/ZnO/PGE declined in the presence of pemetrexed in the electrolytic solution. Moreover, under optimum conditions (25 mg L−1 of ds-DNA and 10 min incubation time, in acetate buffer at 25 °C), a linear decrease in the guanine signal was observed on the ds-DNA/PP/FL-NP Tb3+/ZnO/PGE as the pemetrexed concentration increased in the range from 0.001 μM to 175.0 μM with a limit of detection of 0.17 nM. Finally, the new DNA-based biosensor was successfully used for determining pemetrexed in real samples, indicating its application potential.
1. Introduction
Pemetrexed (PTX) (formula: N-[4-[2-(2-amino-4,7-dihydro-4-oxo-1H-pyrrolo[2,3-d]pyrimidin-5-yl)ethyl]benzoyl]-L-glutamic acid) was first introduced under the brand name “Alimta” as a chemotherapy as well as multipurpose antifolate drug. Pemetrexed is also used in combination with other chemotherapy medications as a first-line treatment for a certain type of non-small cell lung cancer (NSCLC) that has spread to nearby tissues or to other parts of the body. Pemetrexed injection is also used alone to treat NSCLC as an ongoing treatment in people who have already received certain chemotherapy medications and whose cancer has not worsened and in people who could not be treated successfully with other chemotherapy medications. Pemetrexed injection is also used in combination with other chemotherapy medication as a first-line treatment for malignant pleural mesothelioma (a type of cancer that affects the inside lining of the chest cavity) in people who cannot be treated with surgery. Pemetrexed is listed in a class of medications called antifolate antineoplastic agents. It works by blocking the action of a certain substance in the body that may help cancer cells multiply.1,2 Studies have also confirmed the involvement of pemetrexed in restraining multiple enzymes from synthesizing purine and pyrimidine.3 According to a study, pemetrexed majorly contributes to the inhibition of three main enzymes: glycinamide ribonucleotide formyl transferase, thymidylate synthase, and dihydrofolate reductase.4 It was also found that pemetrexed is responsible for preventing RNA and DNA formation via the inhibition of the formation of precursor pyrimidine and purine nucleotides that would be needed for cancer and normal cells to grow and survive.5 Some studies have suggested that an uptake of once every three weeks is the optimum schedule in the course of the clinical development process. Since folate-sensitive enzymes are inhibited by pemetrexed, patients must receive folic acid or a multivitamin mixture with folic acid orally. However, the vitamin supplements have reduced toxicity.6,7 Scholars have also shown the presence of numerous toxins in the course of pemetrexed treatment, including severe leucopenia and neutropenia, in spite of the uptake of some vitamin supplements.8 However, customized dosing would ensure the maximum effectiveness while minimizing the level of toxicity. On the other hand, pharmaco-kinetic information reported in the course of the clinical development process of pemetrexed9 revealed an acceptable association of plasmatic concentrations with toxicity, particularly hematologic concentrations. Researchers have reported on the variability in the inter-patient's pharmaco-kinetics, and thus a sensitive approach must be developed for quantifying pemetrexed in patients' plasma.10,11Mass spectroscopy (MS), liquid chromatography-MS (LC-MS), high-performance liquid chromatography (HPLC), as well as HPLC-UV have already been employed to detect pemetrexed, though sensitive, simplified, and inexpensive electrochemical techniques have also been used with pharmaceutical samples.12–18
Recently, in the electrochemical field, research has been performed on bulky electrodes for achieving significant parameters, like reduced sizes, portability, as well as inexpensive production processes, which could greatly miniaturize the size, improve the portability, and reduce the production costs of systems. The aim is for bulky electrode systems to shift to small-sized electrochemical cell configurations.19–23 Some scholars have utilized pencil graphite electrodes (PGEs) to detect diverse samples in numerous sample matrices.24 Nonetheless, utilizing a bare PGE for electrochemical sensor uses would be followed by challenges caused by the poor transferability of electrons and passive properties of the charge transfer. For this reason, modifying the bare electrode with transition metal oxides (TMOs) would be preferred for enhancing the electro-active surface area, conductivity, as well as porosity of the materials.25–29
Since zinc oxide (ZnO) enjoys a higher theoretical specific capacitance (593 F g−1), is an n-type semi-conductor material, nontoxic in nature, and has acceptable electrochemical features, which can vary depending on the (spherical/nonspherical) morphology, composition, and size, it is the most famous compound from among the TMOs that have been investigated to date.30,31
Doping the host lattice with an appropriate element can offer possibilities for modifying its electronic, chemical (activation energy and catalytic action), and morphological (grain size modifications, surface area enhancement) properties, etc.32 Currently, rare earth metals are used as dopants for numerous applications due to their highly conductive, magnetic, electrochemical, and luminescent properties based on the electronic transitions occurring within their 4f energy shells.33 Furthermore, for sensing applications, rare earth elements have proved to be promising candidates for improving the sensing behavior because of their effective catalytic nature, fast ion mobility, and high surface basicity.34 Among the various rare earth elements, terbium (Tb) has been chosen in the present work as a dopant because it induces defects in the wurtzite crystal structure. The increase in active sites in n-type semiconductors favors an enhancement in the sensing response. In addition, doping large atom, like Tb on ZnO, may create Lewis acid regions on the metal oxide sites, which may have a significant effect on electron transfer on the electrodes.35
The molecular docking technique is an attractive system to understand drug–DNA interactions for rational drug design and discovery, and is also used in mechanistic studies, whereby a small molecule can be placed into the binding site of the target specific region of the DNA, mainly in a non-covalent fashion, although covalent bonds may also be formed with a reactive ligand, to predict the correct binding mode and binding affinities.36 Different structural properties of molecules lead to different binding modes; in fact, one of the most important factors governing the binding mode is the molecular shape. Performing interaction studies by molecular docking offers the opportunity to know about the effects of drugs on the DNA structure and about the mechanisms of interaction, which may be useful for designing new drugs. Also, the binding constant is a basic experimental parameter in many clinical studies, such as pharmacokinetic drug interaction studies.37,38
This study is the first electrochemical study of the pemetrexed–double-stranded deoxyribonucleic acid (ds-DNA) interaction on a nanobiosensor using the flower-like nanoparticle Tb3+ZnO (FL-NP Tb3+/ZnO) and polypyrrole (PP). Therefore, we used diverse characterization approaches for a complete examination of the modification features of the electrode made from the above materials. Then, a comparison was made between the voltammetric oxidation signal of guanine prior to and following the interaction by differential pulse voltammetry (DPV) analysis of the unmodified and modified electrodes for investigating the interactions of pemetrexed with ds-DNA. Furthermore, we optimized the experimental conditions, like the initial concentration of ds-DNA, the temperature, and the kind of the buffer on the DNA biosensor response, as well as the incubation time, and verified the DNA–pemetrexed interactions by molecular docking studies.
2. Experimental section
2.1. Materials and instruments
According to the research design, an AUTOLAB (Netherlands) instrument and NOVA 2.1.4 were used for the electrochemical analyses, and all the DP voltammograms were baseline-corrected with the moving average function in the software for further definition of the displayed peaks. Then, DPV was employed with the optimum parameters presented in the literature. The conditions were: modulation amplitude = 0.0505 V, modulation time = 0.05 s, interval time = 0.5 s, and step potential = 0.00795 V. Then, for performing the electrochemical measurements, a three-electrode system, that is, reference electrode (saturated calomel electrode (SCE)), a working electrode (pencil graphite electrode, PGE), and a counter electrode (platinum wire), was utilized. HB pencil lead of 0.5 mm diameter and length of 60 mm was used as a PGE. In the next step, the materials were synthesized in an autoclave in a Teflon-lined vessel and a PARR model stainless-steel reactor. After that, a Bruker AXs XFlash Detector 4010 model applying scanning electron microscopy-energy-dispersive X-ray spectroscopy (SEM-EDX) was used for capturing the surface images of the aforementioned materials. The zeta potential measurements for FL-NP Tb3+/ZnO were conducted at 25 °C using a Zetasizer SZ-100 instrument (Horiba, Instrument Co. Ltd, Kyoto, Japan). Furthermore, we employed a Quantachrome NOVA-2200 model instrument for performing the multi-point Brunauer–Emmett–Teller (BET) analyses. Ultimately, the crystal phase structures of FL-NP Tb3+/ZnO were determined by the X-ray diffraction patterns (XRD, with CuKα radiation, BRUKER).2.2. Reagents
Zinc nitrate (Zn(NO3)·6H2O), terbium chloride (TbCl3·6H2O), polyvinylpyrrolidone (PVP), ethylene glycol (C2H6O2), ds-DNA (calf thymus), sodium acetate trihydrate (C2H9NaO5), ethanol, glacial acetic acid (CH3COOH), and dimethyl sulfoxide (DMSO) were used as the main reagents and were obtained from Sigma-Aldrich Co. Ultrapure water was used for preparing the ds-DNA stock solutions, and each solution was kept at +4 °C for further use. Additionally, we prepared a drug stock solution at 1 × 10⁻³ M with the use of DMSO, which was also stored at +4 °C in the dark.2.3. Preparation of FL-NP Tb3+/ZnO
For obtaining the flower-like NPs of ZnO doped with Tb, different amounts of terbium chloride (0.0, 0.01, 0.05, 0.1, 0.15, and 0.2 g) and 2 g of zinc nitrate and PVP were dissolved in 100 mL ethylene glycol, and the solutions were placed in an autoclave and kept at 200 °C for 12 h with continuous stirring. In the next step, the precipitate was filtered out and washed with ethanol and water three times, followed by calcination of the precipitate at 500 °C for 4 h, before completely drying it at 80 °C for 12 h.2.4. Preparation of the nanobiosensors
In the presence of the supporting electrolyte at pH 4.7 and in the potential range of 0.2–1.6 V (scanning rate = 0.05 V s−1), three cycles of cyclic voltammetry (CV) were employed and the surface of the electrode was electrochemically cleaned. For identifying the impact of the diverse ratios of the electrode modification materials on the oxidation signals as well as for determining the optimal modification composition, we applied varied compositions: 0.1 M pyrrole + 2 mg FL-NP Tb3+/ZnO, 0.2 M pyrrole + 1.0 mg FL-NP Tb3+/ZnO, 0.1 M pyrrole + 1.0 mg FL-NP Tb3+/ZnO, 0.2 M pyrrole + 1.5 mg FL-NP Tb3+/ZnO, 0.1 M pyrrole + 1.5 mg FL-NP Tb3+/ZnO, 0.2 M pyrrole + 2.0 mg FL-NP Tb3+/ZnO, and 0.1 M pyrrole + 2.0 mg FL-NP Tb3+/ZnO. Analysis showed that the composition 2.0 mg FL-NP Tb3+/ZnO + 0.1 M pyrrole was the optimized modification composition, and this was mixed in 25.0 mL phosphate buffer saline (PBS). Finally, this solution was stored in an ultrasonic bath for 2 h for enhancing the materials' dispersion in the solvent. In addition, CV in the potential range 0–0.8 V at a scanning rate of 100 mV s−1 during 30 cycles was performed for electropolymerizing pyrrole on the PGE surface. After drying the activated electrode at room temperature, 5 μL of 25 mg per L ds-DNA solution was added on to the dry clean PGE surface, and the surface of the electrode was then dried at 35 °C. Finally, we immersed the ds-DNA-modified electrode in a supporting electrolyte at pH 4.7 for 5–6 s to remove any unbound ds-DNA from the surface.2.5. Intercalation investigations
The ds-DNA/PP/FL-NP Tb3+/ZnO/PGE was immersed in the different solutions of pemetrexed (which were prepared in Tris–HCl buffer solution at pH 7.4) for investigating the intercalation reaction of pemetrexed with the ds-DNA guanine base and then stirred each solution for 15 min. In the next step, distilled water was used for washing the ds-DNA/PP/FL-NP Tb3+/ZnO/PGE, and the sensor's differential pulse voltammograms (DPVs) were registered in acetate solution (0.5 M, pH 4.8).2.6. Analysis of real samples
Pemetrexed injection (500.0 mg mL−1) as one of the real samples was purchased from a local pharmacy. This was first diluted in Tris–HCl buffer solution (pH 7.4), and the standard addition approach was employed to detect pemetrexed with using the ds-DNA/PP/FL-NP Tb3+/ZnO/PGE as the electrochemical sensor.After preparation of the blood serum samples, we poured 0.9 mL of 15 w/v% solution of Zn sulfate/acetonitrile into 1 mL of the human plasma sample in a test tube, and heated it at 40 °C for 15 min. Furthermore, centrifugation was performed for settling the proteins to obtain a fully transparent blood serum sample. Afterwards, the buffer was poured in for a 5-fold dilution of the blood serum sample and various amounts of pemetrexed and standard solution were added into the final diluted blood serum. Finally, DPVs were recorded, and the percentage recovery of pemetrexed was determined using the standard addition approach.
2.7. Theoretical calculations
Next, molecular docking was performed on parts of the biological assay for predicting the binding mode of the anticancer drug pemetrexed into the DNA receptor. Hence, we used the intercalation mode and simulated it using DNA structures with the hexamer d(CGCGAATTCGCG)2 sequences for characterizing 1Z3F.In order to obtain the most stable geometry of pemetrexed, structure optimizing calculations were run by Gaussian 09 at the 6-31 G** level with the B3LYP hybrid density functional theory (DFT). Then, AutoDock 4.2.6 was utilized with a semiflexible docking method. It should be noted that we set all pemetrexed's bonds free while keeping the DNA rigid. In this way, a grid map with 70 Å × 70 Å × 70 Å points and a grid point spacing of 0.375 Å was produced; however, the docking simulations showed the greatest 25![[thin space (1/6-em)]](https://www.rsc.org/images/entities/char_2009.gif) 000
000![[thin space (1/6-em)]](https://www.rsc.org/images/entities/char_2009.gif) 000 energy calculations, with running 200 separate dockings with the Lamarckian genetic algorithm local search.19
000 energy calculations, with running 200 separate dockings with the Lamarckian genetic algorithm local search.19
3. Results and discussions
3.1. Morphological and structural investigations
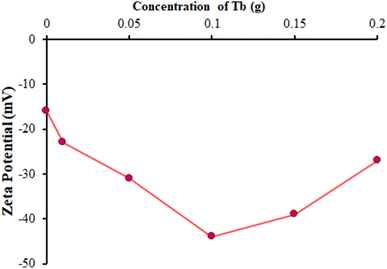
The zeta potential is useful for surface charge interpretation and durable stability evaluations. The surface charge value and potential of a prepared catalyst play key roles in the catalyst activity.39,40 Here, the synthesized catalysts were efficiently dispersed and were found to be stable at room temperature in deionized water.For the different catalysts, a variation in the zeta potential value was observed due to the dopant concentration, as depicted in Fig. 1. A more negative zeta potential (highest for 0.1 g Tb-doped ZnO) indicated a more stable dispersion and better adsorption of the catalyst in the ds-DNA solution. This negative potential ensured a decrease in the agglomeration of the prepared nanoparticles and better dispersion due to the electrostatic repulsion existing between each nanoparticle.41 FL-NP Tb3+/ZnO as a modifier and ds-DNA had opposite surface charges, which supported their electrostatic attraction and allowed their closer contact, which was beneficial for electron transmission and ultimately the determination of pemetrexed. Hence, the optimized Tb concentration of 0.1 g was chosen to fabricate the FL-NP Tb3+/ZnO for further study.
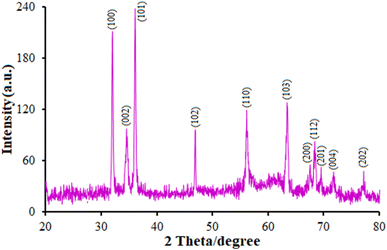
Fig. 2 presents the XRD results, showing the crystalline nature of the nanoflowers, with 2θ peaks observed at 32.56° (100), 34.83° (002), 36.415° (101), 47.14° (102), 56.22° (110), 63.59° (103), 67.75° (200), 68.63° (112), 69.73° (201), 71.70° (004), and 77.22° (202); however, we did not observe any characteristic peak for other impurities like Zn(OH)2 and metallic Zn, reflecting the product purity. There was a complete correlation between the peaks and polycrystalline hexagonal wurtzite-structured ZnO; that is, the three pronounced peaks for (100), (002), and (101) at 2θ = 32.56°, 34.83°, and 36.41° could be indexed to the typical XRD pattern of the standard ZnO (JCPDS 89-7102).42 It should be noted that ZnO NF had a higher intensity and narrower peaks, resulting in a greater crystallinity. Fig. 2 shows there was a clear shift in the diffraction peaks to higher angles than for pure ZnO, demonstrating that the minor doping of Tb ions into the ZnO lattice could cause changes due to the significantly greater ionic radius of Tb (237 pm) in comparison to Zn (139 nm), leading to an improvement in the lattice parameter in the Tb-doped ZnO crystallites. Researchers have estimated these minor changes in the case of Tb replacing Zn ions in the lattice without any variations in the crystal lattice.28
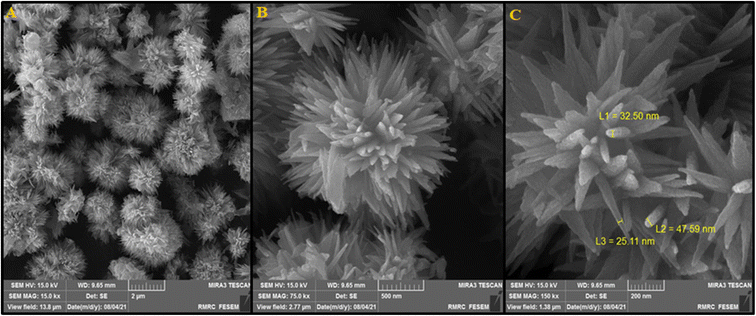
Next, FESEM was used for characterization of the morphology of the as-synthesized Tb-doped ZnO nanoflowers. Fig. 3A verified the flower-like 3D morphology seen in the FESEM images at lower magnification of ZnO nanoflakes that suggested they were formed in the shape of petals. Consequently, their high-density growth was observed because of the nanoflakes' self-assembly. Moreover, Fig. 3B and C depict the FESEM images at high magnification, displaying the uniform nanoflowers. Considering Fig. 3C, a single nanoflower dimension was ∼1–3 μm with multiple nanoflakes radially growing out from the center in symmetry, so that most of the nanoflowers were associated with each other.
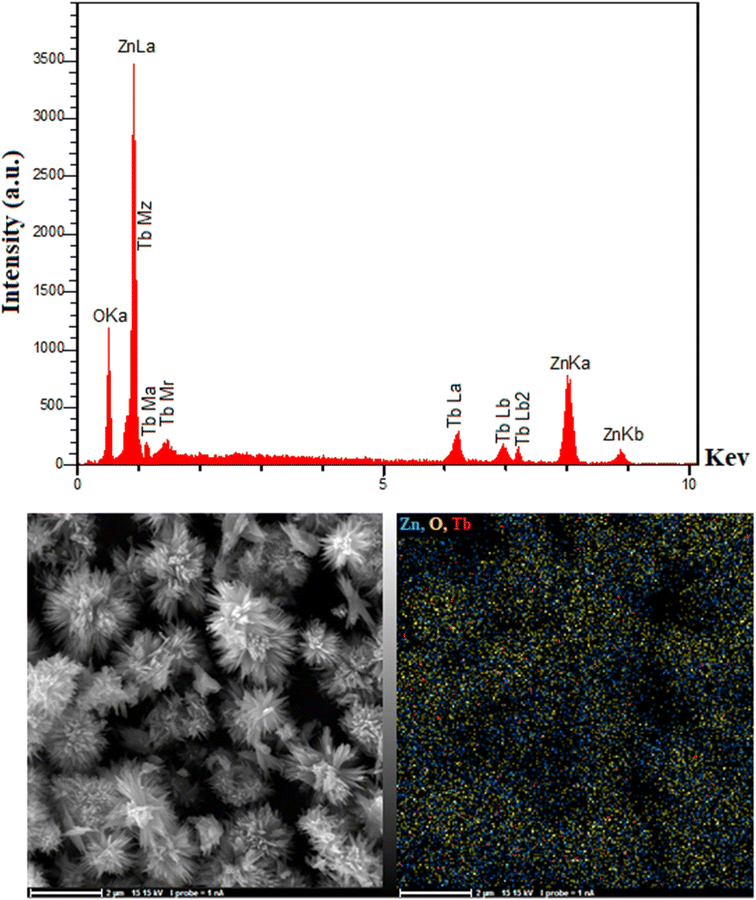
The EDAX analysis results in Fig. 4 proved the presence of Tb, O, and Zn in the ZnO nanoflowers. Considering Fig. 4, Tb, O, and Zn had matching elemental mapping results, with a smooth distribution of all three elements on the sample.
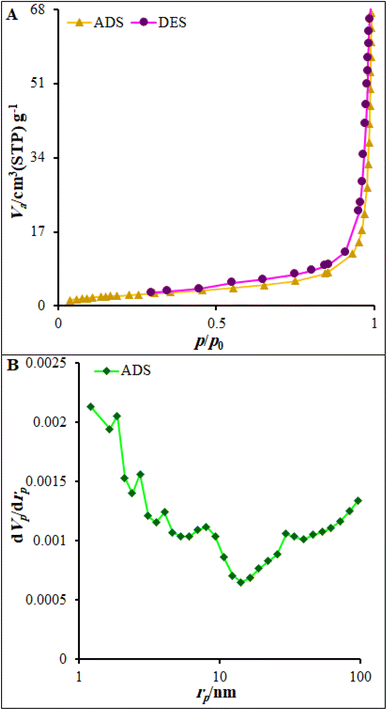
Nitrogen adsorption–desorption measurements were used to determine the surface area and pore-size distribution of FL-NP Tb3+/ZnO utilizing Brunauer–Emmett–Teller (BET) and Barrett–Joyner–Halenda (BJH) analyses. Fig. 5 displays the nitrogen adsorption–desorption isotherm of FL-NP Tb3+/ZnO. This isotherm could be classified as a type IV isotherm with a small hysteresis (H3) loop typical of materials composed of plate-like pores. For FL-NP Tb3+/ZnO, the high amount of nitrogen uptake in the low-pressure region suggests that the material had microporosity, while the steady increase in N2 uptake in the high-pressure region suggested the presence of interparticle mesoporosity.43,44 The BET surface area and pore volume were determined as 83.06 m2 g−1 and 0.57 cm3 g−1, respectively.
3.2. Study of the surface modification
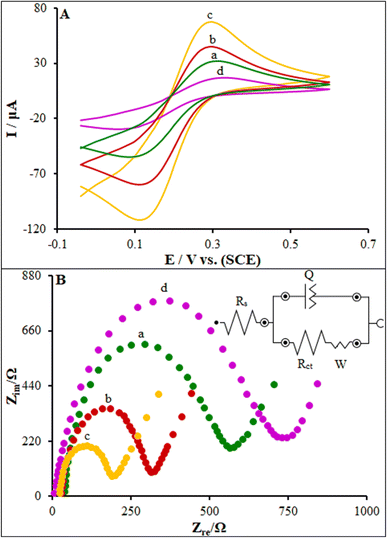
According to the research design, we utilized CV and electrochemical impedance spectroscopy (EIS) methods to validate each fabrication step of the new biosensor. Therefore, a good redox peak of [Fe(CN)6]3−/4− existed for the bare PGE (Fig. 6A, curve a). The ferro/ferricyanide redox reaction is usually regarded as a simple one-electron, one-step electron transfer (eqn (1)).45| [Fe(CN)6]3− ↔ [Fe(CN)6]4− + e− | (1) |
Following the modification of the bare electrode with the capture PP/FL-NP ZnO, a major increase was shown in the peak current (curve b), which was caused by the fast transfer of an electron through the high surface area of PP/FL-NP ZnO. After modifying with PP/FL-NP Tb3+/ZnO (curve c), an additional enhancement of the peak current response was observed, because the doping of a large atom like Tb on ZnO possibly increased the transfer rate of the electron on the modified electrodes. Furthermore, in the case of the binding of ds-DNA to the surfaces of the modified electrode (ds-DNA/PP/FL-NP Tb3+/ZnO), we observed a clear decline in the recorded current (see curve d) due to a blockage of the electron transfer through the negative-charged capture DNA. Finally, a successful process for the biosensor construction was implemented that could be also applied as a multifunctional platform for other applications.
Using EIS could provide appropriate data for the biosensor production (Fig. 6B) in 0.1 M KCl containing 5.0 mM Fe(CN)63−/4– in the frequency range of 100 kHz to 0.1 Hz. When the capture PP/FL-NP ZnO probe was modified toward the PGE (see curve b), the Rct of the capture PP/FL-NP ZnO/PGE declined to 319 Ω in comparison to the bare PGE (see curve a, Rct = 569 Ω). In addition, the Rct value of the biosensor experienced a major decline (Rct = 192 Ω) following the electrode modification with the PP/FL-NP Tb3+/ZnO nanostructure (see curve c). Consequently, the Rct value of the ds-DNA/PP/FL-NP Tb3+/ZnO/PGE was enhanced upon the binding of ds-DNA to the electrode surface (see curve d, Rct = 748 Ω). Finally, the obtained results were consistent with the findings from the CV tests, confirming the capture ds-DNA and PP/FL-NP Tb3+/ZnO were completely bound to the electrodes.46
3.3. Electrochemical response of ds-DNA immobilization on the surface of unmodified and modified electrodes
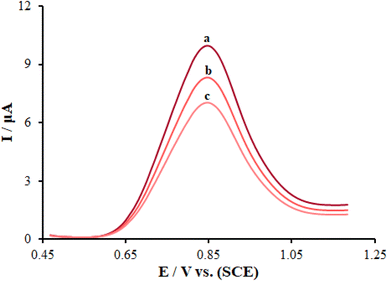
The modification of ds-DNA on the electrode was one of the main steps to fabricate the DNA biosensor, which was linked with a direct adsorption process.46 Fig. 7 displays the direct DNA electrochemistry and a comparison of the DNA DPV scans of the various modified and unmodified PGEs. The electrochemical signals of the electrodes toward guanine oxidation could be considered as a marker for the direct detection of DNA. The peak potentials of guanine oxidation were respectively computed to be about 945, 864, and 852 mV for ds-DNA/PP/PGE (curve a), ds-DNA/PP/FL-NP ZnO/PGE (curve b), and ds-DNA/PP/FL-NP Tb3+/ZnO/PGE (curve c), respectively. The modification of FL-NP Tb3+/ZnO caused an increase in the peak currents of oxidation when compared with ds-DNA/PP/PGE and ds-DNA/PP/FL-NP ZnO/PGE, being about 3.94 and 1.21 times higher due to the increased conductivity of the composite. Since the ds-DNA/PP/FL-NP Tb3+/ZnO/PGE created an optimized reaction for the peak current and peak shape and a negative shift, that modifier was selected as the best modifier for further testing.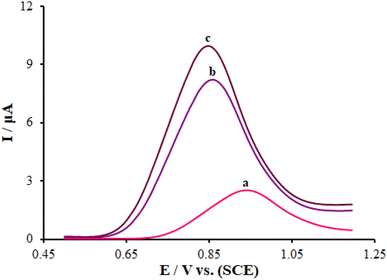 | ||
| Fig. 7 Differential pulse voltammograms of guanine in ABS (0.5 M, pH 4.8): (a) ds-DNA/PP/PGE, (b) ds-DNA/PP/FL-NP ZnO/PGE, (c) ds-DNA/PP/FL-NP Tb3+/ZnO/PGE. Scan rate: 50 mV s−1. | ||
3.4. Intercalation study
Next, DPV was employed to studying the intercalation reaction of ds-DNA with pemetrexed over the surface of the ds-DNA/PP/FL-NP Tb3+/ZnO/PGE. It was possible to observe the differential pulse (DP) voltammogram of guanine relative to the ds-DNA in the absence of the anticancer medicine at the potential of ∼852 mV with an oxidation current of 9.94 μA over the surface of the ds-DNA/PP/FL-NP Tb3+/ZnO/PGE (curve a in Fig. 8). Moreover, the oxidation potential of pemetrexed did not change in the solution with 25.0 and 50.0 μM pemetrexed (curves b and c in Fig. 8). Additionally, the oxidation current of the guanine base respectively declined to 8.33 and 7.01 μA in the presence of 25.0 and 50.0 μM pemetrexed. Therefore, the fact there was no measurable shift in the oxidation potential as well as the decline in the guanine base current of ds-DNA in the presence of pemetrexed verified the groove binding reaction of ds-DNA with pemetrexed over the surface of the ds-DNA/PP/FL-NP Tb3+/ZnO/PGE.47On the contrary, the reduction of the guanine base signal could be directly noted by the current and was related to the concentration of pemetrexed, which is useful as offering an analytical approach to detect the aforementioned medicine.
3.5. Optimization of the efficiency parameters
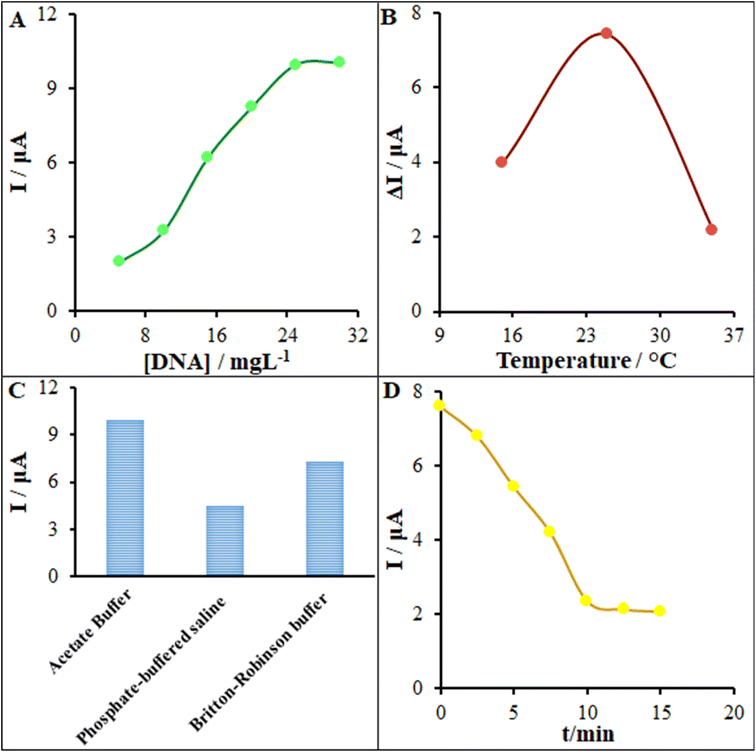
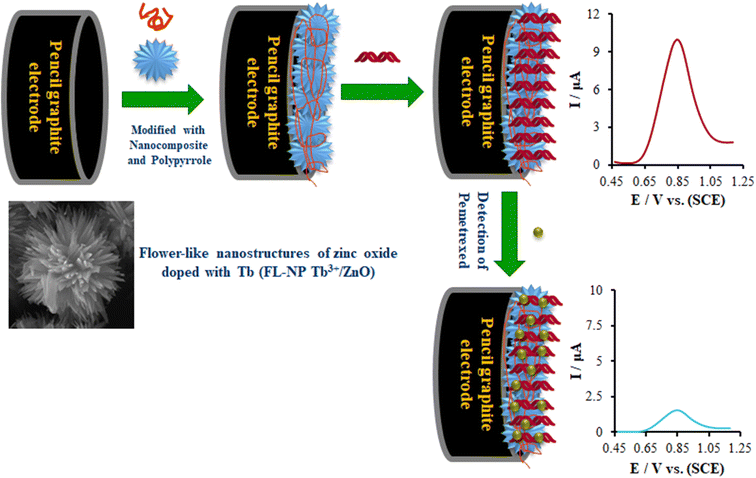
According to the research design, we optimized the initial concentration of ds-DNA, the temperature, the kind of buffer for the DNA biosensor response, as well as the incubation time. Fig. 9 displays the relationship between the oxidation current of the guanine base over the surface of the ds-DNA/PP/FL-NP Tb3+/ZnO/PGE and the ds-DNA concentration provided in the modification process. Scheme 1 depicts the biosensing process for pemetrexed detection. According to Scheme 1, PEG is first modified with FL-NP Tb3+/ZnO, PP, and ds-DNA. Then the resulting modified electrode produces a guanine electrochemical signal for the detection of ds-DNA. Finally, in the presence of pemetrexed, the electrochemical signal of guanine is reduced, which can be used to quantitatively determine pemetrexed. As seen in Fig. 9A, the oxidation current of the guanine base should be enhanced when increasing the initial concentration of ds-DNA to 25 mg L−1, but it was fixed. Hence, our conclusion is that this ds-DNA concentration saturated the concentration of 25 mg L−1 of the ds-DNA and ds-DNA/PP/FL-NP Tb3+/ZnO/PGE surface.A major factor in the functioning of a biosensor function is the solution temperature for ensuring the most acceptable interactions between anticancer drugs and ds-DNA. Hence, we recorded DP voltammograms of the ds-DNA/PP/FL-NP Tb3+/ZnO/PGE in solution with 45.0 μM pemetrexed at various temperatures (Fig. 9B), and found the most acceptable intercalation between ds-DNA and pemetrexed at 25 °C. It should be noted that the intercalation process at the temperatures above and lower than room temperature declined because of the low activity of ds-DNA at low temperature and very weak stability of ds-DNA at high temperature. Consequently, we observed the formation of a weak bond between the medicine and ds-DNA at higher temperatures.
Next, optimization of the type of interaction buffer solution was investigated as another significant element to control while making DNA biosensors and particularly for ensuring the most acceptable deposition of ds-DNA over the electrode surface. Therefore, ds-DNA was dissolved in phosphate-buffered saline (PBS), Britton–Robinson buffer, as well as acetate buffer, and DPVs of the guanine base were recorded over the surface of the ds-DNA/PP/FL-NP Tb3+/ZnO/PGE. As seen in Fig. 9C, the greatest sensitivity for the guanine base signal was related to the acetate buffer solution in comparison to in Britton–Robinson buffer solution and PBS. Thus, the major reason for the observed changes may be the presence of phosphoric acid (H3PO4) in Britton–Robinson buffer and PBS, as well as interferences between the phosphoric acid and phosphate groups of ds-DNA in the above buffers.
Considering the analyses, the incubation time has also been proposed to be a major element in the functionality of a label-free DNA biosensor. Hence, for this element to be optimized, we recorded DP voltammograms of the ds-DNA/PP/FL-NP Tb3+/ZnO/PGE in solution with 40.0 μM pemetrexed at various incubation times. The guanine signal of ds-DNA was found to decrease when increasing the incubation time, which was related to the guanine base intercalation in the ds-DNA structure with pemetrexed. Finally, the highest interaction was observed at 10 min and then the decline in the oxidation current of guanine stopped (Fig. 9D).
3.6. Reproducibility, repeatability, and stability of the biosensor production
DPVs of four biosensors made by the above-mentioned technique were utilized for investigating the ds-DNA/PP/FL-NP Tb3+/ZnO/PGE production and performance reproducibility. The relative SD (RSD) of five frequent measurements was 2.39%. In addition, the RSDs for 15 repeated determinations applying DPVs on a single electrode were ∼2.97% and 1.23% for the oxidation current and potential of the guanine signal relative to ds-DNA/PP/FL-NP Tb3+/ZnO, respectively. According to these findings, the modified electrode displayed excellent reproducibility and repeatability in both the production procedure and voltammetric measurements.Moreover, the stability of the ds-DNA/PP/FL-NP Tb3+/ZnO/PGE was tested. When the ds-DNA/PP/FL-NP Tb3+/ZnO/PGE was kept in 0.5 M ABS after the voltammetric measurements, the guanine oxidation current signals remained nearly stable in the first 10 days and then decreased by about 2.32% of its initial response after 30 days, indicating the good stability of the ds-DNA/PP/FL-NP Tb3+/ZnO-modified PEG. In addition, the electrodes were left under ambient conditions for four weeks, and there was no significant fluctuation in peak current (2.26%), confirming the appropriate stability of the modified electrode under the optimized conditions.
3.7. Analytical procedure
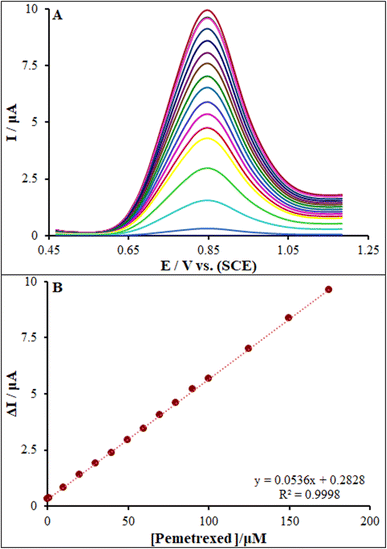
According to the research design, we recorded DP voltammograms of ds-DNA/PP/FL-NP Tb3+/ZnO/PGE in the presence of various concentrations of pemetrexed (Fig. 10). Then, the linear association of ΔIpa ([oxidation current of guanine in the absence of pemetrexed] − [oxidation current of guanine in the presence of pemetrexed]) between 0.001 μM and 175.0 μM was determined using the equation: ΔIpa = 0.0536Cpemetrexed + 0.2828 (R2 = 0.9998), and the LOD was found to be 0.17 nM for the anticancer drug pemetrexed over the surface of the ds-DNA/PP/FL-NP Tb3+/ZnO/PGE (Fig. 10).3.8. Analysis of real samples and study of their selectivity
As part of our research, we studied the selectivity of ds-DNA/PP/FL-NP Tb3+/ZnO/PGE as a modern pemetrexed biosensor in the presence of organic and inorganic interferences with a maximum acceptable error of 5% in the guanine oxidation signal. According to the findings, the records of the signals of 1000-fold additions of Na+, K+, F−, and Cl−, 700-fold of valine, glycine, and methionine, and 500-fold of vitamins C and B6 did not show any interferences when determining 20.0 μM pemetrexed with the new biosensor. Therefore, we employed the standard addition method for evaluating the potential of the ds-DNA/PP/FL-NP Tb3+/ZnO/PGE as a novel analytical approach to determine pemetrexed in real samples (Table 2). According to the table, recoveries from 99.74% to 101.2% were obtained, verifying the major capability of the ds-DNA/PP/FL-NP Tb3+/ZnO/PGE as a modern biosensor to detect pemetrexed in the real samples. In addition, t-tests were used to verify the capability of the ds-DNA/PP/FL-NP Tb3+/ZnO/PGE for analyzing pemetrexed in the real samples.3.9. Comparison of our method with others in the literature
A comparison of the analytical efficacy between our as-fabricated electrode and other electrochemical and non-electrochemical methods was performed for pemetrexed (Table 1). Based on Table 1, the detection limit and linear range of the as-fabricated sensor were better than reported for many electrochemical and non-electrochemical methods.13,48–52 When comparing chromatography methods with electrochemical methods, these methods are expensive, sophisticated, and multi-process techniques, often the need for sample preparation, pre-filtration, and extraction, as well as temperature monitoring. Accordingly, the as-fabricated sensor is potentially able to determine trace amounts of pemetrexed in various media. Moreover, the electrode used for the sensor fabrication is a PGE, which offers various advantages, like cost-effectiveness, facile modification, admirable accessibility, and lower background current when compared with other electrodes, such as diamond and carbon paste electrodes. A key strength of our research was employing nondestructive and nontoxic modifiers, and inexpensive materials (PP/FL-NP Tb3+/ZnO). As seen in Table 1, electrodes as-fabricated for electrochemically sensing pemetrexed generally show admirable properties in terms of measurement speed, sensitivity, detection limit, linear range, and sensitivity when compared to other methods reported in the literature.| Method | Dynamic range | Detection limit | Ref. |
|---|---|---|---|
| Liquid chromatography-tandem mass spectrometry | 5.0–500.0 ng mL−1 | 2.5 ng mL−1 | 13 |
| Ion-pairing reversed-phase liquid chromatography | 0.4–0.6 mg mL−1 | — | 48 |
| High-performance liquid chromatographic | 50.0–750.0 μg mL−1 | 0.63 μg mL−1 | 49 |
| Voltammetry | 1.0–35.0 μM | 0.33 nM | 50 |
| Voltammetry | 0.01–10.0 μM | 0.328 nM | 51 |
| Voltammetry | 0.005–10.0 μM | 1.60 nM | 52 |
| Voltammetry | 0.001–175.0 μM | 0.17 nM | This work |
3.10. Docking process
A docking study was done to investigate the ideal interaction site and best compounds conformation on the DNA with the lowest energy.53,54 The lowest binding energy and Ki for the interaction of DNA with pemetrexed were obtained as −10.27 kcal mol−1 and 29.6 nM, respectively. Studies indicated the stabilization of pemetrexed at the DNA minor groove occurred across five hydrogen bonds with the nucleotides and hydrophobic interactions (Fig. 11). Moreover, the major contribution of five hydrogen bonds was demonstrated in the interactions between pemetrexed and DNA. The hydrogen bonds included hydrogen (H)21 of guanine 4 (DG4) interacting with oxygen (O)3 from pemetrexed and O5 of pemetrexed establishing a hydrogen bond with H3 from guanine 4 (DG4). Then, the hydrogen (H)22 of guanine 22 (DG22) interacted with oxygen (O)6 from pemetrexed and O4 of pemetrexed established a hydrogen bond with H3 from guanine 22 (DG22). In addition, H48 of pemetrexed interacted with O2′ from thymine 19 (DT19) and H43 of pemetrexed interacted with O2′ from cytosine 21 (DC21). According to the docking results, pemetrexed could interact effectively with bases in the minor groove of DNA. The results of the electrochemical analysis (Section 3.4) and molecular docking studies provide useful information about pemetrexed–DNA interactions, which are valuable for understanding the mechanism of pemetrexed working at the molecular level.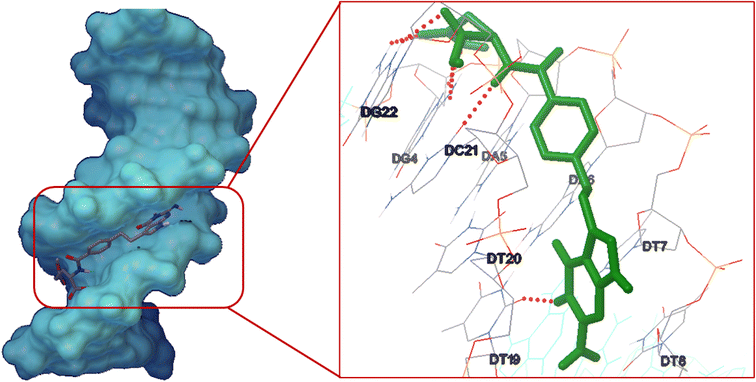 | ||
| Fig. 11 Pemetrexed-DNA minor groove interaction. Inset: geometrical disposition of pemetrexed in DNA minor groove. | ||
4. Conclusion
As mentioned earlier, this study reported the successful fabrication of a novel the electrochemical biosensing platforms for ultrasensitive pemetrexed detection with the help of PP/FL-NP Tb3+/ZnO nanocomposites as one of the materials on the surface of the electrode and ds-DNA. This biosensor exhibited a low LOD (0.17 nM) over a wide concentration range of 1.0 nM to 175.0 μM with considerable sensitivity and great selectivity toward pemetrexed. Furthermore, it was followed by prominent stability and reproducibility, with a good capability for the accurate detection of pemetrexed in real samples. It could be concluded that this new electrochemical biosensor did not just exhibit a greater sensing function for pemetrexed, but it could be used promisingly for anticancer determination in the analyses of real samples.Ethical statement
All procedures conform to the principles outlined in the Declaration of Helsinki and Ethics Committee of Shahid Beheshti University of Medical Sciences has approved the experiments.Conflicts of interest
There are no conflict to declare.References
- D. Badrudin, C. Perrault-Mercier, A. Bouchard-Fortier, J. Hubert, F. A. Leblond, L. Sideris and P. Dubé, J. Surg. Oncol., 2016, 25, 435–440 CrossRef PubMed.
- B. Gyawali and V. Prasad, JAMA Oncol., 2018, 4, 17–18 CrossRef PubMed.
- G. Scagliotti, N. Hanna, F. Fossella, K. Sugarman, J. Blatter, P. Peterson, L. Simms and F. A. Shepherd, Oncologist, 2009, 14, 253–263 CrossRef CAS PubMed.
- T. Shimizu, Y. Nakanishi, Y. Nakagawa, I. Tsujino, N. Takahashi, N. Nemoto and S. Hashimoto, Anticancer Res., 2012, 32, 4589–4596 CAS.
- K. Saravanan, H. C. Barlow, M. Barton, A. H. Calvert, B. T. Golding, D. R. Newell, J. S. Northen, N. J. Curtin, H. D. Thomas and R. J. Griffin, J. Med. Chem., 2011, 54, 1847–1859 CrossRef CAS PubMed.
- A. Hughes, P. Calvert, A. Azzabi, R. Plummer, R. Johnson, J. Rusthoven, M. Griffin, K. Fishwick, A. V. Boddy, M. Verrill and H. Calvert, J. Clin. Oncol., 2002, 20, 3533–3544 CrossRef CAS PubMed.
- G. V. Scagliotti, D. M. Shin, H. L. Kindler, M. J. Vasconcelles, U. Keppler, C. Manegold, H. Burris, U. Gatzemeier, J. Blatter, J. T. Symanowski and J. J. Rusthoven, J. Clin. Oncol., 2003, 21, 1556–1561 CrossRef CAS PubMed.
- N. J. Vogelzang, J. J. Rusthoven, J. Symanowski, C. Denham, E. Kaukel, P. Ruffie, U. Gatzemeier, M. Boyer, S. Emri, C. Manegold, C. Niyikiza and P. Paoletti, J. Clin. Oncol., 2003, 21, 2636–2644 CrossRef CAS PubMed.
- K. M. Li, L. P. Rivory and S. J. Clarke, Br. J. Cancer, 2007, 22, 1071–1076 CrossRef PubMed.
- D. Ouellet, A. P. Periclou, R. D. Johnson, J. R. Woodworth and R. L. Lalonde, Cancer Chemother. Pharmacol., 2000, 46, 227–234 CrossRef CAS PubMed.
- J. E. Latz, A. Chaudhary, A. Ghosh and R. D. Johnson, Pharmacology, 2006, 57, 401–411 Search PubMed.
- R. J. Meesters, R. Cornelissen, R. J. van Klaveren, R. de Jonge, E. den Boer, J. Lindemans and T. M. Luider, Anal. Bioanal. Chem., 2010, 398, 2943–2948 CrossRef CAS PubMed.
- C. Bobin-Dubigeon, M. Amiand, C. Herrenknecht and J. Bard, J. Chromatogr. B, 2009, 877, 2451–2456 CrossRef CAS PubMed.
- L. P. Rivory, S. J. Clarke, M. Boyer and J. F. Bishop, J. Chromatogr. B, 2001, 765, 135–140 CrossRef CAS PubMed.
- A. Warner, I. Piraner, H. Weimer and K. White, J. Pharm. Biomed. Anal., 2015, 105, 46–54 CrossRef CAS PubMed.
- S. D. Bukkitgar and N. P. Shetti, Mater. Sci. Eng., C, 2016, 65, 262–268 CrossRef CAS PubMed.
- S. A. Alavi-Tabari, M. A. Khalilzadeh and H. Karimi-Maleh, J. Electroanal. Chem., 2018, 811, 84–88 CrossRef CAS.
- A. F. Alghamdi, J. Food Drug Anal., 2014, 22, 363–369 CrossRef CAS PubMed.
- M. M. Foroughi and Sh. Jahani, Microchem. J., 2021, 179, 107546 CrossRef.
- Sh. Jahani, A. Sedighi, A. Toolabi and M. M. Foroughi, Electrochim. Acta, 2022, 416, 140261 CrossRef CAS.
- F. Amouzad and K. Zarei, Mater. Chem. Phys., 2023, 301, 127618 CrossRef CAS.
- N. Farvardin, Sh. Jahani, M. Kazemipour and M. M. Foroughi, Anal. Methods, 2020, 12, 1767–1778 RSC.
- M. M. Moarefdoust, Sh. Jahani, M. Moradalizadeh, M. M. Motaghi and M. M. Foroughi, Anal. Methods, 2021, 13, 2396–2404 RSC.
- E. Pradeepa, Y. Arthoba Nayaka and N. R. Manjushree, Mater. Chem. Phys., 2023, 296, 127180 CrossRef CAS.
- T. Iranmanesh, Sh. Jahani, M. M. Foroughi, M. Shahidi Zandi and H. Hasani Nadiki, Anal. Methods, 2020, 12, 4319–4326 RSC.
- S. Akbari, Sh. Jahani, M. M. Foroughi and H. Hasani Nadiki, RSC Adv., 2020, 10, 38532–38545 RSC.
- S. Antherjanam, B. Saraswathyamma and S. M. Senthil Kumar, Microchem. J., 2023, 190, 108659 CrossRef CAS.
- M. Taherizadeh, Sh. Jahani, M. Moradalizadeh and M. M. Foroughi, Talanta, 2023, 255, 124216 CrossRef CAS PubMed.
- L. Ghasemi, Sh. Jahani, M. Ghazizadeh and M. M. Foroughi, Mater. Chem. Phys., 2023, 296, 127176 CrossRef CAS.
- X. Yue, Z. Li and S. Zhao, Microchem. J., 2020, 159, 105440 CrossRef CAS.
- S. B. Arpitha, B. E. Kumara Swamy and J. K. Shashikumara, Inorg. Chem. Commun., 2023, 152, 110656 CrossRef CAS.
- D. R. Miller, S. A. Akbar and P. A. Morris, Sens. Actuators, B, 2014, 204, 250–272 CrossRef CAS.
- J. Steckl, J. H. Park and J. M. Zavada, Mater. Today, 2007, 10, 20–27 CrossRef.
- W. Shide, L. Chao, W. Wei, W. Huanxin, S. Yangliang, Z. Youqi and L. Lingzhen, J. Rare Earths, 2010, 28, 171–173 Search PubMed.
- A. Hastir, N. Kohli and R. C. Singh, J. Phys. Chem. Solids, 2017, 105, 23–34 CrossRef CAS.
- N. Shahabadi and M. Falsafi, Spectrochim. Acta, Part A, 2014, 125, 154–159 CrossRef CAS PubMed.
- E. M. Proudfoot, J. P. Mackay and P. Karuso, Biochemistry, 2001, 40, 4867–4878 CrossRef CAS PubMed.
- F. Arjmand, S. Parveen, M. Afzal, L. Toupet and T. B. Hadda, Eur. J. Med. Chem., 2012, 49, 141–150 CrossRef CAS PubMed.
- Z. Gao, J. Liu, F. Xu, D. Wu, Z. Wu and K. Jiang, Solid State Sci., 2012, 14, 276–280 CrossRef CAS.
- P. Kumar, M. Govindaraju, S. Senthamilselvi and K. Premkumar, Colloids Surf., B, 2013, 103, 658–661 CrossRef CAS PubMed.
- E. Dhanda, A. Nain and S. Dahiya, Water, Air, Soil Pollut., 2023, 234, 510–518 CrossRef CAS.
- A. M. Sudapalli and N. G. Shimpi, Opt. Mater., 2023, 136, 113391 CrossRef CAS.
- P. Bhanja, K. Ghosh, S. S. Islam, S. M. Islam and A. Bhaumik, ACS Omega, 2018, 3, 7639–7647 CrossRef CAS PubMed.
- E. Disli, D. Ozturk and E. Aladağ, J. Mol. Liq., 2021, 338, 116644 CrossRef CAS.
- T. Pajkossy, M. Urs Ceblin and G. Mészáros, J. Electroanal. Chem., 2021, 899, 115655 CrossRef CAS.
- H. Karimi-Maleh, M. Alizadeh, Y. Orooji, F. Karimi, M. Baghayeri, J. Rouhi, S. Tajik, H. Beitollahi, S. Agarwal, V. K. Gupta, S. Rajendran, S. Rostamnia, L. Fu, F. Saberi-Movahed and S. Malekmohammadi, Ind. Eng. Chem. Res., 2021, 60, 816–823 CrossRef CAS.
- M. M. Moarefdoust, Sh. Jahani, M. Moradalizadeh, M. M. Motaghi and M. M. Foroughi, ChemistryOpen, 2022, 11, e202100261 CrossRef CAS PubMed.
- R. Respaud, J. F. Tournamille, C. Croix, H. Laborie, C. Elfakir and M. C. Viaud-Massuard, J. Pharm. Biomed. Anal., 2011, 54, 411–416 CrossRef CAS PubMed.
- P. T. S. R. K. Prasada Rao, J. Pharm. Sci. Res., 2021, 13, 143–148 Search PubMed.
- M. Afzali, A. Mostafavi, R. Nekooie and Z. Jahromi, J. Mol. Liq., 2019, 282, 456–465 CrossRef CAS.
- N. Karadas and S. A. Ozkan, Talanta, 2014, 119, 248–254 CrossRef CAS PubMed.
- G. Ozkelikay, N. Karadas-Bakirhan, T. Taskin-Tok and S. A. Ozkan, Electrochim. Acta, 2020, 354, 136665 CrossRef.
- D. Yinhua, M. M. Foroughi, Z. Aramesh-Boroujeni, Sh. Jahani, M. Peydayesh, F. Borhani, M. Khatami, M. Rohani, M. Dusek and V. Eigner, RSC Adv., 2020, 10, 22891–22908 RSC.
- S. Asadpour, Z. Aramesh-Boroujeni and Sh. Jahani, RSC Adv., 2020, 10, 31979–31990 RSC.
| This journal is © The Royal Society of Chemistry 2023 |

