 Open Access Article
Creative Commons Attribution 3.0 Unported Licence
Enhancing MgO efficiency in CO2 capture: engineered MgO/Mg(OH)2 composites with Cl−, SO42−, and PO43− additives†
Hasanthi L. Senevirathnaa,
Shunnian Wua,
Cathie Leea,
Jin-Young Kimb,
Sang Sub Kim b,
Kewu Baic and
Ping Wu
 *a
*a
aEntropic Interface Group, Engineering Product Development, Singapore University of Technology and Design, 8 Somapah Road, 487372, Singapore. E-mail: wuping@sutd.edu.sg
bDepartment of Materials Science and Engineering, Inha University, Incheon 22212, Korea
cInstitute of High Performance Computing, Agency for Science, Technology and Research, Fusionopolis Way, #16-16 Connexis, Singapore 138632, Singapore
First published on 20th September 2023
Abstract
The formation of a MgCO3 shell hampers CO2 capture efficiency in MgO. Our previous studies developed MgO/Mg(OH)2 composites to facilitate CO2 diffusion, improving capture efficiency. However, MgCO3 still formed along the interfaces. To tackle this issue, we engineered the MgO/Mg(OH)2 interfaces by incorporating Cl−, SO42−, and PO43− additives. Novel MgO–H2O–MgX (X = Cl−, SO42−, and PO43−) composites were synthesized to explore the role of additives in preventing MgCO3 formation. MgO–Mg(OH)2–MgCl2 nano-composites displayed enhanced CO2 adsorption and stability. This breakthrough paves the way for effective bio-inspired strategies in overcoming CO2 transport barriers in MgO-based adsorbents.
Introduction
The escalating concentrations of greenhouse gases in the atmosphere have emerged as a pressing global concern, with far-reaching implications for all life forms on Earth. Among the greenhouse gases, the significant role of carbon dioxide (CO2) in causing global warming is widely recognized.1–3 Recent data indicates that atmospheric CO2 levels reached an average of 419.77 ppm by the end of February 2023, marking a substantial increase from 338.80 ppm in 1980.4 In response, scientists are actively seeking solutions to mitigate CO2 levels in the atmosphere. The synthesis of MgO powder from reject brine, which is a waste product from desalination plants, has been the subject of numerous experimental studies. Reject brine comprises large amounts of multiple anions and cations such as Cl− (65593.1 ppm), Na+ (16124.3 ppm), Mg2+ (1679.0 ppm), SO42− (4322.6 ppm), Ca2+ (563.6 ppm) and many others.5–8 Typically, plants treat reject brine to remove these concentrated anions before releasing them back to the sea. However, there is a potential for extracting the ions along with MgO directly from reject brine. Consequently, it offers significant prospects for producing highly economic and environmentally friendly ion doped-MgO-based CO2 adsorbents on a large scale.5,7,8Various materials are being currently involved for CO2 capture studies. They are mainly classified as polymeric membranes, ionic liquids (ILs), metal organic frameworks (MOFs), amine sorbents, and carbons. Even though they record high capture capacities, ability of disposing them to the environment without any harmful hazard is limited.9 Solid adsorbents have proven successful in trapping concentrated CO2 from industrial exhaust gases, offering an effective means of storage rather than direct emission into the environment.10 Several solid adsorbents with promising CO2 capture capacities have recently been proposed, with metal oxides emerging as particularly favorable candidates.11–13 Discovering a solid sorbent material capable of capturing CO2 at room temperature (RT) holds numerous advantages, including lower energy requirements, making the process economically viable for large-scale applications.14 Notably, magnesium (Mg)-based minerals present an abundant and environmentally benign option that can be produced on a significant scale at a relatively low cost.15 However, their inherent structural and morphological features restrict their adsorption capabilities, necessitating modifications to unlock their full potential.
MgO stands out to be a viable candidate for CO2 capture due to its higher theoretical CO2 capture capacity together with lower energy demand in regeneration in comparison to other metal oxides.16 Additionally, MgO is abundant on earth, of low cost and non-toxicity, and has a wide operating temperature (from room temperature to intermediate temperature).17 More, MgO exhibits significant CO2 chemisorption selectivity at temperatures below 200 °C.10,16,18–21 Despite its high theoretical CO2 capture capacity (1100 mg CO2/g sorbent), practical usage of MgO has been limited by a lack of active CO2 adsorption sites. Under dry, high-temperature conditions, MgO reacts with CO2, forming Magnesium carbonate (MgCO3).10,15 However, at lower temperatures and in moist conditions, MgO reacts with H2O to create intermediate products or hydrates that exhibit CO2 adsorption capabilities. Nevertheless, CO2 and H2O molecules may compete for adsorption sites on the MgO surface.10 Furthermore, the continuous exposure of the MgO surface to CO2 leads to saturation with MgCO3, impeding further CO2 insertion.22 Hu et al.,10 and Ruhaimi et al.,23 recently reviewed on the MgO based adsorbents for CO2 capture synthesized using various methods and at various conditions. The MgO synthesised by Zhao et al.,24 using combined surfactant assisted solvothermal or hydrothermal processes reported around 3.68 wt% of CO2 uptake below 350 °C. Elvira et al.,25 reported on MgO sorbent prepared using solution-combustion process and Ball milling method recording 1.61 wt% at 25 °C. Bhagiyalakshmi et al.,26 studied the MgO synthesized using template method at 25 °C recording about 8 wt%. A study by Song et al.,27 reported that the commercial MgO has the capture capacity of 0.88 wt%. They compared this with the porous structures calcined at different temperatures, where the best sample reported 3.6 wt% CO2 uptake. To overcome this challenge of low CO2 capture capacity of MgO itself, it is crucial to explore modified MgO-based materials and exploit their CO2 absorption mechanisms.
Recent studies have investigated the effects of Li, Na, and K nitrates on CO2 adsorption using commercial MgO powders at 300 °C. Optimization of the Li, Na, and K nitrate ratios for MgO doping enhances CO2 solubility in the salts and accelerates CO2 uptake, particularly when considering the influence of O2 concentrations on nitrites.28 Another approach involves the adoption of a solution combustion method by Elvira et al., resulting in the production of MgO doped with urea at a 2![[thin space (1/6-em)]](https://www.rsc.org/images/entities/char_2009.gif) :
:![[thin space (1/6-em)]](https://www.rsc.org/images/entities/char_2009.gif) 1 molar ratio of urea to magnesium nitrate. This strategy increases the CO2 adsorption capability from RT to 300 °C.25 Our research group has also reported significant progress in CO2 adsorption by developing bio-inspired MgO–Mg(OH)2 composites through a controlled steaming technique, albeit restricted to the MgO–H2O binary system. This technique has shown a remarkable improvement of approximately 25% in CO2 adsorption.29 Theoretical investigations on MgO–CaO composites incorporating Li, Na, K, and Rb promoters have revealed the successful utilization of Li dopants, which lead to changes in the properties of crystal surfaces, ultimately attracting CO2.30 However, the practical implementation of these active compounds raises concerns regarding environmental safety.
1 molar ratio of urea to magnesium nitrate. This strategy increases the CO2 adsorption capability from RT to 300 °C.25 Our research group has also reported significant progress in CO2 adsorption by developing bio-inspired MgO–Mg(OH)2 composites through a controlled steaming technique, albeit restricted to the MgO–H2O binary system. This technique has shown a remarkable improvement of approximately 25% in CO2 adsorption.29 Theoretical investigations on MgO–CaO composites incorporating Li, Na, K, and Rb promoters have revealed the successful utilization of Li dopants, which lead to changes in the properties of crystal surfaces, ultimately attracting CO2.30 However, the practical implementation of these active compounds raises concerns regarding environmental safety.
Over the years, various processes and methods have been employed to synthesize improved MgO-based adsorbents. These include sol–gel synthesis, hydrothermal synthesis, aerogel methods, ball-milling, template methods, and others, all contributing to the development of modified MgO materials for CO2 capture.31–33 Although these synthesis methods yield highly efficient MgO sorbents, they tend to be costly. In contrast, electrospinning offers a cost-effective approach to produce nanostructures and is renowned for its durability, adaptability, and scalability.13 Our research group has recently reported a study utilizing electrospinning to achieve mineralized CO2 capture from air at room temperature, using magnesium carbonate hydrate-based materials that achieved approximately 15.5 wt% of CO2 adsorption.21 This approach represents a smart strategy, bridging the gap between the current trial-and-error methods and a bioinspired rational design approach for developing MgO-based CO2 adsorbents.
In this research, our objective is to propose and validate two design rules using electrospinning synthesis techniques, aiming to develop a technique that incorporates both CO2-philic and CO2-phobic characteristics. (1) To design a highly efficient CO2 adsorbent, need to develop a tool that may couple the surface CO2-philic and CO2-phobic properties to balance the nucleation and transportation process during CO2 absorption. This is to eliminate the total obstruction of surface by the formed MgCO3 and allow new CO2 molecules to further absorbed through, as demonstrated in our previous study via a steaming process within the MgO–H2O binary system.29 The CO2-philic (MgO) and CO2-phobic (Mg(OH)2) domains in the sample further aid adsorbing additional fresh CO2 molecules, despite the persistence of intermittent MgCO3 precipitations neighboring MgO.34 CO2-philic parts are mainly for CO2 capturing while the CO2-phobic parts provide CO2 transport channels, which are unavailable in MgO. (2) To further mitigate the formation of MgCO3 along the MgO/Mg(OH)2 interfaces, our investigation focuses on ternary composites of Cl−, PO43−, and SO42− doped MgO–H2O–MgX structures, where X represents 2Cl−, SO42−, and 2/3PO43−. Initially, the selection of anion X is based on observations highlighting their similar size and electronegativity, which result in comparable properties.35 Subsequently, we validate our selection through Density Functional Theory (DFT) calculations and chemical engineering modelling and simulation. This contribution demonstrates a novel strategy that employs magnesium-based dopants to achieve two key objectives: (1) maintaining a balanced CO2-philic and CO2-phobic function and (2) inhibiting the formation of MgCO3 along the composite interfaces in the design of ternary MgO–H2O–MgX systems. Our approach is guided by principles derived from quantum mechanics and thermodynamics and present improved capture capacity of 4.49 wt% for 10% Cl doped MgO by using electrospinning synthesis.
Experimental
Preparation of PVA/Mg(OH)2/MgCl2 solutions (1% MgCl2, 5% MgCl2, 10% MgCl2)
The solution with 1% Cl− was prepared by dissolving 0.0025 g MgCl2 (Sigma-Aldrich) and 0.2475 g Mg(OH)2 (Sigma-Aldrich) in 5 mL acetic acid (Scharlau) via sonication in a water bath at 40 °C for 1 h. Then, the solution was mixed with the 5% w/w PVA (polyvinyl alcohol) as prepared above at a volume ratio of 15![[thin space (1/6-em)]](https://www.rsc.org/images/entities/char_2009.gif) :
:![[thin space (1/6-em)]](https://www.rsc.org/images/entities/char_2009.gif) 100 (0.750 mL to 5 mL), with further sonication for 20 min at 40 °C. The 5% Cl− solution was prepared by 0.0125 g MgCl2 and 0.2375 g Mg(OH)2. The 10% Cl− solution was prepared by 0.025 g MgCl2 and 0.225 g Mg(OH)2 followed by the same procedure as stated for the 1% Cl− solution.
100 (0.750 mL to 5 mL), with further sonication for 20 min at 40 °C. The 5% Cl− solution was prepared by 0.0125 g MgCl2 and 0.2375 g Mg(OH)2. The 10% Cl− solution was prepared by 0.025 g MgCl2 and 0.225 g Mg(OH)2 followed by the same procedure as stated for the 1% Cl− solution.
Preparation of PVA/Mg(OH)2/MgSO4 solutions (1% MgSO4, 5% MgSO4, 10% MgSO4)
The solution with 1% SO42− solution was prepared by measuring the similar weights mentioned in preparation of PVA/Mg(OH)2/MgCl2 solutions, but instead using MgSO4 (Macklin). Briefly, 0.0025 g MgSO4 and 0.2475 g Mg(OH)2 (Sigma-Aldrich). The measured samples were dissolved in 4 mL acetic acid (Scharlau) and 2 mL deionized water via sonication for 1 h at 40 °C. The solution was then mixed with 5% PVA 15![[thin space (1/6-em)]](https://www.rsc.org/images/entities/char_2009.gif) :
:![[thin space (1/6-em)]](https://www.rsc.org/images/entities/char_2009.gif) 100 ratio as mentioned in preparation of PVA/Mg(OH)2/MgCl2 solutions. The 5% SO42− and 10% SO42− solutions were prepared by following a similar procedure stated for the 1% SO42− solution.
100 ratio as mentioned in preparation of PVA/Mg(OH)2/MgCl2 solutions. The 5% SO42− and 10% SO42− solutions were prepared by following a similar procedure stated for the 1% SO42− solution.
Preparation of PVA/Mg(OH)2/Mg3(PO4)2 solutions (1% Mg3(PO4)2, 5% Mg3(PO4)2, 10% Mg3(PO4)2)
The solution with 1% PO43− solution was prepared by measuring the similar weights mentioned in preparation of PVA/Mg(OH)2/MgCl2 solutions, but instead using Mg3(PO4)2 (Acro-Organics). The measured weights were dissolved in 7 mL of 5 mol dm−3 acetic acid (Scharlau) via sonication for 1 h at 40 °C. Then the aqueous solution was added to 5% PVA with a ratio of 3![[thin space (1/6-em)]](https://www.rsc.org/images/entities/char_2009.gif) :
:![[thin space (1/6-em)]](https://www.rsc.org/images/entities/char_2009.gif) 28 (0.750 mL to 7 mL), with further sonication in a water bath at 40 °C for 20 min. The 5% PO43− and 10% PO43− solutions were prepared by following a similar procedure stated for the 1% PO43− solution.
28 (0.750 mL to 7 mL), with further sonication in a water bath at 40 °C for 20 min. The 5% PO43− and 10% PO43− solutions were prepared by following a similar procedure stated for the 1% PO43− solution.
Synthesis of Cl−, SO42− and PO43− doped MgO samples
The electrospinning process was carried out by following the parameters stated in our previous study.21 Carefully collected fiber layer dried at 60 °C for 48 h, and then calcined at 300 °C for 2 h in a box furnace (Anhui Haibei 1100 model).Characterization methods
The surface topography and morphology of nanomaterials were examined using field emission scanning electron microscope (FESEM), JEOL JSM-7600F FESEM. A small layer of gold was sputtered on to the sample surface before SEM analysis to encourage secondary electron emission, ensure uniform specimen conductivity, and offer a homogeneous surface for analysis. Thermogravimetric analysis (TGA) was performed in a CO2 atmosphere using Q50-TA Instrument to determine the CO2 adsorption capacities and long-term stability of the synthesised materials. X-ray diffraction (XRD) patterns of synthesized materials were obtained via Bruker D8 Advance XRD, using nickel-filtered Cu-Kα radiation (λ = 0.15418 nm) operated at 25 mA and 40 kV, with a step size of 0.01 (2θ) employing Cu Kα radiation (λ = 1.5406 Å). Gas sensing measurements were carried out using Keithley 2400 Source meter with a total flow of 500 SCCM. The features of gas sensing were studied in a horizontal quartz heating chamber. Data from dynamic sensing were captured with a constant DC bias of 1 V. Target gas CO2 (Rg) and air (Ra) output resistances were measured, and the sensor's response was calculated as Ra/Rg. Brunauer–Emmett–Teller (BET) analysis carried out using BET ASAP 2020 Specific Surface Analyzer to determine the surface area and pore size distribution of the samples. BET analysis also provide an analysis of adsorption–desperation isotherms for the samples.Results and discussion
Structural properties
Structural characteristics of synthesized samples were observed using XRD analysis. The main peaks of the Cl−-doped samples matched with characteristic peaks of MgO, indicated by ‘#’ (ICDD 00-045-0946) and pure Mg(OH)2 (ICDD 00-044-1482).MgO(111), MgO(200), MgO(220), MgO(331), MgO(222), MgO(400), MgO(420), MgO(422) and Mg(OH)2 indicated by ‘+’ (101) from 35° to 140° as shown in Fig. 1a. From 10° to 35°, peaks mainly belong to multiple hydrides shown in Fig. S1a,† it is evident that the peaks are belongs to multiple hydrides of chlorine, as magnesium chlorate hydrate (Mg(ClO4)2·xH2O) (ICDD 00-031-0789), magnesium chloride carbonate hydrate (Mg2Cl2CO3·7H2O) (ICDD 00-021-1254) and magnesium chloride diethylene glycol (C8H20Cl2MgO6) (ICDD 00-031-1763). The sharp diffraction peaks in Fig. 1a, 1% Cl− doped sample indicate the better crystallinity. It is evident that increase in dopant percentage, results poor crystallinity in samples. In addition, the distinctive MgO peaks shifted toward the lower angles depicted in Fig. 1a as the Cl− % increased. Fig. S1a† shows the intensities of the hydrides peaks from 10° to 35°, are visibly decreasing with increased Cl− percentage, indicating the poor crystallinity of samples and decrease in grain size.36 This may also due to the size difference of the doped atoms making the crystal structure to be expand or contract.37,38 The SO42− doped samples are presenting a similar pattern in Fig. 1b as the Cl− doped samples. The peaks related to MgO observed to be low intense, and a peak shift is observed in MgO(111), MgO(200), MgO(220), MgO(331), MgO(222), MgO(400), MgO(331), MgO(420), MgO(422) and Mg(OH)2(101) similar to the Cl− doped samples. From 2θ = 10°–35° the peaks indicate the presence of multiple hydrides as magnesium carbonate hydroxide hydrate (Mg2CO3(OH)2·3H2O) (ICDD 00-006-0484), magnesium oxide sulphate hydrate (Mg6O5SO4·8H2O) (ICDD 00-008-0280), magnesium malonate hydrate (C3H2MgO4·2H2O) (ICDD 00-026-1851) as shown in Fig. S1b.† A peak shift evident with increasing dopant percentage may be due to formation of hydrides and increased dopant amounts. The PO43− doped samples show poor sample match with the MgO in comparison to the Cl− and SO42− doped samples. However, presence of multiple phases of hydrates such as magnesium phosphate (Mg3(PO4)2) (ICDD 01-075-1491), magnesium phosphate hydrate (Mg3(PO4)2·22H2O) (ICDD 00-044-0775), magnesium carbonate hydroxide hydrate (Mg5(CO3)4(OH)2(H2O)4) (ICDD 01-070-0361) and magnesium oxalate (MgC2O4) (ICDD 00-026-1222), matching with the samples shown in Fig. S1c† can be observed. The PO43− doped samples, indicate the dissolution of both MgO and Mg(OH)2 phases and the formation of magnesium oxalate (MgC2O4) and magnesium phosphate hydrate (Mg3(PO4)2·22H2O) in comparison to other two dopants. It is evident from the XRD data that of hydrate formation of hydrates increases from Cl−, SO42− to PO43−.
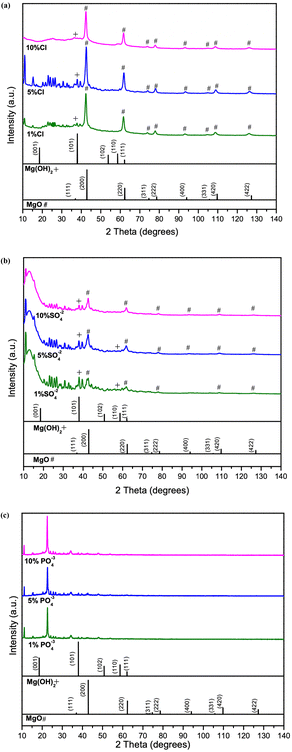 | ||
| Fig. 1 Comparison of XRD data of 1%, 5% and 10%, of (a) Cl− doped (b) SO42− doped, and (c) PO43− doped samples. | ||
However, doped MgO–Mg(OH)2 sample peaks with low intensity and wide widths reflect amorphous-like structures with poor crystallinity and defects. Studies26 suggest that, generally, structure basic sites favor reversible CO2 sorption represented in the following form:
| Mg–O(s) + CO2(g) → Mg–O–CO2(ad) |
Perhaps the increase of basic sites with the addition of dopants may result in better adsorption than of without the dopants. Furthermore, due to large number of the hydrides and carbonates present in the samples as explained in the earlier sections from the XRD data, hydrides are expected to anchor large number of hydrogen bonds (H-bonds) from the water molecules on the sample surfaces in all cases (Cl−, SO42−, and PO43− doped) which eventually form bonds with CO2 via chemisorption.
Morphological properties
The SEM image analysis for the 1%, 5% and 10% Cl− doped MgO samples reveals a combination of rod like and sheet like structures shown in Fig. 2a. This may due to grounding of the involvement of Mg(OH)2 utilizing the calcination temperatures of 300 °C and 500 °C XRD data, the hydrate formation to start the competition between H2O and CO2 for surface cites on the nanocomposite, was validated by the XRD results. Collected powders thoroughly after calcination. The formation of rods indicates a 1-dimensional heterogeneously growth of MgO. The 5% Cl− doped MgO displayed sheets like The adsorption/desorption curves present that even though the large number of hydrates present the 10% Cl− doped sample was stable at 30 °C. Therefore, the hydrates may aided the better performance of the Cl− doped nano composites.29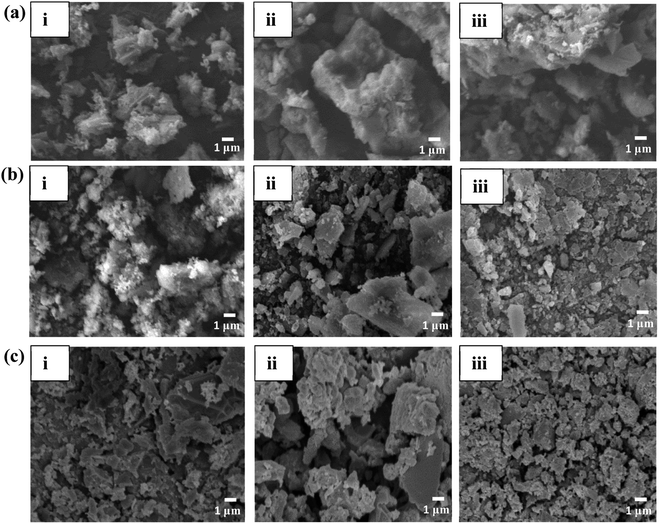 | ||
| Fig. 2 SEM analysis of (a) Cl− doped (b) SO42− doped (c) PO43− doped sample where, (i), (ii) and (iii) are 1%, 5% and 10% dopants in each sample. | ||
Structures with uniform surfaces, with a typical 2-dimensional diffusion mode. The 10% Cl− doped MgO showed a similar structure to 5% Cl− doped MgO presenting sheet-like uniform structure. The morphology of the SO42− doped MgO samples shown in Fig. 2b, displayed sheet-like structures. However, increasing SO42− concentrations, the grain size was observed to be decreasing. The variations in morphology are comparable to those of MgO developed from Mg(OH)2 using various alkali salts when dopant concentrations increase from 1, 5, and 10 wt% Cl−.6
The loss of water during the breakdown of Mg(OH)2 creates a porous structure that will filled with the newly generated MgO particles.6 The PO43− doped MgO samples in Fig. 2c also observed to be sheet-like structures under the similar conditions, indicating a strong presence of heterogeneously grown hydrates which support by the XRD data. The morphology of the PO43− doped MgO samples are varied from those of the Cl− and SO42− doped MgO samples. The sheet like structures provide a room to trap CO2 in between the layers. The tailored surface chemistry by the dopants may form more defects and vacancies on and in between the sheet like structures, aiding to CO2 adsorption.39
CO2 capture performance
The CO2 adsorption performance of the samples were measured using a TGA analyzer. The experiment carried out at room temperature (30 °C) To avoid inaccuracies during the analysis, 5–6 mg of samples was used throughout the study. At the start of the measurement, samples were pre-calcined at 150 °C for 60 min while being pumped with high purity N2 at a rate of 40 mL min−1 and a ramp rate of 10 °C min−1. A steady flow of CO2 gas (1 atm, 40 mL min−1), exposed to record the CO2 capture capacity for 1.5 h. Maximum adsorption capacity at 1.5 h adsorption of 4.59 wt% was given by the 10% Cl− doped sample. While 5% Cl− and 1% Cl− doped samples were captured only 2.79 wt% and 2.97 wt% respectively, as shown in Fig. 3a. However, the SO42− and PO43− doped samples recorded low adsorption capacities as shown in Fig. 3b and c, respectively. The SO42− doped samples recorded its maximum adsorption for the 10% doped samples. Adsorption capacity of the samples were observed to be reduced with decreasing dopant percentage.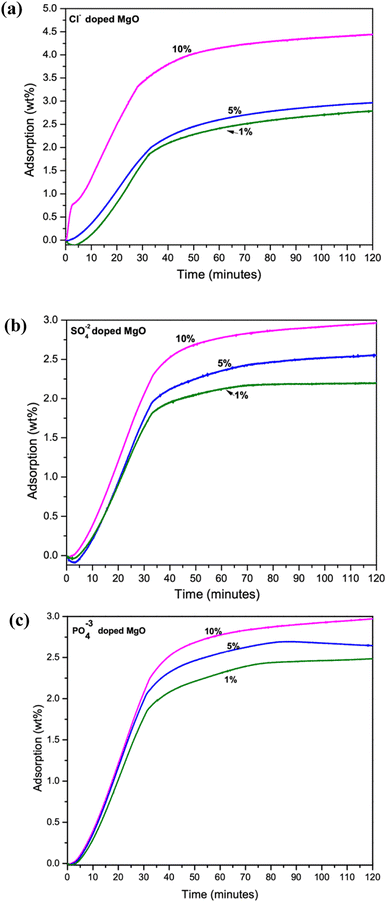 | ||
| Fig. 3 TGA analysis of CO2 adsorption capacity of 1%, 5% and 10% doped samples (a) Cl− doped (b) SO42− doped and (c) PO43− doped MgO–Mg(OH)2 composites. | ||
The PO43− doped samples were also followed the similar trend shown in Fig. 3c. However, the disappearance of the MgO–Mg(OH)2 phase in PO43− doped samples may account for their much lower CO2 adsorption among the three dopants. Therefore, it is evident that increasing dopant percentage increases CO2 adsorption capacities of the synthesized composites. However, the CO2 adsorption performance of SO42− and PO43− doped samples are deficient in comparison to the Cl− doped samples.
Properties of Cl− doped MgO–Mg(OH)2 composites
From the CO2 adsorption capacity, it is evident that Cl-doped samples performed better in comparison to SO42− and PO43− doped composites. Therefore, further chemical equilibria calculations for the possible bulk reactions for the Cl−-doped systems were carried out by using FactSage40 commercial software.(1) 1 wt% MgCl2
| 1.698 (mol) Mg(OH)2 + 0.011 (mol) MgCl2 + 0.112 (mol) H2O + 0.112 (mol) CO2 = 1.688 (mol) MgO + 0.018 (mol) Mg(OH)Cl + 0.0008MgCO3 + gas phase |
(2) 5 wt% MgCl2
| 1.629 (mol) Mg(OH)2 + 0.053 (mol) MgCl2 + 0.104 (mol) H2O + 0.104 (mol) CO2 = 1.579 (mol) MgO + 0.102 (mol) Mg(OH)Cl + 0.0001MgCO3 + gas phase |
(3) 10 wt% MgCl2
| 1.543 (mol) Mg(OH)2 + 0.105 (mol) MgCl2 + 1 (mol) H2O + 1 (mol) CO2 = 1.44 (mol) MgO + 0.21 (mol) Mg(OH)Cl + gas phase |
The CO2 threshold (at an equal CO2 to H2O ratio) for the formation of MgCO3 is respectively >1.0, 0.104, and 0.112 (moles) for a sample of 100 g. Therefore, it is unlikely that MgCO3 is stable in samples with 10 wt% MgCl2 and 90% Mg(OH)2 but the 5 wt% and 1 wt% MgCl2 samples, because of the much lower (≪0.5 atm) CO2 level in air. It is interesting that based on thermodynamic calculation, the 5 wt% MgCl2 sample has the lowest CO2 threshold, which correlated well with the heights of the glass phase XRD peaks from 10° to 35°. To further invest if hydrates form in the 5 wt% MgCl2 sample at 25 °C, the following calculation is obtained:
(4) 5 wt% MgCl2
| 1.629 (mol) Mg(OH)2 + 0.053 (mol) MgCl2 + 0.104 (mol) H2O + 0.000001 (mol) CO2 = 1.603 (mol) Mg(OH)2 + 0.053 (mol) Mg(OH)Cl + 0.0001 MgCO3 + 0.026 MgCl2(H2O)4 + gas phase |
At lowered CO2 mole environment (which replicate the CO2 levels in air) and at 25 °C, a new hydrate phase, MgCl2(H2O)4, is formed. This new formed phase supports the assumption that hydrate glass phases may be represented by the XRD peaks from 10° to 35° (Fig. S1a†). Therefore, from thermodynamics, it is evident that hydration is a competition process to CO2 adsorption. The surface area is one of the significant properties of adsorbents as it influences the amount of gas capture capacities.
Since the Cl− doped samples recorded the higher CO2 capture capacity, the N2 adsorption–desorption isotherms are measured to determine the surface area of samples, as illustrated by Fig. 4a–c and summarized in Table 1. Low pressure and 200 °C were used during the analysis, with 0.3 g of powder from each Cl− doped samples. All 3 samples (1%, 5% and 10% Cl− doped) exhibited a type II isotherm with a hysteresis loop of type H3 according to the IUPAC classification.41 The H3 hysteresis typically caused by samples that are agglomerated and have the sheet like structures with flexible pores.25,42 The N2 adsorption observed to be decreased with increasing dopant percentage. The 5% Cl− doped MgO sample determined to have the higher specific surface area of 65.5 m2 g−1 compared to the other samples. This observation may be due to the presence of hydrate phases (2 theta angles from 10°–35° in Fig. S1b†) reaches the maximum at 5% Cl−. Although the 10% Cl− doped MgO sample presented the higher CO2 capture capacity it shows the lowest specific surface area of 26.2 m2 g−1.
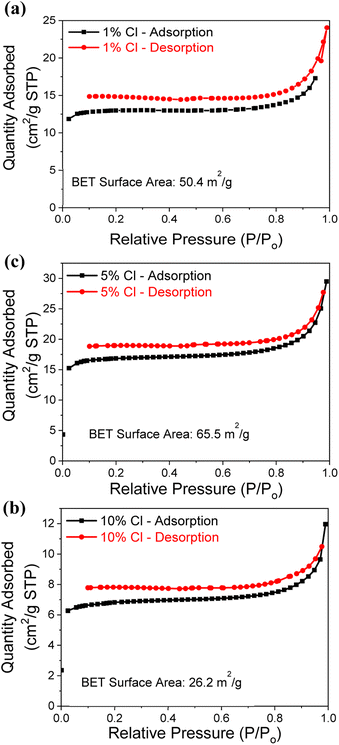 | ||
| Fig. 4 N2 adsorption–desorption isotherms analysis for the (a) 1%, (b) 5% and (c) 10% Cl− doped samples. | ||
| Sample | BET surface area (m2 g−1) |
|---|---|
| 1% Cl− | 50.4 |
| 5% Cl− | 65.5 |
| 10% Cl− | 26.2 |
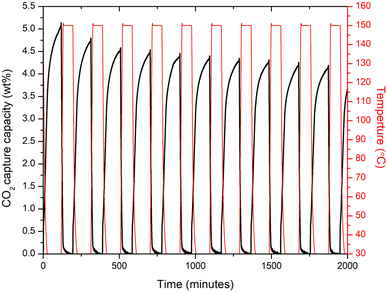
Recovery and long term stability of an adsorbent material after CO2 capture is another important characteristics that needs to be further analyse for them to apply in real conditions. Therefore, the 10% Cl− doped sample which performed better in comparison to other doped samples, subjected to adsorption/desorption cycles as shown in Fig. 5. The 10% Cl− doped sample's CO2 absorption at 30 °C was discovered to fall from 5.12 to 4.19 wt% during 10 cycles, demonstrating the novel adsorbent's strong long-term adsorption/desorption stability. In comparison, to the recent studies,28,43 the 10% Cl− doped sample, the drop rate of CO2 adsorption capacity over 10 adsorption/desorption cycles at 30 °C was about 18%, suggesting a better cycle stability indicating the adsorbent material may perform well in capturing the atmospheric CO2 long term.
As the 5% Cl− doped sample observed to have the higher surface area, the same sample was then subjected to analyze the gas sensing capability at high temperature conditions. Alpha-terpineol was used (Sigma-Aldrich) as the binder and 0.01 g of 5% Cl− doped powder was mixed with 0.01 ml of alpha-terpineol. Then, the mixed solution was coated on the electrode substrate using the screen-printing method. Subsequently, the samples were dried at 60 °C for 30 min. Finally, to remove remaining solvents, the samples were heat-treated at 250 °C for 1 h in air.
The properties of the 5% Cl− doped sample sensor, interdigitated titanium and platinum electrodes were sequentially deposited by direct current (DC) sputtering on the substrate with thicknesses of 50 nm and 200 nm, respectively. For the gas sensing measurements, the constructed sensor was electrically coupled to a Keithley 2400 source meter. Data from dynamic sensing were captured with a constant DC bias of 1 V. The 5% Cl− doped sample gas sensor's CO2 detection capabilities were tested under gas concentrations of 50–5000 ppm at temperatures ranging from 25–300 °C. The chemisorption of CO2 renders the 5% Cl− doped composite a subpar CO2 sensing material. Table 2 summarizes the CO2 gas response in 5% Cl− doped composites. The measurement at 300 °C detects the CO2 at 500 ppm levels because of the thermal decomposition temperature to MgCO3 is about 327 °C. However, at low temperature the sensors are not performing well.
| Temperature (°C) | 5000 ppm | 1500 ppm | 500 ppm | 150 ppm | 50 ppm |
|---|---|---|---|---|---|
| 200 | 1.017 | 1 | 1 | 1 | 1 |
| 250 | 1.022 | 1.014 | 1 | 1 | 1 |
| 300 | 1.013 | 1.009 | 1.006 | 1 | 1 |
Theoretical analysis of CO2 adsorption on MgO and Mg(OH)2
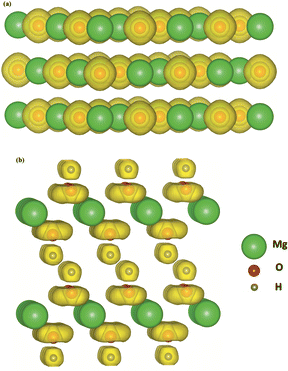
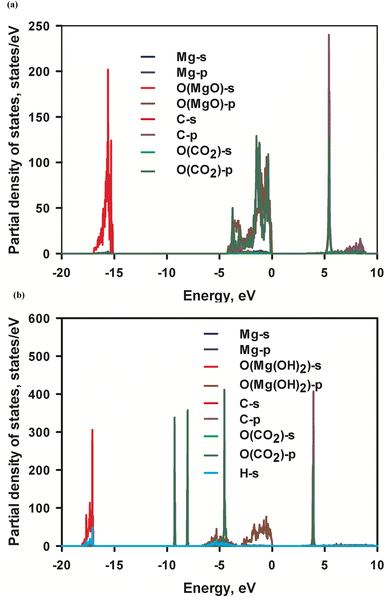
Adsorption of CO2 molecules on the most stable MgO and Mg(OH)2 surfaces are simulated using first-principles calculation respectively to determine the surface affinity to CO2 molecules. The electronic structure of the adsorbent is crucial to its affinity. Fig. 6 visualizes the electronic density of MgO and Mg(OH)2 in terms of valence electron localization function (ELF) iso-surface at ELF = 0.80. Distinctive discrepancy in bonding characteristic is observed between MgO and Mg(OH)2. The localized electron is spherically distributed in the O2− anion in MgO, indicating a pure ionic bond. Since CO2 is a Lewis acid molecule and tends to accept electrons, the accumulation of electrons on the O2− anions are beneficial to the attraction of CO2 molecules to MgO surface containing O atoms. As to the OH− anion in Mg(OH)2, the strong covalent contribution to O–H bonding caused by the deep overlapping of the valence orbitals of oxygen and hydrogen is established in the vertical direction. In contrast, the regular torus-shaped iso-surface in the planar directions is formed from contributions of localized lone-paired electrons. Due to the oriented vertical deformation of the localized electronic cloud from sphericity, this covalency has partially polar character with negative O ion and position H ion. The positively charged H cations are obstructive to the attraction of CO2 molecules to Mg(OH)2 surface comprised by H atoms. The distinctive discrepancy of affinity to CO2 molecules in MgO and Mg(OH)2 surfaces gives rise to significantly different CO2 adsorption behaviors.Adsorption of CO2 molecules on the most stable (001) MgO and Mg(OH)2 surfaces are simulated respectively with their corresponding partial density of states (PDOS) are presented in Fig. 7. Appreciable hybridization of p orbitals between C atom and O (MgO) atoms and trivial hybridization of p orbitals of O (CO2) atom and s orbital of Mg atoms are observed in MgO surface, indicating strong interaction between C and O (MgO) atoms. This is consistent with the inferred strong affinity of MgO to CO2 molecules. The interaction leads to the strong physical adsorption of CO2 to MgO surface. This is evidenced by the calculated CO2 adsorption energy −0.48 eV. No perceptible hybridization between C atom and O(Mg(OH)2) atom or between O(CO2) atom and Mg atom in Mg(OH)2 surface is noted in Fig. 6b, being consistent with the weak affinity of Mg(OH)2 to CO2 molecules. Therefore, the adsorption of CO2 molecules on Mg(OH)2 surface is entirely by weak dispersion forces. This agrees with the calculated marginal CO2 adsorption energy −0.046 eV. The energy barrier from physisorption to chemisorption is generally defined as −0.52 eV. Therefore, MgO and Mg(OH)2 can be classified as the strong end and the weak end of the physical adsorption of CO2 respectively. Consequently, it can be assumed that MgO is CO2-philic adsorbent while Mg(OH)2 is CO2-phobic adsorbent.
One intriguing feature of Mg(OH)2 is that it is a chemically versatile solid hydroxide. It can be dehydrated into simple oxide and water under heat,44
| H2Odissolved + Ostructure2− → (OH−)structure + (OH−)structure |
The transformation from MgO to Mg(OH)2 is mainly achieved by structural rearrangements of O2− ions. The large electronegativity differences between Mg and O, the linking of Mg2+ and O2− ions via charge-transfer gives rise to strong Mg–O ionic bonds, then the direct binding of water molecules to metal centres becomes impossible. Therefore, it renders us an opportunity to synthesize interweaved MgO–Mg(OH)2 composites to mimic Namib Desert Beetles, whose surface texture is comprised of wax free hydrophilic bumps and waxy hydrophobic valleys, for efficient water collection and droplet formation.46 With controlling of calcination temperature, it is potential to synthesize surface texture with interweaved CO2-philic MgO part for efficient CO2 capture by physical adsorption and CO2-phobic Mg(OH)2 part for massive CO2 storage by chemical reaction. Our first-principles calculations on Mg(OH)2 monolayer further suggest that doping and charge be additional approaches to adjust the CO2-phobicity of Mg(OH)2.47
Conclusion
In conclusion, our study has successfully synthesized, characterized, and validated a range of anion-doped MgO–Mg(OH)2 nanocomposites for ambient CO2 adsorption. By optimizing the composites, we were able to tailor the CO2-phobicity in Mg(OH)2, effectively inhibiting carbonate production and enhancing CO2 diffusion through the nanocomposites. Among the doped samples, the Cl− doped composite exhibited efficient CO2 adsorption at 30 °C and demonstrated stability throughout multiple adsorption/desorption cycles. On the other hand, the CO2 adsorption studies for the PO43− doped samples indicated a lack of facilitation for CO2 adsorption at room temperature, while the SO42− samples showed relatively favorable results. Furthermore, the introduction of dopants plays a vital role in understanding the impact of MgO-based sorbents on improving CO2 capture properties. This work expands the design space, offering new opportunities for the development of enhanced and cost-effective CO2 adsorbents based on magnesium minerals. This expansion includes transitioning from the binary MgO–H2O system to ternary MgO–H2O–MgX or even quaternary MgO–H2O–MgX1–MgX2 systems. By exploring these avenues, we can further enhance the performance and efficiency of magnesium-based adsorbents for CO2 capture.Conflicts of interest
The authors declare no conflict of interest.Author contributions
Conceptualization, P. W. and H. L. S.; methodology H. L. S.; validation, H. L. S., C. L. and S. W.; investigation, H. L. S.; data curation, H. L. S., S. W., J. Y. K.; writing – original draft preparation, P. W., S. W. and H. L. S.; writing – review and editing, H. L. S., P. W., S. W., S. S. K., and K. B.; all authors have read and agreed to the published version of the manuscript.Acknowledgements
This research was supported by MOE2018-T2-1-163 from Ministry of Education, Singapore; AME Individual Research Grant (A20E7c0108) by Agency for Science, Technology and Research; Marine Science Research and Development program (MSRDP-P28) by National Research Foundation, Prime Minister's Office, Singapore; MOE-T1-program (SKI 2021_02_15) from Ministry of Education, Singapore. We'd also like to thank the University of Montreal's CRCT for providing the FactSage software for this study.References
- C. Stewart and M.-A. Hessami, Energy Convers. Manage., 2005, 46, 403–420 CrossRef CAS.
- D. P. Schrag, Science, 2007, 315, 812–813 CrossRef CAS PubMed.
- J. R. Petit, J. Jouzel, D. Raynaud, N. I. Barkov, J. M. Barnola, I. Basile, M. Bender, J. Chappellaz, M. Davis, G. Delaygue, M. Delmotte, V. M. Kotlyakov, M. Legrand, V. Y. Lipenkov, C. Lorius, L. PÉpin, C. Ritz, E. Saltzman and M. Stievenard, Nature, 1999, 399, 429–436 CrossRef CAS.
- G. M. Laboratory, Trends in Atmospheric Carbon Dioxide: Globally averaged marine surface monthly mean data, https://www.esrl.noaa.gov/gmd/ccgg/trends/global.html, accessed 22 May 2023, 2023.
- H. Dong, C. Unluer, E.-H. Yang and A. Al-Tabbaa, Hydrometallurgy, 2017, 169, 165–172 CrossRef CAS.
- H. Dong, E.-H. Yang, C. Unluer, F. Jin and A. Al-Tabbaa, J. Cleaner Prod., 2018, 196, 100–108 CrossRef CAS.
- H. Dong, C. Unluer, E.-H. Yang and A. Al-Tabbaa, Desalination, 2018, 429, 88–95 CrossRef CAS.
- S. Ruan, E.-H. Yang and C. Unluer, J. CO2 Util., 2021, 44, 101383 CrossRef CAS.
- N. Iqbal, A. A. Babar, G. Zainab, B. Ding, J. Yu and X. Wang, Electrospinning: Nanofabrication and Applications, 2019, pp. 619–640, DOI:10.1016/b978-0-323-51270-1.00020-0.
- Y. Hu, Y. Guo, J. Sun, H. Li and W. Liu, J. Mater. Chem. A, 2019, 7, 20103–20120 RSC.
- J. Wang, L. Huang, R. Yang, Z. Zhang, J. Wu, Y. Gao, Q. Wang, D. O'Hare and Z. Zhong, Energy Environ. Sci., 2014, 7, 3478–3518 RSC.
- S.-Y. Lee and S.-J. Park, J. Ind. Eng. Chem., 2015, 23, 1–11 CrossRef CAS.
- N. Iqbal, A. A. Babar, G. Zainab, B. Ding, J. Yu and X. Wang, Chapter 20 - Electrospun Nanofibers for Carbon Dioxide Capture, Micro and Nano Technologies, in Electrospinning: Nanofabrication and Applications, ed. B. Ding, X. Wang and J. Yu, William Andrew Publishing, 2019, pp. 619–640 Search PubMed.
- B. Feng, H. An and E. Tan, Energy Fuels, 2007, 21, 426–434 CrossRef CAS.
- Y. Duan and D. C. Sorescu, J. Chem. Phys., 2010, 133, 074508 CrossRef PubMed.
- Z. Refaat, M. E. Saied, A. Naga, S. A. Shaban, H. B. Hassan, M. R. Shehata and F. Y. E. Kady, Environ. Sci. Pollut. Res. Int., 2023, 30, 53817–53832 CrossRef CAS PubMed.
- Q. Pu, Y. Wang, X. Wang, Z. Shao, S. Wen, J. Wang, P. Ning, S. Lu, L. Huang and Q. Wang, J. CO2 Util., 2021, 54, 101756 CrossRef CAS.
- Y. Y. Li, M. M. Wan, W. G. Lin, Y. Wang and J. H. Zhu, J. Mater. Chem. A, 2014, 2, 12014–12022 RSC.
- Y.-D. Ding, G. Song, X. Zhu, R. Chen and Q. Liao, RSC Adv., 2015, 5, 30929–30935 RSC.
- D. Esrafilzadeh, A. Zavabeti, R. Jalili, P. Atkin, J. Choi, B. J. Carey, R. Brkljaca, A. P. O'Mullane, M. D. Dickey, D. L. Officer, D. R. MacFarlane, T. Daeneke and K. Kalantar-Zadeh, Nat. Commun., 2019, 10, 865 CrossRef PubMed.
- H. L. Senevirathna, A. Lebedev, V. Y. Chen, C.-S. Chou and P. Wu, J. Environ. Manage., 2021, 295, 113095 CrossRef CAS PubMed.
- A. Wang, X. Pi, R. Fan, S. Hao and Y. Yang, Inorg. Chem., 2019, 58, 5345–5355 CrossRef CAS PubMed.
- A. H. Ruhaimi, M. A. A. Aziz and A. A. Jalil, J. CO2 Util., 2021, 43, 101357 CrossRef CAS.
- Z. Zhao, H. Dai, Y. Du, J. Deng, L. Zhang and F. Shi, Mater. Chem. Phys., 2011, 128, 348–356 CrossRef CAS.
- G. B. Elvira, G. C. Francisco, S. M. Victor and M. R. Alberto, J. Environ. Sci., 2017, 57, 418–428 CrossRef CAS PubMed.
- M. Bhagiyalakshmi, J. Y. Lee and H. T. Jang, Int. J. Greenhouse Gas Control, 2010, 4, 51–56 CrossRef CAS.
- G. Song, Y.-D. Ding, X. Zhu and Q. Liao, Colloids Surf., A, 2015, 470, 39–45 CrossRef CAS.
- Y. Qiao, J. Wang, Y. Zhang, W. Gao, T. Harada, L. Huang, T. A. Hatton and Q. Wang, Ind. Eng. Chem. Res., 2017, 56, 1509–1517 CrossRef CAS.
- H. L. Senevirathna, S. Wu, W. P. C. Lee and P. Wu, Materials, 2022, 15, 680 CrossRef CAS PubMed.
- J. M. Jang and S. G. Kang, ACS Sustain. Chem. Eng., 2019, 7, 16979–16984 CrossRef CAS.
- C. Gunathilake and M. Jaroniec, J. Mater. Chem. A, 2016, 4, 10914–10924 RSC.
- X. Fu, Adv. Mater. Res., 2012, 490–495, 3797–3801 CAS.
- P. Ouraipryvan, T. Sreethawong and S. Chavadej, Mater. Lett., 2009, 63, 1862–1865 CrossRef CAS.
- S. Wu, B. T. Tan, H. L. Senevirathna and P. Wu, Appl. Surf. Sci., 2021, 562, 150187 CrossRef CAS.
- H. L. Senevirathna, P. V. T. Weerasinghe, X. Li, M. Y. Tan, S. S. Kim and P. Wu, Materials, 2022, 15, 983 CrossRef CAS PubMed.
- M. Pal, U. Pal, J. M. Jimenez and F. Perez-Rodriguez, Nanoscale Res. Lett., 2012, 7, 1 CrossRef PubMed.
- P. Muhammed Shafi and A. Chandra Bose, AIP Adv., 2015, 5, 057137 CrossRef.
- P. Bindu and S. Thomas, J. Theor. Appl. Phys., 2014, 8, 123–134 CrossRef.
- R. Hazarika and B. Kalita, Mater. Sci. Eng., B, 2022, 286, 115974 CrossRef CAS.
- P.-H. Huang, S.-Y. Chien, P. Wu and C.-S. Chou, Mater. Des., 2020, 189, 108507 CrossRef CAS.
- J. Rouquerol, D. Avnir, C. W. Fairbridge, D. H. Everett, J. M. Haynes, N. Pernicone, J. D. F. Ramsay, K. S. W. Sing and K. K. Unger, Pure Appl. Chem., 1994, 66, 1739–1758 CrossRef CAS.
- X. Qin, J. Luo, Z. Liu and Y. Fu, Molecules, 2020, 25, 5730 CrossRef CAS PubMed.
- L. Wang, Z. Zhou, Y. Hu, Z. Cheng and X. Fang, Ind. Eng. Chem. Res., 2017, 56, 5802–5812 CrossRef CAS.
- F. Freund, in Proton Conductors, ed. P. Colomban, 1992, ch. 9, pp. 138–157, DOI:10.1017/cbo9780511524806.010.
- F. Freund and D. Sornette, Tectonophysics, 2007, 431, 33–47 CrossRef CAS.
- T. K. Pal, D. De, S. Senthilkumar, S. Neogi and P. K. Bharadwaj, Inorg. Chem., 2016, 55, 7835–7842 CrossRef CAS PubMed.
- S. Wu, H. L. Senevirathna, P. V. T. Weerasinghe and P. Wu, Materials, 2021, 14, 2640 CrossRef CAS PubMed.
Footnote |
| † Electronic supplementary information (ESI) available: PANI polymerization, schematic diagram of test circuit for conductivity measurement, homemade apparatus for measuring resistance vs. strain, woven and sewn yarn, SEM of degraded fibers. See DOI: https://doi.org/10.1039/d3ra04080a |
| This journal is © The Royal Society of Chemistry 2023 |

