DOI:
10.1039/D3RA05105F
(Paper)
RSC Adv., 2023,
13, 27934-27945
Evaluating the electrocatalytic activity of flower-like Co-MOF/CNT nanocomposites for methanol oxidation in basic electrolytes†
Received
28th July 2023
, Accepted 6th September 2023
First published on 20th September 2023
Abstract
Efficient electrocatalysts, with high tolerance to methanol oxidation, good stability, and acceptable cost are the main requisites for promising direct methanol fuel cell (DMFC) electrode materials. This target can be achieved by the integration of different active materials with unique structures. In this work, a cobalt metal–organic framework (Co-MOF) flower structure was prepared by a hydrothermal method, and then a simple ultrasonication method was employed to anchor carbon nanotubes (CNTs) in between the MOF flower petals and fabricate a Co-MOF/CNT hybrid composite. Different ratios of CNTs were used in the composite preparations, namely 25, 50, and 75 wt% of the composite. The nanocomposites were entirely investigated using different characterization techniques, such as XRD, FTIR, SEM, TEM, and XPS. Comparative electrochemical measurements confirmed that due to the integration of highly conductive CNTs with the porous active fascinating structure of Co-MOF, Co-MOF/50% CNTs exhibited improved electrocatalytic activity with a current density of 35 mA cm−2 at a potential of 0.335 V and a scan rate of 50 mV s−1. The excellent electrochemical activity and stability could be due to the synergy between Co-MOF and the CNTs that conferred adequate active sites for methanol electro-oxidation and a lower equivalent series resistance, as revealed from the electrochemical impedance spectroscopy study. This study opens a new avenue to decrease the utilization of platinum and increase the methanol oxidation activity using low-cost catalysts.
1. Introduction
There has been a rapid increase in global energy demand together with a rapid increase in fossil fuel price in recent years.1 In addition, environmental pollution has become a major global issue, leading to global warming and climate change.2 In order to reduce the environmental demand for clean and sustainable energy, intensive research is needed to develop various renewable and sustainable energy sources to deal with the severe energy crisis.3 The fuel cell is a device used to convert a chemical reaction into electricity, which is considered a zero-emission system when using hydrogen as the fuel.4 The anodic reaction of the fuel cell is a fuel oxidation reaction in which a fuel, such as hydrogen or methanol, is oxidized to produce electrons. Although much research has been done on direct methanol fuel cells (DMFCs) in recent years, due to their simple operation and low cost of methanol, some challenges still need to be addressed. These challenges include the slow response and slow kinetics of the methanol oxidation reaction on the surface of the anodic catalyst. These drawbacks hinder the extensive commercialization of DMFCs.5 Despite this, it is well known that rare and noble metals, such as Pt- and Ru-based electrocatalysts, have superior electrocatalytic activity to the methanol oxidation reaction, but to a large extent their high cost and scarcity still restrict their practical application.6,7 In addition, the strong affinity of Pt for poisoning by absorbing the intermediate species, such as CO or HCHO, that are produced during the methanol oxidation reaction (MOR) limits the large-scale usage of DMFCs.7,8 Consequently, the development of effective, reliable, and low-cost Pt-free MOR catalysts is considered a vital issue. Several catalysts based on non-noble transition metals, such as Mn, Co, Ni, Fe, and Cu, and their oxides have been widely used as possible alternatives due to their promising electrocatalytic activity.9,10
Recently, a new class of porous solid materials has emerged: metal–organic frameworks (MOFs) constructed from metal ions and organic ligands coordination bonds.11 MOFs are attracting attention due to their many unique properties, such as their controllable structures and composition, large surface area, high catalytic activity, good porosity, and excellent thermal stability.12,13 However, the poor chemical stability, low electrical conductivity, sluggish ion transference, and few exposed active sites of most MOFs restrict their use in electrochemical catalysis.8,14 To overcome these drawbacks, and enhance their surface area and conductivity, MOFs have been mixed with conductive carbon-supporting materials, such as graphene, graphene oxide (GO), porous carbon, carbon quantum dots, and carbon nanotubes (CNTs), in intriguing composites to enhance their electrical conductivity and ion transferability.15,16 Among all carbon materials, CNTs are recognized as having high potential as a carbon support material due to their high surface area, distinct catalytic characteristics, and high electrical properties. Dual composite CNT-based MOFs display synergistic features from both components, resulting in improved electrochemical activity, due to their enhanced conductivity, increased electroactive sites for reaction, short diffusion path for ions, and abundant redox reactions in basic electrolytes.17,18 Thus, different carbon-based nanocomposites as electrochemically active materials have been studied and evaluated in fuel cell applications.19,20
Recently, the cobalt metal–organic framework (Co-MOF) has demonstrated an effective electrocatalytic performance toward the oxygen reduction reaction (ORR), hydrogen evolution reaction HER, and oxygen evolution reaction (OER) with an acceptable current density.21 For instance, Mehek et al. prepared a Co-MOF and its composites with reduced graphene oxide (rGO) via a solvothermal method for the electrochemical oxidation of methanol with a current density of 29.1 mA cm−2.16 Also, Anchu et al. synthesized Co@CNT via the conventional pyrolysis method, and then tested this in the electrochemical oxidation of methanol, revealing a current density of 0.9 mA cm−2.22 However, these composites could only display a limited current density and stability.
The objectives of this work were to develop platinum-free, low-cost, and electroactive materials for the MOR with unique properties. To the best of our knowledge, this is the first report of a Co-MOF composite fabricated with CNTs with high electrochemical activity for methanol oxidation. So, in this work, the Co-MOF flower structure and its nanocomposite with CNTs were prepared as effective electrocatalytic materials for the methanol oxidation reaction (MOR) using a simple ultrasonication route. Different ratios of CNTs were used in the nanocomposites, namely 25, 50, and 75 wt%, to investigate their role in the MOR. The electrochemical performances of Co-MOF and Co-MOF/CNTs composites toward the MOR in a basic medium were compared. The newly flowered structure offered complementary features from (i) the high conductivity of CNTs, which could can improve the electron conductivity of the MOF, (ii) the anchoring of CNTs between the Co-MOF flower petals, which could provide open architectures that afford pathways for the ions and electrons. The Co-MOF/CNT composites exhibited extraordinarily high electrocatalytic activity toward the MOR with remarkable stability, suggesting their use as an alternative electrode material as an electrocatalyst.
2. Materials and methods
2.1. Materials
All the chemicals and reagents were purchased from Sigma-Aldrich with analytical grade quality and were used without further purification. The used chemicals were cobalt nitrate hexahydrate (Co (NO3)2·6H2O), 1,4 benzene dicarboxylic acid (BDC), N,N-dimethylformamide (DMF), sodium acetate CH3COONa·3H2O, methanol (MeOH), sodium hydroxide (NaOH), and distilled water.
2.2. Preparation of Co-MOF
Co-MOF was prepared via a hydrothermal method. Typically, in 30 mL of DMF, 0.49 mmol of Co (NO3)2·6H2O and 0.49 mmol of BDC were dissolved with continuous stirring. Then, the pH of the mixture was adjusted to 6 by adding several drops of 1.0 M aqueous solution of CH3COONa·3H2O. After homogenous mixing, the solution was transferred into a 100 mL Teflon-lined autoclave and heated at 120 °C for 12 h. After that, the autoclave was allowed to cool naturally to room temperature. Finally, the crystals were collected by centrifugation and washed with ethanol and distilled water three times. The product was finally dried at 60 °C for 6 h in a vacuum oven.
2.3. Preparation of CNTs
Highly purified MWCNTs were prepared via a chemical vapor deposition (CVD) technique as previously described in the literature.23 Briefly, 0.5 g of the Fe/Co catalyst was introduced into an alumina tube furnace. The catalyst was subjected to heating to 700 °C in a flow of nitrogen gas of 70 mL min−1. After 10 min heating at 700 °C, acetylene gas was introduced inside the alumina tube over the catalyst surface at a flow rate of 10 mL min−1 for 30 min together with the reduction of nitrogen gas to 30 mL min−1. The tube furnace was cooled to room temperature and the CNTs were finally collected.
2.4. Preparation of Co-MOF/CNTs
The Co-MOF/CNTs composite was prepared by a facile ultrasonication method. First, the as-prepared Co-MOF and CNTs were ground in a mortar and pestle, then dispersed in a mixture of 1![[thin space (1/6-em)]](https://www.rsc.org/images/entities/char_2009.gif) :
:![[thin space (1/6-em)]](https://www.rsc.org/images/entities/char_2009.gif) 2 (v/v) 50% CNT isopropanol/distilled water by ultrasonication for 1 h to produce a homogenous suspension of Co-MOF/CNT.24 Co-MOF/CNTs nanocomposites were prepared using different ratios of CNTs, namely 25, 50, and 75 wt%, to the overall mass of the nanocomposite. The resulting slurries were dried in a vacuum oven for 6 h at 60 °C.
2 (v/v) 50% CNT isopropanol/distilled water by ultrasonication for 1 h to produce a homogenous suspension of Co-MOF/CNT.24 Co-MOF/CNTs nanocomposites were prepared using different ratios of CNTs, namely 25, 50, and 75 wt%, to the overall mass of the nanocomposite. The resulting slurries were dried in a vacuum oven for 6 h at 60 °C.
2.5. Materials characterization
The crystalline structure of the synthesized materials was analyzed by X-ray diffraction (XRD) using an X-ray diffractometer (PANalytical, Empyrean, Netherlands) equipped with Cu Kα radiation of wavelength 1.54045 Å at an operating voltage of 40 kV with an operational current of 30 mA. Data were obtained using monochromatic Al K radiation from 10 to 1350 eV at a pressure of 109 mbar at a full-spectrum pass energy of 200 eV and a narrow spectrum of 50 eV for the X-ray photoelectron spectroscopy (XPS) analysis (K-ALPHA, Thermo Fisher Scientific, USA). The Fourier transform infrared (FTIR) spectra of the samples were recorded using a Vertex 70 system (Bruker, Germany) in the wavenumber region of 400–4000 cm−1 to predict the presence of the different functional groups. The surface morphologies of the samples were characterized by scanning electron microscopy (SEM, ZEISS, Sigma 500 VP). The microstructures and morphologies of the samples were characterized by high-resolution transmission electron microscopy (HR-TEM, JEM2100, Jeol, Japan), operated at an acceleration voltage of 200 kV. The textural characteristics, including the surface areas and pore-size distributions of the sample, were investigated using N2 adsorption–desorption isotherms, tested with a Tri-Star II 3020 (Micromeritics, USA) analyzer by applying the Brunauer–Emmett–Teller (BET) method.
2.6. Preparation of the working electrode
Alumina powder was used to clean a glassy carbon electrode (GCE) with a diameter of 3 mm prior to its usage. Then, this was washed with water and ethanol several times before being dried at room temperature. Subsequently, an ink slurry of 2 mg of the prepared materials, i.e., Co-MOF, Co-MOF/25% CNTs, Co-MOF/%CNTs, or Co-MOF/75% CNTs, was dispersed in 190 μL of 1![[thin space (1/6-em)]](https://www.rsc.org/images/entities/char_2009.gif) :
:![[thin space (1/6-em)]](https://www.rsc.org/images/entities/char_2009.gif) 2 (v/v) isopropanol/distilled water and 10 μL Nafion (5
2 (v/v) isopropanol/distilled water and 10 μL Nafion (5![[thin space (1/6-em)]](https://www.rsc.org/images/entities/char_2009.gif) wt%), then sonicated for 10 min at room temperature. After that, 15 μL of the catalyst ink was deposited onto a GCE tip with a micropipette. The modified GCE was then dried at 50 °C before the electrochemical measurements.
wt%), then sonicated for 10 min at room temperature. After that, 15 μL of the catalyst ink was deposited onto a GCE tip with a micropipette. The modified GCE was then dried at 50 °C before the electrochemical measurements.
2.7. Electrochemical measurements
The electrochemical measurements were recorded using NOVA 1.11 software with a potentiostat/galvanostat (AUTOLAB PGSTAT 302N, Metrohm, Switzerland). A standard three-electrode electrochemical cell was used at room temperature. The used reference electrode was Ag/AgCl, while the counter electrode was Pt sheet, and the modified GCE was used as the working electrode. A solution of 0.5 M NaOH was used as the electrolyte in the presence and absence of methanol to evaluate the electrocatalytic activity of the prepared electrodes. Cyclic voltammetry (CV) measurements were performed at scan rates from 10 to 100 mV s−1 in a potential window between 0 and 0.6 V. The chronoamperometry (CA) tests were measured at 0.6 V for 3600 s. Electrochemical impedance spectroscopy (EIS) analysis was performed at 0.6 V with 10 mV amplitude in a frequency range between 100 kHz and 0.01 Hz.
3. Results and discussions
3.1. Physicochemical properties
The crystalline structure of the as-prepared materials, namely CNTs, Co-MOF, Co-MOF/25% CNTs, Co-MOF/50% CNTs, and Co-MOF/75% CNTs, was characterized by powder XRD, and the diffraction patterns are shown in Fig. 1. For the CNTs, the peaks at 26.34° and 42.69° were characteristic of the CNT structure, conforming the interlayer spacing of the d (002) and d (100) reflection planes of carbon atoms.25,26 Based on the XRD results for pure Co-MOF, strong characteristic peaks of Co-MOF were observed at 10.50°, 14.44°, 18.50°, 21.50°, 33.50°, and 44.46°, which are assigned to Co-MOF, and indicating its successful preparation.27–30 Also, these were in excellent agreement with the JCPDS reference card (no 00-210-3335)31 as shown in Fig. S1.† It is clear that the Co-MOF composites (Co-MOF/25% CNTs and Co-MOF/50% CNTs) maintained the major diffraction peaks of Co-MOF and CNTs, as shown by the stars, which verified the successful formation of the Co-MOF/CNT composite, and indicating that the ultrasonication did not affect the structural integrity of the CNTs and MOF. On the other hand, some diffraction peaks of Co-MOF/75% CNTs appeared with small intensity and the other peaks disappeared due to the extra CNTs incorporation and with them being enveloped in the Co-MOF nanocomposite.32
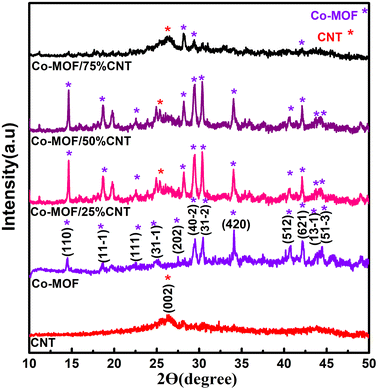 |
| | Fig. 1 XRD patterns of CNT, Co-MOF, Co-MOF/25% CNTs, Co-MOF/50% CNTs, and Co-MOF/75% CNTs. | |
3.2. FTIR
The FTIR spectra of the CNTs, Co-MOF, and Co-MOF composites are shown in Fig. 2, and S2.† The oxidized CNTs showed three characteristic peaks at 1050, 1700, and 3400 cm−1, which could be assigned to C–O and C![[double bond, length as m-dash]](https://www.rsc.org/images/entities/char_e001.gif) O vibration absorption in the –COOH group, and the –OH stretching vibration absorption of the carboxylic acid group introduced by the acid treatment, respectively as shown in Fig. S2.†33,34 Pure Co-MOF and its composites displayed strong peaks located at 1376 and 1566 cm−1, and these peaks were assigned to the symmetric and asymmetric stretching bands of the benzene carboxylate anion in the 1,4 benzene dicarboxylic acid linker, respectively.33,35,36 In addition, a peak at 3397 cm−1 appeared due to the coordinated –OH group of water molecules in the Co-MOF samples. The characteristic bands located at 752, 1025, and 1105 cm−1 were attributed to the para-aromatic stretching bands of the benzene ring.37,38 The new bands located at 512, 552, and 1377 cm−1 for all the Co-MOF samples were due to the M-O(Co–O)39 as shown in Fig. 2.
O vibration absorption in the –COOH group, and the –OH stretching vibration absorption of the carboxylic acid group introduced by the acid treatment, respectively as shown in Fig. S2.†33,34 Pure Co-MOF and its composites displayed strong peaks located at 1376 and 1566 cm−1, and these peaks were assigned to the symmetric and asymmetric stretching bands of the benzene carboxylate anion in the 1,4 benzene dicarboxylic acid linker, respectively.33,35,36 In addition, a peak at 3397 cm−1 appeared due to the coordinated –OH group of water molecules in the Co-MOF samples. The characteristic bands located at 752, 1025, and 1105 cm−1 were attributed to the para-aromatic stretching bands of the benzene ring.37,38 The new bands located at 512, 552, and 1377 cm−1 for all the Co-MOF samples were due to the M-O(Co–O)39 as shown in Fig. 2.
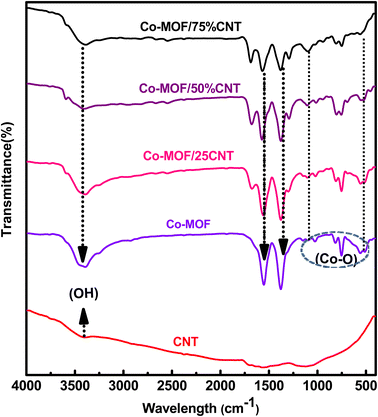 |
| | Fig. 2 FT-IR spectra of the CNTs, Co-MOF, and Co-MOF/25% CNTs, Co-MOF/50% CNTs, and Co-MOF/75% CNTs. | |
3.3. Morphological analysis
The morphological structure and textural properties of the prepared samples were studied by FESEM. As shown in Fig. 3(a and b), the Co-MOF displayed a hierarchical architecture formed by the stacking of numerous ultrathin sheet-like structures with each other, demonstrating a corn-flower-like structure with thin petals. Notably, the sheets displayed smooth surfaces with an ultrathin two-dimensional layered structure agglomerated with a thickness of about 25 nm. Fig. 3(c and d) display the low and high magnification images of the CNT structure composed of woven tubes connected to networks and held together by van der Waals forces in bundles.40 The morphology and surface structure of the Co-MOF nanocomposites with carbon nanotubes with different weight ratios were examined through FESEM, as shown in Fig. 4. The FESEM micrographs for the Co-MOF/25% CNTs at low and high magnifications are presented in Fig. 4(a and b). The images show interconnected tubes of CNTs held within a Co-MOF nanosheet. It is easy to distinguish between Co-MOF nanosheets and CNTs;41,42 whereas in Co-MOF/50% CNTs, as shown in Fig. 4(c and d), carbon nanotubes were incorporated between Co-MOF nanosheets and appeared as a fused layer, due to their smaller diameter than the distance between Co-MOF nanosheet layers. So, it was difficult to distinguish between Co-MOF nanosheets and CNTs. For Co-MOF/75% CNTs, as shown in Fig. 4(f and g), the FESEM images showed agglomerated CNTs surrounding the Co-MOF surface that block the structure.
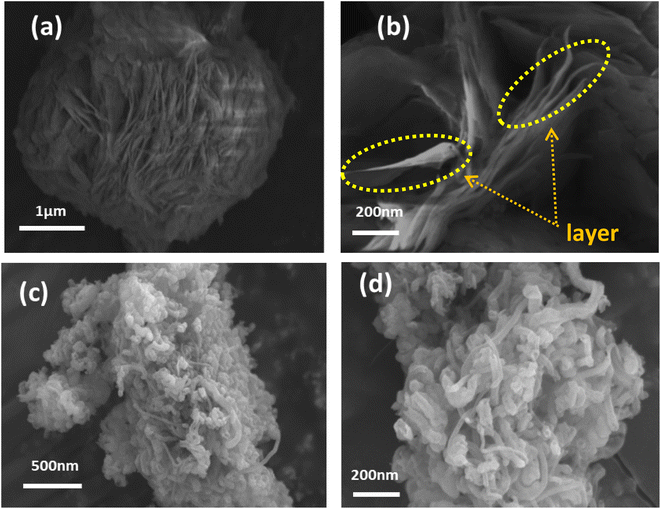 |
| | Fig. 3 FESEM images of Co-MOF (a, b) and CNTs (c, d) at different magnifications. | |
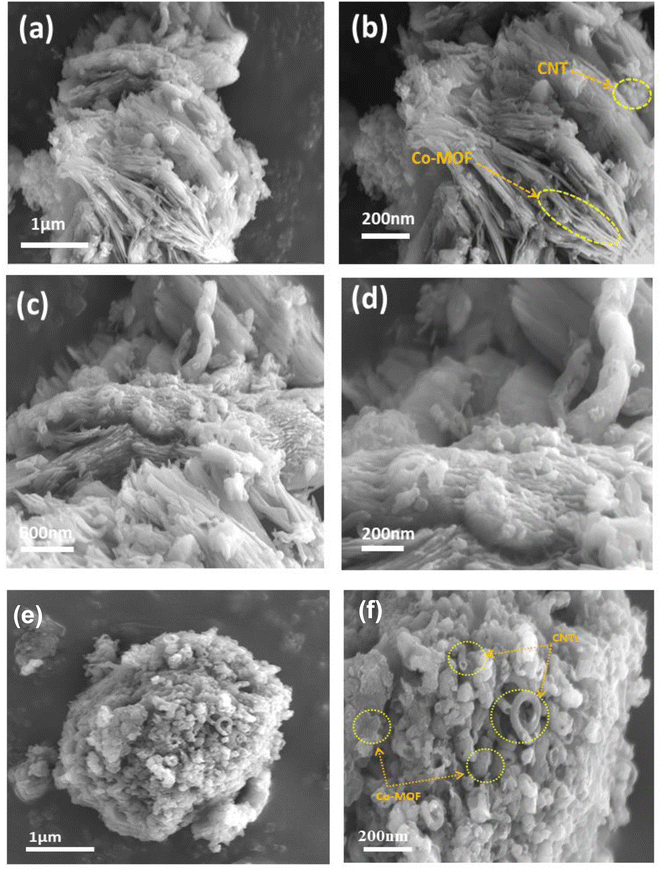 |
| | Fig. 4 FESEM images of Co-MOF composites with CNTs, Co-MOF/25% CNTs (a, b), Co-MOF/50% CNTs (c, d) and Co-MOF/75% CNTs (e, f). | |
Elemental mapping was used for the elemental analysis and chemical characterization of the catalysts (Fig. S3†). This confirmed the uniform distribution of the components and the presence of all the elements in the Co-MOF/50% CNTs catalyst by demonstrating the presence only of C, O, and Co elements associated with organic ligands, CNTs, and metals in the final structure of Co-MOF/50% CNTs, and therefore confirming the purity of the prepared materials.
Fig. 5 shows the HR-TEM images of Co-MOF, CNTs, and Co-MOF/50% CNT, providing evidence of their structures. The TEM images of Co-MOF are presented in Fig. 5(a), revealing the flower-like self-assembled structures of the Co-MOFs, which consisted of aggregated sheets, which was in good agreement with the SEM images. Fig. 5(b) shows the HR-TEM image of the CNTs, in which the tube structure can be clearly seen, with an average tube wall thickness of 12 nm and a tube diameter of 35 nm. The TEM images of Co-MOF/50%CNT, as shown in Fig. 5 (c and d), indicated that the carbon nanotubes were successfully incorporated between the Co-MOF sheets with lower aggregation, providing a large surface area and extra active sites for the MOR. The CNTs acted as supporting material for the Co-MOF, and the resulting structure formed 3D flower-like hybrid nanostructures.43
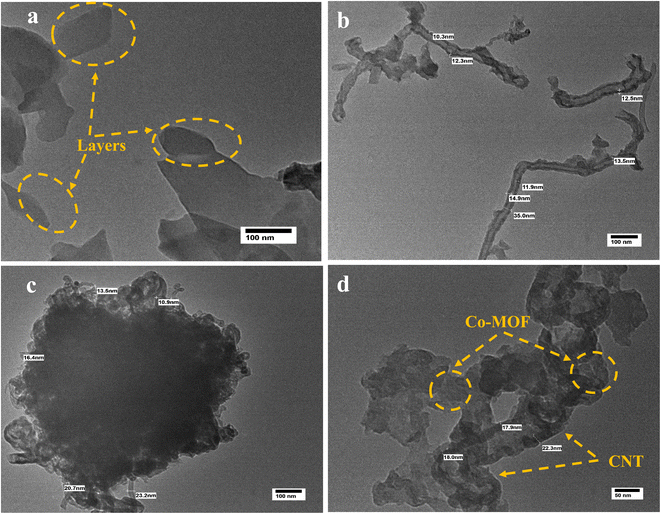 |
| | Fig. 5 HR-TEM images of Co-MOF (a), CNTs (b), and Co-MOF/50% CNTs (c and d). | |
3.4. BET surface areas
Using the BET surface areas approach, nitrogen adsorption/desorption isotherms of individual CNTs, Co-MOF, and their composites were measured. The obtained specific surface areas of the CNTs, Co-MOF, Co-MOF/25% CNTs, Co-MOF/50% CNTs, and Co-MOF/75% CNTs were 24, 13, 23, 28, and 33 m2 g−1, respectively, see Table 1. All the results showed that the carbon nanotubes were well incorporated between Co-MOF nanosheets and enhanced their surface area by increasing the CNT's percentage, which was in good agreement with the FESEM and HR-TEM findings. The N2 adsorption/desorption isotherms suggest that the synthesized material fall into the category of a typical IV isotherm, which corresponds to porous solid materials. In addition, in Fig. 6(a), the desorption part of the isotherm had a weak jump at P/P0 (0.4–0.9) with an open hysteresis loop, which is characteristic of mesoporous solids.44–47 The Barrett–Joyner–Halenda (BJH) method results for the determination of the pore-size distribution is shown in Fig. 6(b). All the materials were in the mesopore range, with a pore-size distribution between 10–20 nm. Furthermore, the hierarchically porous structure gave short pathways for ion transport and electron transfer, which could improve the MOR performance.23,48,49
Table 1 Textural properties of the Co-MOF and Co-MOF composites with CNTs
| Samples |
BET (m2 g−1) |
Pore volume (cm3 g−1) |
Mean pore diameter (nm) |
| CNTs |
24 |
0.0940 |
6.9720 |
| Co-MOF |
13 |
0.0382 |
3.0395 |
| Co-MOF/25% CNTs |
23 |
0.0534 |
2.9400 |
| Co-MOF/50% CNTs |
28 |
0.0760 |
3.0395 |
| Co-MOF/75% CNTs |
33 |
0.0982 |
3.0395 |
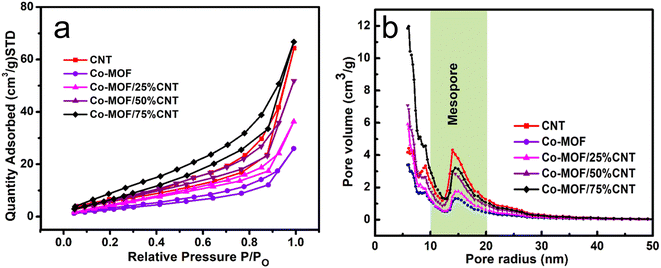 |
| | Fig. 6 (a) Nitrogen adsorption/desorption isotherms and (b) pore-size distribution curves of CNTs, Co-MOFs, Co-MOF/25% CNTs, Co-MOF/50% CNTs and Co-MOF/75% CNTs. | |
3.5. XPS analysis
XPS analysis was applied to investigate the surface configuration and the elemental chemical states of Co-MOF/50% CNTs. Fig. 7(a) shows the XPS wide-range spectrum of the synthesized Co-MOF/50% CNTs, which displayed three main peaks, notably signals for O 1s (531.3 eV), C 1s (285.3 eV), and Co 2p (780.9 eV) for the MOF/50 CNTs, confirming that the Co-MOFs were well coated on the CNTs surface. The high-resolution peak of O1s could be fitted into two peaks, as shown in Fig. 7(b). The characteristic peak at 532 eV corresponded to the bonding energy of C–O.50 The peak at 531.3 eV corresponded to Co–O bonding.45 Furthermore, the high-resolution peak of carbon could be deconvoluted into three peaks at 284.4, 285.3, and 288.5 eV, which were attributed to C–C, C–O, and C![[double bond, length as m-dash]](https://www.rsc.org/images/entities/char_e001.gif) O, respectively, as shown in Fig. 7(c).51,52 Co 2p1/2 and Co 2p3/2 were represented by two doublet peaks in the Co 2p spectra of the Co-MOF, as shown in Fig. 7(d), which could be distinguished at the binding energy peaks of 796.6 and 780.1 eV, respectively. While the deconvoluted peaks at 780.4 and 796.2 eV were attributed to Co3+, and the peaks at 782.3 and 797.3 eV to Co2+. At 782.99, 786.39, 803.9, and 804.1 eV, the four additional peaks could be attributed to satellite subpeaks of the Co3+ and Co2+ species. These results confirmed the successful fabrication of the Co-MOFs on the surface of the CNTs.14,53
O, respectively, as shown in Fig. 7(c).51,52 Co 2p1/2 and Co 2p3/2 were represented by two doublet peaks in the Co 2p spectra of the Co-MOF, as shown in Fig. 7(d), which could be distinguished at the binding energy peaks of 796.6 and 780.1 eV, respectively. While the deconvoluted peaks at 780.4 and 796.2 eV were attributed to Co3+, and the peaks at 782.3 and 797.3 eV to Co2+. At 782.99, 786.39, 803.9, and 804.1 eV, the four additional peaks could be attributed to satellite subpeaks of the Co3+ and Co2+ species. These results confirmed the successful fabrication of the Co-MOFs on the surface of the CNTs.14,53
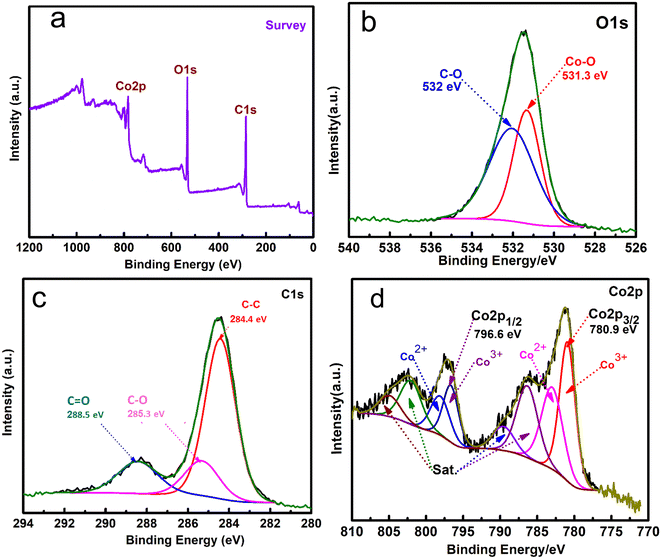 |
| | Fig. 7 XPS wide range elemental survey (a), high-resolution XPS spectra matched to O 1s (b), C 1s (c), and Co 2p (d), of Co-MOF/50% CNTs. | |
3.6. Electrochemical activity toward the MOR
The electrochemical activity of the prepared electrodes Co-MOF, Co-MOF/25% CNTs, Co-MOF/50% CNTs, and Co-MOF/75% CNTs toward methanol oxidation is shown in Fig. 8. Fig. 8(a) illustrates the activity of Co-MOF at different methanol concentrations. As can be seen, there was an increase in the produced current density upon increasing the MeOH concentrations from 0.25 to 3 M at a scan rate of 50 mV s−1. Also, Co-MOF displayed two redox anodic peaks at 0.11 and 0.4 V and a distinct redox cathodic peak at 0.25 V, which could be attributed to the automatic electrochemical redox reaction of the Co2+/Co3+ couple.14 Moreover, there was stability in the obtained current peak density with increasing the MeOH concentrations from 1 to 3 M, which might have been because the active sites for methanol adsorption had been used up, whereby increasing the methanol concentration did not improve the final activity and even prevented molecule diffusion.19 The same trends were obtained with MeOH addition to 0.5 M NaOH electrolyte for the Co-MOF/25% CNTs and Co-MOF/50% CNTs, as shown in Fig. 8(b and c), respectively. This behavior indicated that the MOR depended on the available active sites for methanol adsorption and the oxidation reaction was a diffusion-controlled process. On the other hand, a lower methanol activity was noticed for Co-MOF/75% CNTs with a current density as low as 1.7 mA cm−2, which may be due to the blockage of the active sites due to the aggregation of CNTs around the Co-MOFs.54
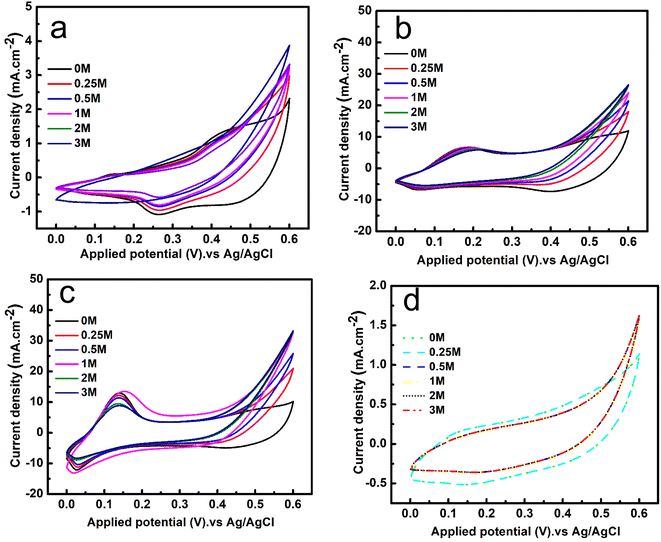 |
| | Fig. 8 CV curves of the Co-MOF (a), Co-MOF/25% CNTs (b), Co-MOF/50% CNTs (c), and Co-MOF/75% CNTs, and (d) at a fixed scan rate of 50 mV s−1 in 0.5 M NaOH and with various concentrations of methanol. | |
The onset potentials were measured for Co-MOF, Co-MOF/25% CNTs, Co-MOF/50% CNTs, and Co-MOF/75% CNTs toward methanol oxidation in alkaline media through CVs. As shown in Fig. S4,† the CV curves of the different samples in 0.5 M NaOH with and without 1 M methanol were measured. As well as the associations of the onset potential and the current density with the different CNTs ratios, the onset potentials were found to be 0.380, 0.424, 0.335, and 0.451 V (vs. Ag/AgCl), respectively. The Co-MOF/50% CNTs exhibited a strong oxidation current density (35 mA cm−2) in the presence of 1 M methanol, and a relatively low onset potential of methanol oxidation, which was 0.335 V, such that the Co-MOF/50% CNTs needed low energy for the redox reactions to occur. Consequently these materials exhibited acceptable electrocatalytic activity compared with the onset potentials results of previous research, as listed in Table 2.55,56
Table 2 Comparison of the catalyst material preparation methods, and the obtained current densities and onset potentials with those previously reported in the literature
| Catalyst |
Prep. method |
Scan rate (mV s−1) |
Current density (mA cm−2/mA mg−1) |
Onset potential |
Reference |
| CNT-PtMn-0.4 |
Coprecipitation |
100 |
31.24/− |
0.76 |
63 |
| PtCo CNCs |
Hydrothermal |
50 |
3.04/− |
— |
64 |
| Hollow CoP OCHs |
Heating/N2 gas |
5 |
−/206 |
0.40 |
65 |
| Ni/NiO/MWCNT |
Thermal method |
20 |
15.94/49.81 |
0.43 |
66 |
| Pt9·8Ru1/CNTs |
Thermal method |
50 |
−/196 |
0.58 |
67 |
| Co@CNT |
Solid mixture |
50 |
0.9/− |
0.45 |
22 |
| Co-MOF-71 |
Hydrothermal |
50 |
10.1/− |
0.71 |
68 |
| Co-MOF-71@GO |
Hydrothermal |
50 |
29.1/− |
0.60 |
68 |
| Co-MOF |
Hydrothermal |
50 |
4.5/30 |
0.38 |
This work |
| Co-MOF/25% CNTs |
Ultrasonication |
50 |
25/166.66 |
0.424 |
This work |
| Co-MOF/50% CNTs |
Ultrasonication |
50 |
35/233.33 |
0.335 |
This work |
| Co-MOF/75% CNTs |
Ultrasonication |
50 |
1.7/11.33 |
0.451 |
This work |
A comparison between the materials' electrochemical performance in 0.5 M NaOH and 1 M MeOH is presented in Fig. 9(a and b) with two different scan rates of 50 mV s−1 and 5 mV s−1. The effect of the CNTs content on the MOR activity in both scan rates was noticed. The results showed an increase in the oxidation peak's current density up to a CNTs content of 50% CNTs. The excellent catalytic performance of the Co-MOF/25% CNTs and Co-MOF/50% CNTs for the oxidation of methanol demonstrated that the conductive matrix of CNTs offered a good linkage with the Co-MOF, which may facilitate quick electron transfer into the active sites within the composites, and could potentially enhance the DMFC performance. The Co-MOF/75% CNTs exhibited a very low catalytic performance. Also, they possessed the highest surface area value as more CNTs were incorporated, and so the performance may be due to the aggregation and enveloping of the CNTs in the Co-MOF surface, which inhibited their catalytic activity toward methanol, as demonstrated in the SEM images in Fig. 4(f and g); this result was in good agreement with the XRD data, where most of the MOF peaks appeared weakened in comparison with the sole metallic Co-MOF. The Co-MOF/50% CNTs electrode displayed improved electrocatalytic activity toward the MOR with a peak at a current density of 35 mA cm−2 at 0.6 V and scan rate of 50 mV s−1. When compared to the result for Co-MOF, the Co-MOF/25% CNTs and Co-MOF/50% CNTs composites clearly displayed different redox peaks around 0.10–0.20 V, indicating Co2+/Co3+ redox couples, which were caused by the synergistic influence of the Co-MOF and CNTs, compared with the result for Co-MOF. The electrooxidation of methanol in DMFCs can be assessed using the redox couples as electroactive sites.4 The mass activity of all electrocatalysts was calculated from the ratio of the current density (J) vs. the deposited mass (m).57
| | |
Mass activity (M.A.) = J/m
| (1) |
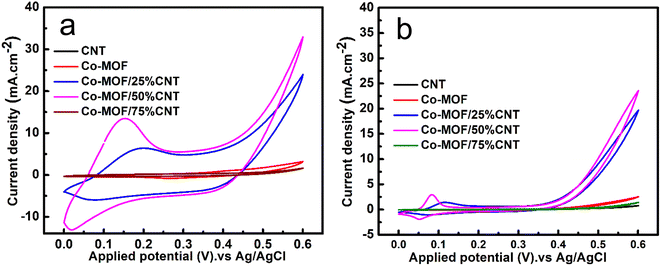 |
| | Fig. 9 CV curves of CNT, Co-MOF, Co-MOF/25% CNTs, Co-MOF/50% CNTs, and Co-MOF/75% CNTs (a) at 50 mV s−1 (b) at 5 mV s−1 in 0.5 M NaOH and 1 M methanol. | |
The mass activity (M.A.) of the measured samples was Co-MOF: 30 mA mg−1; MOF/25% CNTs: 166.66 mA mg−1; Co-MOF/50% CNTs: 233.33 mA mg−1; and MOF/75% CNTs: 11.33 mA mg−1, with the activity for the MOR in the order of Co-MOF/50% CNTs > Co-MOF/25% CNTs > Co-MOF > Co-MOF/75% CNTs. Moreover, the surface morphology of Co-MOF/50% CNTs in 1 M methanol at 50 mV s−1 maintained the same structure of CNTs distributed between Co-MOF layers as before utilizing them in methanol oxidation, confirming the stability of the material in the basic electrolyte, as illustrated in (Fig. S5†).
The stability of the electrocatalysts was investigated through chronoamperometric measurements, which were performed in a three-electrode system at a constant voltage of 0.6 V in 0.5 M NaOH and 1 M methanol solution for 3600 s, as shown in Fig. 10(a). In the first 60 s, there was an initial decline in the current density due to intermediate reactions, i.e., the adsorptions of Coadso, CHOadso, and COOHadso on the catalyst surface.16 After that, the current density decreased regularly and reached a quasi-stationary state until 3600 s. When the reaction started, the catalytic sites were readily available for forming the methanol coverage, but as time passed, an equilibrium layer of methanol formed on the surface, slowing down the reaction.58,59 After applying the set potential for 3600 s, the retention percentage value was highest for the Co-MOF/50% CNTs (87.6%), followed by Co-MOF/25% CNTs (74.3%), Co-MOF (62.8%), CNTs (64.3%), and Co-MOF/75% CNTs (54.9%). The long-term stability of the Co-MOF/50% CNTs was measured by cyclic voltammogram with continuous CV cycles. The current density retained by the catalyst after 500 cycles is presented in Fig. 10(b), showing it could retain 75% of the initial current after 500 cycles. This result could be assumed to indicate the blockage of the active sites by excessive bubbling produced during the methanol oxidation that covered the electrode surface. The sample stability tended to diminish with a reasonable ratio after repeated cycling due to the inhibition of electrolyte transportation toward the catalytic material, and the reduced electrochemical active surface area due to the continuous bubbling.57 This case can be resolved by refreshing the electrolyte by a following cathodic reduction (reverse scan) and performing CV for limited cycles. This study demonstrated good stability values in comparison with previous studies due to the good surface area, good scattering of CNTs in between the MOF flakes, and slight charge-transfer resistance.54
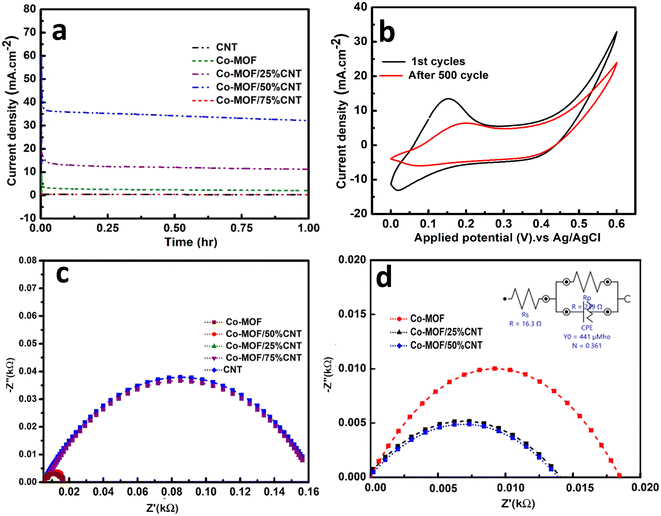 |
| | Fig. 10 Chronoamperometric curves of the electrodes (a), cyclic stability of Co-MOF/50% CNTs for 500 cycles (b), EIS Nyquist plots of the Co-MOF, Co-MOF/25% CNTs, Co-MOF/50% CNTs, and Co-MOF/75% CNTs catalysts (c), and the equivalent circuit model (d) in 1 M methanol + 0.5 NaOH. | |
Electrochemical impedance spectroscopy (EIS) is a powerful technique used to examine electrodes' conductivity by evaluating their resistance and the equivalent series resistance (ESR), and was applied here, as shown in Fig. 10(b) and (c). EIS was performed in a three-electrode electrochemical system at a potential of 0.6 V, and a frequency range between 10 to 100 kHz. The Nyquist plots could only be interpreted using the equivalent circuit shown as an inset in Fig. 10(c). From Fig. 10(b), lower semicircles were obtained for Co-MOF, Co-MOF/25% CNTs, and Co-MOF/50% CNTs, indicating the lower equivalent series resistance and higher conductivity for these composites with lower charge-transfer resistance (Rct). Fig. 10(c) shows that the lowest semicircle was obtained for Co-MOF/50% CNTs, with the lowest Rct of (0.0116 kΩ), which was remarkably smaller than those of Co-MOF (0.018 kΩ) and Co-MOF/25% CNTs (0.0116 kΩ), suggesting the fast and efficient electron transport for Co-MOF/50% CNTs. These data reveal the importance of the incorporation of MOF with CNTs, which reduces the resistance of CNTs and promotes its conductivity.
The proposed methanol oxidation reaction mechanism over the surface of the prepared catalysts involved some simple steps. Typically, the process followed eqn (2)–(9), comprising adsorption of methanol on the catalyst surface, methanol dissociation by C–H bond activation, the adsorption of water molecules followed by water activation, and finally, the oxidation of carbon monoxide into carbon dioxide. These steps occurred inside the pores that were formed by the connection of the units of Co-MOF together with CNTs. The suggested mechanism followed a series of reactions that led to Co oxidation on the catalyst surface, as shown below.60–62
| | |
Co-MOF + CH3OH → Co-MOF/(CH3OH)ads
| (2) |
| | |
Co-MOF/(CH3OH)ads → Co-MOF/(CH2OH)ads + H+ + e−
| (3) |
| | |
Co-MOF/(CHOH)ads → Co-MOF(COH)ads + H+ + e−
| (4) |
| | |
Co-MOF/(COH)ads → Co-MOF/(CO)ads + H+ + e−
| (5) |
| | |
Co-MOF + H2O → Co-MOF/(OH)ads + H+ + e−
| (6) |
| | |
Co-MOF/(COH)ads + Co-MOF/H2Oads → Co-MOF + CO2 + 3H+ + 3e−
| (7) |
| | |
Co-MOF/(H2O)ads + Co-MOF/(CO)ads → Co-MOF + CO2 + 2H+ + 2e−
| (8) |
| | |
Co-MOF/(OH)ads + Co-MOF/(CO)ads → Co-MOF + CO2 + H+
| (9) |
It is interesting that, when comparing the MOR activity of the prepared electrodes with the already published ones, higher activities were noticed for our materials, as shown in Table 2. All these findings suggest the potential use of Co-MOF/50% CNTs in the field of DMFCs as they possess a high current density, high stability, and lower electrode resistance.
4. Conclusions
This work reports the preparation of a flower-like structure Co-MOF via the solvothermal method and its combination with CNTs in different wt% through a simple sonication process. The Co-MOF/CNTs showed well-organized and stable methanol oxidation activities in an alkaline medium. The greatest electrochemical activity of the Co-MOF/50% CNTs composite over the other catalysts may be due to the existence of CNTs in the composite with fewer aggregations, higher active sites due to the open structure, and lower electrode resistance. These features endow the structure with great electronic conductivity, enhance the surface area, and facilitate ion transportation during redox reactions. Furthermore, in Co-MOF/50% CNTs, the acceptable percentage of CNTs, uniform distribution between Co-MOF layers, and co-existence of Co2+ and Co3+ oxidation states caused an increase in the current density from 4.5 mA cm−2 to 35 mA cm−2 at 0.335 V and a scan rate of 50 mV s−1, and improved its stability for up to 3600 s with a retention of 87.6%. Undoubtedly, the proposed strategy can be extended to open an avenue toward the synthesis of numerous composites of mixed-metallic MOFs with carbon-based material nanostructures to achieve low-cost, efficient, and stable catalysts for methanol oxidation in fuel cell applications.
Conflicts of interest
The authors declare that they have no competing interests.
References
- S. Sheikhi and F. Jalali, Int. J. Hydrogen Energy, 2021, 46, 10723–10738 CrossRef CAS.
- T. Noor, N. Zaman, H. Nasir, N. Iqbal and Z. Hussain, Electrochim. Acta, 2019, 307, 1–12 CrossRef CAS.
- S. Shafiee and E. Topal, Energy Policy, 2009, 37, 181–189 CrossRef.
- F. K. Chen, Y. H. Ho, H. W. Chang and Y. C. Tsai, Electrochem. Commun., 2020, 117, 106783 CrossRef CAS.
- L. Yaqoob, T. Noor, N. Iqbal, H. Nasir and N. Zaman, Catalysts, 2021, 11, 1–14 Search PubMed.
- L. Zhang, K. Doyle-Davis and X. Sun, Energy Environ. Sci., 2019, 12, 492–517 RSC.
- Y. Zhao, J. Liu, C. Liu, F. Wang and Y. Song, ACS Catal., 2016, 6, 4127–4134 CrossRef CAS.
- H. Tian, Y. Yu, Q. Wang, J. Li, P. Rao, R. Li, Y. Du, C. Jia, J. Luo, P. Deng, Y. Shen and X. Tian, Int. J. Hydrogen Energy, 2021, 46, 31202–31215 CrossRef CAS.
- Z. Wang, H. Jin, T. Meng, K. Liao, W. Meng, J. Yang, D. He, Y. Xiong and S. Mu, Adv. Funct. Mater., 2018, 28, 1–8 Search PubMed.
- N. Huang, L. Yang, M. Zhang, S. Yan, Y. Ding, P. Sun and X. Sun, ChemElectroChem, 2019, 6, 4522–4532 CrossRef CAS.
- A. E. Baumann, D. A. Burns, B. Liu and V. S. Thoi, Commun. Chem., 2019, 2, 1–14 CrossRef.
- S. Sheikhi and F. Jalali, Fuel, 2021, 296, 120677 CrossRef CAS.
- S. Soni, P. K. Bajpai and C. Arora, Charact. Appl. Nanomater., 2018, 2, 1–20 Search PubMed.
- M. Wang, C. Wang, L. Zhu, F. Rong, L. He, Y. Lou and Z. Zhang, Appl. Catal., A, 2021, 619, 118159 CrossRef CAS.
- A. Enaiet Allah, RSC Adv., 2023, 13, 9983–9997 RSC.
- R. Mehek, N. Iqbal, T. Noor, H. Nasir, Y. Mehmood and S. Ahmed, Electrochim. Acta, 2017, 255, 195–204 CrossRef CAS.
- S. Yu, Y. Wu, Q. Xue, J.-J. Zhu and Y. Zhou, J. Mater. Chem. A, 2022, 10, 4936–4943 RSC.
- A. H. Anwer, M. Z. Ansari, F. Mashkoor, S. Zhu, M. Shoeb and C. Jeong, J. Alloys Compd., 2023, 955, 170038 CrossRef CAS.
- R. Baronia, J. Goel, J. Kaswan, A. Shukla, S. K. Singhal and S. P. Singh, Mater. Renew. Sustain. Energy, 2018, 7, 1–13 CrossRef.
- H. Huang and X. Wang, J. Mater. Chem. A, 2014, 2, 6266–6291 RSC.
- R. K. Tripathy, A. K. Samantara and J. N. Behera, Dalton Trans., 2019, 48, 10557–10564 RSC.
- A. Ashok, A. Kumar, A. Yuda and A. Al Ashraf, Int. J. Hydrogen Energy, 2022, 47, 3346–3357 CrossRef CAS.
- M. Bahgat, A. A. Farghali, W. M. A. El Rouby and M. H. Khedr, J. Anal. Appl. Pyrolysis, 2011, 92, 307–313 CrossRef CAS.
- S. Krishnan, A. K. Gupta, M. K. Singh, N. Guha and D. K. Rai, Chem. Eng. J., 2022, 435, 135042 CrossRef CAS.
- S. Rani, B. Sharma, R. Malhotra, S. Kumar, R. S. Varma and N. Dilbaghi, Environ. Res., 2020, 191, 110005 CrossRef CAS PubMed.
- M. Bahgat, A. A. Farghali, W. M. A. El Rouby and M. H. Khedr, J. Anal. Appl. Pyrolysis, 2011, 92, 307–313 CrossRef CAS.
- T. Shahryari, V. Alizadeh, P. Kazemzadeh, S. Jadoun, N. P. S. Chauhan and G. Sargazi, Appl. Phys. A: Mater. Sci. Process., 2022, 128, 1–11 CrossRef.
- J. Cheng, S. Chen, D. Chen, L. Dong, J. Wang, T. Zhang, T. Jiao, B. Liu, H. Wang, J. J. Kai, D. Zhang, G. Zheng, L. Zhi, F. Kang and W. Zhang, J. Mater. Chem. A, 2018, 6, 20254–20266 RSC.
- Z. Maliha, Int. J. Energy Res., 2022, 1–12 Search PubMed.
- D. Y. Lee, I. Lim, C. Y. Shin, S. A. Patil, W. Lee, N. K. Shrestha, J. K. Lee and S. H. Han, J. Mater. Chem. A, 2015, 3, 22669–22676 RSC.
- J. A. Kaduk, Acta Crystallogr., Sect. B: Struct. Sci., 2002, 58, 815–822 CrossRef PubMed.
- L. Yaqoob, T. Noor, N. Iqbal, H. Nasir, N. Zaman and K. Talha, J. Alloys Compd., 2021, 850, 156583 CrossRef CAS.
- B. P. Vinayan, R. Nagar, V. Raman, N. Rajalakshmi, K. S. Dhathathreyan and S. Ramaprabhu, J. Mater. Chem., 2012, 22, 9949–9956 RSC.
- L. Y. Jun, N. M. Mubarak, L. S. Yon, C. H. Bing, M. Khalid and E. C. Abdullah, J. Environ. Chem. Eng., 2018, 6, 5889–5896 CrossRef CAS.
- D. S. Ahmed, A. J. Haider and M. R. Mohammad, Energy Procedia, 2013, 36, 1111–1118 CrossRef CAS.
- K. A. Wepasnick, B. A. Smith, K. E. Schrote, H. K. Wilson, S. R. Diegelmann and D. H. Fairbrother, Carbon, 2011, 49, 24–36 CrossRef CAS.
- Y. Liu, C. Wang, S. Ju, M. Li, A. Yuan and G. Zhu, Prog. Nat. Sci.: Mater. Int., 2020, 30, 185–191 CrossRef CAS.
- R. Yuniasari, F. Amri, S. A. Abrori, N. L. W. Septiani, M. Rezki, Irzaman, M. Z. Fahmi and B. Yuliarto, IOP Conf. Ser.: Mater. Sci. Eng., 2021, 1045, 012010 CAS.
- S. Farhadi, M. A. Ghasemzadeh and S. S. Aghaei, ChemistrySelect, 2019, 4, 729–736 CrossRef CAS.
- A. V. Abega, H. M. Ngomo, I. Nongwe, H. E. Mukaya, P. M. A. Kouoh Sone and X. Yangkou Mbianda, Synth. Met., 2019, 251, 1–14 CrossRef CAS.
- M. Lan, X. Wang, R. Zhao, M. Dong, L. Fang and L. Wang, J. Alloys Compd., 2020, 821, 153546 CrossRef CAS.
- Y. Li, M. Xie, X. Zhang, Q. Liu, D. Lin, C. Xu, F. Xie and X. Sun, Sens. Actuators, B, 2019, 278, 126–132 CrossRef CAS.
- T. V. M. Sreekanth, G. R. Dillip, P. C. Nagajyothi, K. Yoo and J. Kim, Appl. Catal., B, 2021, 285, 119793 CrossRef CAS.
- X. Liu, M. Hu, M. Wang, Y. Song, N. Zhou, L. He and Z. Zhang, Biosens. Bioelectron., 2019, 123, 59–68 CrossRef CAS PubMed.
- L. Hu, J. Xu, S. Zhao, X. Li, L. Li and L. Ran, Catal. Lett., 2021, 151, 2658–2672 CrossRef CAS.
- M. G. Radhika, B. Gopalakrishna, K. Chaitra, L. K. G. Bhatta, K. Venkatesh, M. K. Sudha Kamath and N. Kathyayini, Mater. Res. Express, 2020, 7(5), 054003 CrossRef CAS.
- M. M. Khalaf, H. M. A. El-lateef and V. Dao, Nanomater., 2022, 3429 Search PubMed.
- M. A. B. Meador, C. R. Alemán, K. Hanson, N. Ramirez, S. L. Vivod, N. Wilmoth and L. McCorkle, ACS Appl. Mater. Interfaces, 2015, 7, 1240–1249 CrossRef CAS PubMed.
- K. Chamindu, T. Clough, N. Jayarathne and S. M. Thomas, Soil Sci. Soc. Am. J., 2021, 383, 114737 Search PubMed.
- A. Muthurasu, G. P. Ojha, M. Lee and H. Y. Kim, J. Phys. Chem. C, 2020, 124, 14465–14476 CrossRef CAS.
- G. Gao, X. Wang, Y. Ma, H. Rong, L. Lai and Q. Liu, Ionics, 2020, 26, 5189–5197 CrossRef CAS.
- Z. Yan, J. Liu, Y. Lin, Z. Deng, X. He, J. Ren, P. He, C. Pang, C. Xiao, D. Yang, H. Yu and N. Du, Electrochim. Acta, 2021, 390, 138814 CrossRef CAS.
- Q. Chen, S. Li, H. Xu, G. Wang, Y. Qu, P. Zhu and D. Wang, Chin. J. Catal., 2020, 41, 514–523 CrossRef CAS.
- L. Yaqoob, T. Noor, N. Iqbal, H. Nasir, N. Zaman, L. Rasheed and M. Yousuf, ChemistrySelect, 2020, 5(20), 6023–6034 CrossRef CAS.
- J. H. Yang, X. Song, X. Zhao, Y. Wang, Y. Yang and L. Gao, Int. J. Hydrogen Energy, 2019, 44, 16305–16314 CrossRef CAS.
- M. Sarno, E. Ponticorvo and D. Scarpa, Chem. Eng. J., 2019, 377, 120600 CrossRef CAS.
- L. Yaqoob, T. Noor, N. Iqbal, H. Nasir and A. Mumtaz, Sci. Rep., 2021, 11, 1–19 CrossRef PubMed.
- T. Noor, S. Pervaiz, N. Iqbal, H. Nasir, N. Zaman, M. Sharif and E. Pervaiz, Nanomaterials, 2020, 10, 1–18 CrossRef PubMed.
- G. Behmenyar and A. N. Akin, J. Power Sources, 2014, 249, 239–246 CrossRef CAS.
- R. Mehek, N. Iqbal, T. Noor, H. Nasir and Y. Mehmood, Electrochim. Acta, 2017, 255, 195–204 CrossRef CAS.
- L. H. Mendoza-huizar, J. Angel, R. Colorado-peralta and G. A. Alvarez-romero, Inorg. Chim. Acta, 2021, 520, 120293 CrossRef.
- S. Liu, Y. Sun, Y. Wu, Y. Wang, Q. Pi, S. Li, Y. Li and D. Li, ACS Appl. Mater. Interfaces, 2021, 13(22), 26472–26481 CrossRef CAS PubMed.
- J. R. Rodríguez, Y. Verde-Gómez, J. N. Díaz de León, J. Antúnez-García, M. M. da Silva Paula, T. A. Zepeda, D. H. Galván and G. Alonso-Núñez, J. Mater. Res., 2021, 36, 4216–4226 CrossRef.
- Z. Li, X. Jiang, X. Wang, J. Hu, Y. Liu, G. Fu and Y. Tang, Appl. Catal., B, 2020, 277, 119135 CrossRef CAS.
- J. Xu, Y. Liu, J. Li, I. Amorim, B. Zhang, D. Xiong, N. Zhang, S. M. Thalluri, J. P. S. Sousa and L. Liu, J. Mater. Chem. A, 2018, 6, 20646–20652 RSC.
- M. B. Askari, P. Salarizadeh, M. Seifi and S. M. Rozati, Solid State Sci., 2019, 97, 106012 CrossRef CAS.
- X. Zhang, J. Ma, R. Yan, W. Cheng, J. Zheng and B. Jin, J. Alloys Compd., 2021, 867, 159017 CrossRef CAS.
- T. Novel, C. G. Oxide, A. R. Mehek, N. Iqbal, T. Noor, R. Mehek, N. Iqbal, T. Noor, H. Nasir and Y. M. Safeer, Electrochim. Acta, 2017, 255, 195–204 CrossRef.
|
| This journal is © The Royal Society of Chemistry 2023 |
Click here to see how this site uses Cookies. View our privacy policy here.  Open Access Article
 ba,
Ahmed A. Farghalia,
Waleed M. A. El Rouby
 a and
Abeer Enaiet Allah
 *c
*c
![[thin space (1/6-em)]](https://www.rsc.org/images/entities/char_2009.gif) :
:![[thin space (1/6-em)]](https://www.rsc.org/images/entities/char_2009.gif) 2 (v/v) 50% CNT isopropanol/distilled water by ultrasonication for 1 h to produce a homogenous suspension of Co-MOF/CNT.24 Co-MOF/CNTs nanocomposites were prepared using different ratios of CNTs, namely 25, 50, and 75 wt%, to the overall mass of the nanocomposite. The resulting slurries were dried in a vacuum oven for 6 h at 60 °C.
2 (v/v) 50% CNT isopropanol/distilled water by ultrasonication for 1 h to produce a homogenous suspension of Co-MOF/CNT.24 Co-MOF/CNTs nanocomposites were prepared using different ratios of CNTs, namely 25, 50, and 75 wt%, to the overall mass of the nanocomposite. The resulting slurries were dried in a vacuum oven for 6 h at 60 °C.
![[thin space (1/6-em)]](https://www.rsc.org/images/entities/char_2009.gif) :
:![[thin space (1/6-em)]](https://www.rsc.org/images/entities/char_2009.gif) 2 (v/v) isopropanol/distilled water and 10 μL Nafion (5
2 (v/v) isopropanol/distilled water and 10 μL Nafion (5![[thin space (1/6-em)]](https://www.rsc.org/images/entities/char_2009.gif) wt%), then sonicated for 10 min at room temperature. After that, 15 μL of the catalyst ink was deposited onto a GCE tip with a micropipette. The modified GCE was then dried at 50 °C before the electrochemical measurements.
wt%), then sonicated for 10 min at room temperature. After that, 15 μL of the catalyst ink was deposited onto a GCE tip with a micropipette. The modified GCE was then dried at 50 °C before the electrochemical measurements.
![[double bond, length as m-dash]](https://www.rsc.org/images/entities/char_e001.gif) O vibration absorption in the –COOH group, and the –OH stretching vibration absorption of the carboxylic acid group introduced by the acid treatment, respectively as shown in Fig. S2.†33,34 Pure Co-MOF and its composites displayed strong peaks located at 1376 and 1566 cm−1, and these peaks were assigned to the symmetric and asymmetric stretching bands of the benzene carboxylate anion in the 1,4 benzene dicarboxylic acid linker, respectively.33,35,36 In addition, a peak at 3397 cm−1 appeared due to the coordinated –OH group of water molecules in the Co-MOF samples. The characteristic bands located at 752, 1025, and 1105 cm−1 were attributed to the para-aromatic stretching bands of the benzene ring.37,38 The new bands located at 512, 552, and 1377 cm−1 for all the Co-MOF samples were due to the M-O(Co–O)39 as shown in Fig. 2.
O vibration absorption in the –COOH group, and the –OH stretching vibration absorption of the carboxylic acid group introduced by the acid treatment, respectively as shown in Fig. S2.†33,34 Pure Co-MOF and its composites displayed strong peaks located at 1376 and 1566 cm−1, and these peaks were assigned to the symmetric and asymmetric stretching bands of the benzene carboxylate anion in the 1,4 benzene dicarboxylic acid linker, respectively.33,35,36 In addition, a peak at 3397 cm−1 appeared due to the coordinated –OH group of water molecules in the Co-MOF samples. The characteristic bands located at 752, 1025, and 1105 cm−1 were attributed to the para-aromatic stretching bands of the benzene ring.37,38 The new bands located at 512, 552, and 1377 cm−1 for all the Co-MOF samples were due to the M-O(Co–O)39 as shown in Fig. 2.


![[double bond, length as m-dash]](https://www.rsc.org/images/entities/char_e001.gif) O, respectively, as shown in Fig. 7(c).51,52 Co 2p1/2 and Co 2p3/2 were represented by two doublet peaks in the Co 2p spectra of the Co-MOF, as shown in Fig. 7(d), which could be distinguished at the binding energy peaks of 796.6 and 780.1 eV, respectively. While the deconvoluted peaks at 780.4 and 796.2 eV were attributed to Co3+, and the peaks at 782.3 and 797.3 eV to Co2+. At 782.99, 786.39, 803.9, and 804.1 eV, the four additional peaks could be attributed to satellite subpeaks of the Co3+ and Co2+ species. These results confirmed the successful fabrication of the Co-MOFs on the surface of the CNTs.14,53
O, respectively, as shown in Fig. 7(c).51,52 Co 2p1/2 and Co 2p3/2 were represented by two doublet peaks in the Co 2p spectra of the Co-MOF, as shown in Fig. 7(d), which could be distinguished at the binding energy peaks of 796.6 and 780.1 eV, respectively. While the deconvoluted peaks at 780.4 and 796.2 eV were attributed to Co3+, and the peaks at 782.3 and 797.3 eV to Co2+. At 782.99, 786.39, 803.9, and 804.1 eV, the four additional peaks could be attributed to satellite subpeaks of the Co3+ and Co2+ species. These results confirmed the successful fabrication of the Co-MOFs on the surface of the CNTs.14,53


