 Open Access Article
Creative Commons Attribution 3.0 Unported Licence
Sol–gel synthesis of Eu3+ doped silica-gold nanorod composites with tunable optical properties†
José Raúl Montes-Bojorquezab,
Ofelia Hernández-Negrete *c,
Hilda E. Esparza-Ponce
 d,
Víctor Alvarez-Montañoc and
Javier Hernández-Paredes
 *a
*a
aDepartamento de Física, Universidad de Sonora (UNISON), Edificio 3F, Blvd. Luis Encinas J. y Rosales S/N Col. Centro, Hermosillo, Sonora C.P, 83000, Mexico. E-mail: jahernandezparedes@gmail.com
bMEMS Research Lab, Department of Physics and Astronomy, University of Texas at San Antonio, 1 UTSA Circle, San Antonio, TX 78249, USA
cDepartamento de Ingeniería Química y Metalurgia, Universidad de Sonora (UNISON), Edificio 5I, Blvd. Luis Encinas J. y Rosales s/n Col. Centro, Hermosillo, Sonora C.P, 83000, Mexico. E-mail: ochernandeznegrete@gmail.com
dCentro de Investigación en Materiales Avanzados S. C. (CIMAV), Miguel de Cervantes 120, Chihuahua, Chihuahua, C.P, 31136, Mexico
First published on 8th September 2023
Abstract
Gold nanorods (AuNRs) suspension at various concentrations was added into the sol–gel process to engineer nanostructured europium-doped silica host matrices as light-emitting composites. For this purpose, the samples were prepared following two different routes depending on the chemicals used as dopant and catalyst: (a) Eu(NO3)3·5H2O and HNO3, and (b) EuCl·6H2O and HCl. In any case, samples adding various concentrations of AuNRs suspension were prepared. The structural characterization of the samples was through STEM, backscattered electrons (BSE), and EDS analysis. Additionally, their optical properties were evaluated by PL spectroscopy and CIE colorimetry. The results confirmed that (a) methodology produced samples with AuNRs embedded and randomly distributed in the samples. However, these features were not observed in the samples obtained through (b) due to AuNRs dissolution in HCl media. Regarding the optical properties, the analysis of the relative intensity ratio 5D0 → 7F2/5D0 → 7F1 suggested that Eu3+ ions occupy non-centrosymmetric sites in (a) host matrices and centrosymmetric sites in (b). Hence, the increase of AuNRs suspension when fabricating (a) host matrices produced remarkable color changes in the luminescence of the samples towards the reddish-orange region. Meanwhile, the dissolution of AuNRs in (b) minimized the localized surface plasmon resonance (LSPR) effects on the Eu3+ luminescence. These findings revealed that the evaluation and selection of chemicals are critical factors when engineering these materials for more efficient coupling between the LSPR and Eu3+ luminescence.
Introduction
The sol–gel technique is a versatile route for the synthesis of materials with diverse morphological characteristics.1,2 For example, this technique is often used to produce low-cost amorphous silica in different shapes, such as blocks, films, and nanostructures, for various applications in science and technology.3–5Silica is a chemical compound that has attracted the attention of scientists and technologists as a result of its relatively low toxicity, minimal ecological impact, and low production costs.6,7 Therefore, silica is a suitable host matrix for diverse components such as atoms, ions, molecules, nanostructures, and particles.8 In this regard, the confinement of rare earth (RE) ions in silica hosts is a logical approach for engineering materials with luminescent properties because silica hosts can be easily fabricated in various shapes and sizes for their practical use.9–11 Furthermore, the overall optical response of the RE ions can be enhanced by altering their local environment with structural arrangements in the host matrix to produce luminescent materials with applications in lighting, laser technologies, optical imaging, and medicine, to give some examples.12,13
Among the RE ions, the Eu3+ shows distinctive luminescent bands in the visible region of the electromagnetic spectrum upon excitation with UV light. This feature can potentially be exploited to give characteristic red luminescence to materials.14 Besides, the optical response of Eu3+ can be dramatically changed because of its hypersensitive 5D0 → 7F2 transition, which is significantly affected by the local symmetry.14 Therefore, the contribution of the Eu3+ to the overall luminescence can be tuned by making structural changes in the silica host.
Likewise, it is known that noble metal nanoparticles, e.g., gold nanoparticles (AuNPs) or silver nanoparticles (AgNPs), have interesting optical properties as a result of their LSPR.15 According to the literature, when a nanoparticle shows LSPR, the intensity of the electromagnetic field can be enhanced up to several times in its proximity.16 Therefore, it is not surprising that this phenomenon can be further exploited for tuning the optical properties of diverse materials.17 Hence, some studies support using noble metal NPs to enhance the RE ions' luminescent properties.16
Herein, we report the addition of AuNRs suspension at various concentrations into the sol–gel process to obtain nanostructured composites based on europium-doped silica host matrices (SiO2:Eu3+). For this purpose, the methodology consisted of preparing a separate AuNRs suspension using the approach depicted by El Sayed.18 Then, AuNRs were incorporated into the sol–gel process to obtain the desirable nanostructured materials. For the sol–gel process, two different routes of synthesis were evaluated. The differences between these synthesis routes consisted of the chemicals used as dopants and catalysts: (a) Eu(NO3)3·5H2O and HNO3, and (b) EuCl·6H2O and HCl.
In the presence of acid catalysts, silicon alkoxides form dense and transparent silica gels with small pore sizes.19 In the literature on sol–gel, the reason for selecting a given acid is rarely explained. In contrast, the differences in the type of acid on the morphology and microstructure characteristics reported elsewhere20,21 have been attributed to the nucleophilic nature of each anion.22
In this work, nitric and hydrochloric acids were chosen as common catalysts along with europium nitrate and europium chloride, respectively, to minimize chemical complexity. In any case, samples adding various concentrations of AuNRs suspension were prepared. This methodology produced two series of composite materials structurally characterized using SEM, Backscattered Electrons BSE, and EDS analysis. Additionally, their optical properties were evaluated by PL spectroscopy and CIE colorimetry.
Materials and methods
Materials
AuNRs suspension was prepared with the following chemicals: hexadecyltrimethylammonium bromide CTAB (≥96%), benzyldimethylammonium chloride dihydrate BDAC (98%), sodium borohydride NaBH4 (99%), L-ascorbic acid (99%), HAuCl4·3H2O (≥49.0% Au basis), AgNO3 (≥99%) purchased from Sigma-Aldrich Mexico. Deionized water (18 MΩ) was used for these experiments.Europium-doped silica matrix with and without AuNRs were prepared with the following chemicals: tetraethoxysilane TEOS (98%), ethanol (99.5%), hydrochloric acid HCl (33–40%), nitric acid HNO3 (65–67%), europium(III)chloride hexahydrate EuCl·6H2O (99.99%), europium(III)nitrate hydrate Eu(NO3)3·5H2O (99.9%) purchased from Sigma-Aldrich Mexico. Deionized water (18 MΩ) was used for these experiments.
Synthesis
The preparation of the samples was carried out in two stages. First, the synthesis of AuNRs. Next, the synthesis of europium doped silica host matrices (a) and (b) adding various concentrations of AuNRs suspension (see Table 1). Pure silica host matrices were also prepared.| Sample | TEOS (mL) | Water (mL) | EtOH (mL) | Eu(NO3)3·5H2O 0.0597 M (mL) | HNO3 (μL) | AuNRs suspension (μL) |
|---|---|---|---|---|---|---|
| a0 | 0.60 | 0.45 | 1.95 | — | 150 | — |
| a1 | 0.60 | — | 1.95 | 0.45 | 150 | — |
| a2 | 0.60 | — | 1.95 | 0.45 | 150 | 100 |
| a3 | 0.60 | — | 1.95 | 0.45 | 150 | 200 |
| a4 | 0.60 | — | 1.95 | 0.45 | 150 | 400 |
| a5 | 0.60 | — | 1.95 | 0.45 | 150 | 800 |
| Sample | TEOS (mL) | Water (mL) | EtOH (mL) | EuCl·6H2O 0.0597 M (mL) | HCl (μL) | AuNRs suspension (μL) |
|---|---|---|---|---|---|---|
| b0 | 0.60 | 0.45 | 1.95 | — | 150 | — |
| b1 | 0.60 | — | 1.95 | 0.45 | 150 | — |
| b2 | 0.60 | — | 1.95 | 0.45 | 150 | 100 |
| b3 | 0.60 | — | 1.95 | 0.45 | 150 | 200 |
| b4 | 0.60 | — | 1.95 | 0.45 | 150 | 400 |
| b5 | 0.60 | — | 1.95 | 0.45 | 150 | 800 |
Firstly, a seed solution was prepared by mixing CTAB (5 mL, 0.20 M) with HAuCl4 (5 mL, 0.50 mM). Then, 0.60 mL of freshly prepared ice-cold NaBH4 (10 mM) solution was added under vigorous stirring. The resulting brownish seed solution was stirred for an additional 5 min and stored at 25 °C for 30 min to achieve complete decomposition of the remaining borohydride ions. According to the literature, the rapid reduction of HAuCl4 by NaBH4 yields the in situ formation of CTAB-capped AuNPs with an average diameter of a few nanometers.18
Next, a growth solution was prepared separately by mixing CTAB (5 mL, 0.20 M), AgNO3 (50 μL, 4 mM) and HAuCl4 (5 mL, 1 mM). After gently stirring the above solution, 80 μL of ascorbic acid (0.0788 M) was added to reduce Au3+ to Au1+, causing the color of the growth solution to change from dark yellow to colorless. Finally, 12 μL of seed solution was added to the growth solution. Upon addition of the seeds, Au1+ further reduces to Au0, inducing Au deposition onto the surface of the seed nanoparticles. The temperature of the experiment was controlled between 27–30 °C. The AuNRs growth was indicated by the gradual color change from colorless to dark blue within ∼30 min.18
The mechanisms behind the formation of AuNRs are still a subject of ongoing research. In the seed-mediated protocol, CTAB is a suitable surfactant for AuNRs synthesis because it is both a stabilizer and a structure-directing agent.23 CTAB assembles in rod-like micelles in an aqueous solution, which is expected to induce anisotropic growth on spherical particles.23 Furthermore, CTA+ cations of the CTAB molecules are electrostatically adsorbed to bromide anions bound to AuNR's surface, preventing particles from aggregating or coalescing during the synthesis.24 Several groups have proposed a more important role of the bromide counterion in anisotropic growth. However, CTAB remains the most employed surfactant.25
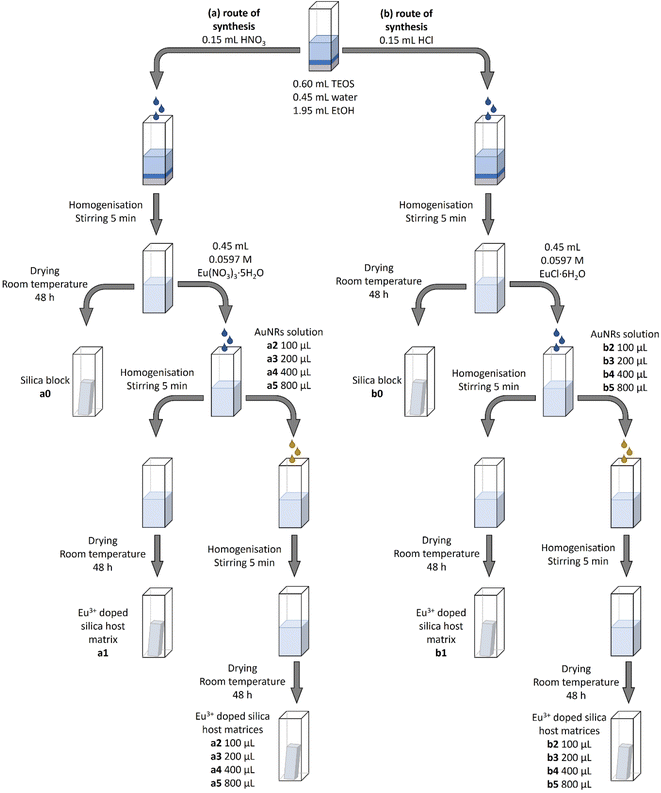 | ||
| Fig. 1 The synthesis routes used to obtain the intended nanostructured composites based on europium-doped silica host matrices. | ||
Europium-doped silica blocks were obtained by adding either 1% M of Eu(NO3)3·5H2O (a1–a5 samples) or EuCl·6H2O (b1–b5 samples) to TEOS, respectively (see Table 1). Then, the intended nanostructured composites based on europium-doped silica host matrices were obtained following the same methodology but adding AuNRs suspension at various concentrations as described in Table 1 and Fig. 1.
Characterization
UV-vis spectra were obtained using a PerkinElmer Lambda 10 spectrophotometer. STEM images were obtained using the JEOL JEM 2200FS+CS microscope. The BSE images were obtained using either the HITACHI SU3500 electron microscope equipped with XMaxN 50 SDD EDS for the elemental analysis or the JEOL JSM 7401F. The photoluminescence (PL) characterization was conducted using a Horiba Jobin-Yvon (FL-1005) spectrometer equipped with a 450 W Xe lamp. The PL emission spectra were obtained using 394 nm as excitation wavelength, and the PL excitation spectra were recorded by monitoring the 614 nm emission band. The (x,y) chromaticity coordinates were calculated from the PL emission spectra of the samples according to The Commission International de I'Eclairage (CIE system of colorimetry 1931).27Results and discussion
Gold nanorods (AuNRs)
Fig. 2a shows the AuNRs suspension obtained from the methodology reported in the literature.18 Its absorption spectrum comprises two maxima at 524 and 625 nm (see Fig. 2b), typically associated with the transversal and longitudinal plasmons, respectively. According to the literature, these values are consistent with an aspect ratio of 2.15, approximately.28,29 STEM images showed that the morphology of the AuNRs includes nanoparticles with different sizes and shapes (see Fig. 2c), but it is evident the presence of nanorods with low aspect ratio. Using the STEM images, we conducted a visual quantification: large 40.8 ± 5.5, width 23.8 ± 3.1 nm, and aspect ratio 1.7.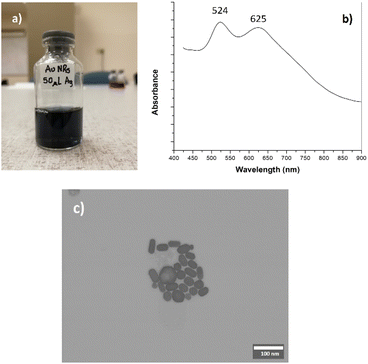 | ||
| Fig. 2 Gold nanorods (AuNRs) obtained by the seeding method [18]. (a) AuNRs suspension; (b) absorption spectrum and (c) STEM image (for better details, the readers are referred to the digital images provided as ESI†). | ||
Electron microscopy analysis
Fig. 3a and b show the BSE images of the cross-section of a5 and b5 samples, respectively. These samples were selected for the SEM analysis because they were fabricated with the highest volume of AuNRs suspension (see Table 1 and Fig. 1). It is worth mentioning that imaging the samples was difficult because their non-conductive characteristic produced considerable static surface charge. Since the AuNRs were sparsely populated on the surface of the analysis, this feature was another factor that caused difficulties in imaging the samples.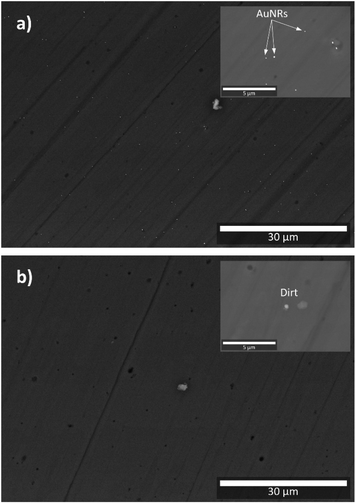 | ||
| Fig. 3 BSE images of: (a) a5 sample; (b) b5 sample. Insets correspond to samples observed at higher magnifications (for better details, the readers are referred to the digital images provided as ESI†). | ||
The BSE image of a5 shows small bright dots randomly distributed across the sample. Because of their high contrast, this feature can be attributed to the presence of AuNRs embedded in the a5 sample (see Fig. 3a). The inset in Fig. 3a is a BSE image of the cross-section of a5 at higher magnification, which shows in more detail the identified AuNRs. A closer examination at higher magnifications revealed that these bright spots are clusters comprised of a few AuNRs because their size can be up to 200 nm (see Fig. 4a and b), while the size of the AuNRs previously determined was 40.8 ± 5.5 nm large and 23.8 ± 3.1 nm wide (see Fig. 2).
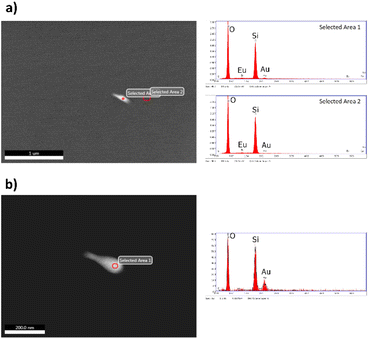 | ||
| Fig. 4 EDS analysis carried out on (a5) sample. In (a) the individual EDS analysis marked as selected area 1 over AuNRs and selected area 2 on the surface of the silica matrix correspond with the spectra to the left. In (b) EDS analysis was carried out at higher magnifications to improve local chemical analysis (for better details, the readers are referred to the digital images provided as ESI†). | ||
To estimate AuNRs population density in the cross-section of the a5 sample, we measured the number of bright spots per 204 μm2 (see Fig. S1†). For this purpose, we divided the micrograph shown in Fig. 3a into 25 rectangles of approximately 12 μm wide per 17 μm large (see Fig. S1†). Also, the following assumption was considered: an isolated bright spot is defined when it is notably separated from others, independently if it is a cluster of AuNRs. The results showed 5 ± 2 bright spots per 204 μm2 on average, indicating how the AuNRs are sparsely distributed on the a5 sample. Fig. S2† shows the results obtained in the a4 sample for comparison.
Fig. 4 shows the EDS analyses carried out in areas of different contrast on the a5 sample. The EDS analysis in the area with bright contrast indicated the presence of gold, but the signal was weak due to the small volume of the AuNRs compared to the host. Other important features that complicated the EDS analysis were that the AuNRs are embedded in the silica host and the non-conductive characteristic of the samples. Fig. 4b shows the EDS analysis of the same particle at higher magnifications to improve the chemical analysis.
SEM analysis confirmed the presence of AuNRs randomly distributed in samples obtained through the (a) synthesis route. In this case, the chemicals used during the sol–gel process did not have a negative impact on the stability of the AuNRs. On the other hand, no AuNRs were observed in the samples obtained through the (b) route of synthesis (see Fig. 3b). Thus, the use of EuCl·6H2O and HCl was not favorable to the stability of AuNRs, which is in good agreement with the literature.30,31
Luminescence
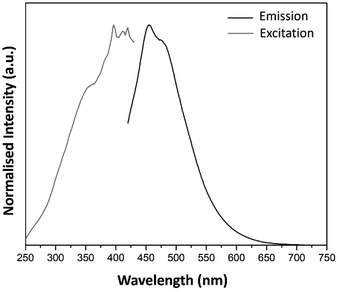 | ||
| Fig. 5 Excitation (λem = 453 nm) and emission spectra (λex = 394 nm) of pure SiO2 host matrix obtained by sol–gel technique. | ||
The PL emission spectra of a1–a5 and b1–b5 samples are shown in Fig. 6 and 7, respectively. The spectra were obtained upon excitation of the 7L6 state of Eu3+. Hence, 394 nm was selected because the PL excitation spectra of the samples suggested that this wavelength is effective when monitoring the hypersensitive 5D0 → 7F2 emission band of Eu3+.
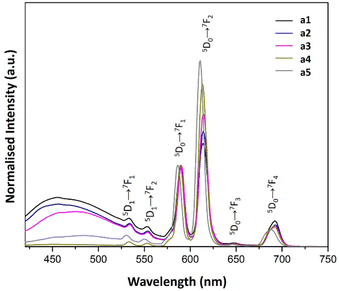 | ||
| Fig. 6 PL emission spectra of a1–a5 samples prepared with AuNRs suspension at various concentrations (λex = 394 nm). | ||
Besides, the analysis of the Eu3+ contribution to these spectra was conducted according to the following: the PL emission spectrum of the Eu3+ ion shows two distinctive bands associated with the 5D0 → 7F1 and the 5D0 → 7F2 transitions. While the former is not affected by the Eu3+ local symmetry, the latter is recognized as a hypersensitive transition greatly affected by the local symmetry and electric field around the Eu3+.14,33 According to the above arguments, we have normalized the emission intensities of the PL bands involving Eu3+ transitions, considering the 5D0 → 7F1 as a reference.14
Also, we can use the relative intensity ratio (5D0 → 7F2/5D0 → 7F1) as an indicator to determine whether the local symmetry of the Eu3+ ions is centrosymmetric or non-centrosymmetric. For this purpose, we calculated the integrated areas under the curves of the 5D0 → 7F2 and 5D0 → 7F1 bands to obtain the relative intensity ratio (see Table 2).
| Sample | 5D0 → 7F2/5D0 → 7F1 intensity ratio |
|---|---|
| a1 | 1.61 |
| a2 | 1.77 |
| a3 | 2.04 |
| a4 | 2.34 |
| a5 | 2.28 |
| b1 | 0.56 |
| b2 | 0.70 |
| b3 | 0.78 |
| b4 | 0.62 |
| b5 | 0.72 |
Regarding a1–a5 samples, the 5D0 → 7F2/5D0 → 7F1 relative intensity ratio shown in Table 2 suggested that the Eu3+ ions have a non-centrosymmetric environment. Furthermore, there is an enhancement in the intensity of the Eu3+ luminescence as the AuNRs concentration increases (see Fig. 6 and Table 2). In other words, adding AuNRs enhances the contribution of the Eu3+ ions to the overall luminescence of these samples. This characteristic gives the distinctive reddish-orange color emitted from the samples.
Another feature observed in the spectra of the a1–a5 samples is the presence of bands associated with transitions from a higher excited state of Eu3+, 5D1. This feature is more commonly observed in inorganic host lattices than in organic materials because, in molecular-based materials, non-radiative transitions are more favorable due to the degree of freedom of molecular species.14
The PL emission spectra of b1–b5 samples also showed the characteristic bands of the Eu3+ ion. Hence, apart from the PL band owned by the SiO2 matrix, the 5D0 → 7F1 transition was the most intense band. Thus, the contribution of the 5D0 → 7F2 band, which is recognized as a hypersensitive transition, was affected by the local symmetry of the Eu3+.14 According to Table 2, it is suggested that the dominant local environment of the Eu3+ ion in b1–b5 samples is centrosymmetric. Hence, the luminescent characteristics of Eu3+ resemble those found in water.34 This property is attributed to the presence of water and ethanol trapped in liquid form inside the host matrix since the samples were dried at room temperature. To remove solvent molecules more firmly attached to the host matrix, heating the samples at higher temperatures is necessary, but it is beyond the present study.
Table 2 also shows that the concentration of AuNRs suspension has little impact on the 5D0 → 7F2/5D0 → 7F1 relative intensity ratio in the b1–b5 samples, suggesting that adding AuNRs suspension did not cause significant changes in the local environment of Eu3+ ions.
On the other hand, the addition of AuNRs suspension in samples b1–b5 produced a blue shift of the host matrix emissions. Furthermore, increasing the concentration of AuNRs suspension enhanced the luminescence of the host matrix. Consequently, as the AuNRs suspension concentration increases, the band from 420–550 nm contributes significantly to the overall luminescence of the samples (see Fig. 7). This feature produced an intense blue contribution to the total emission, giving the blue variations of the b1–b5 samples.
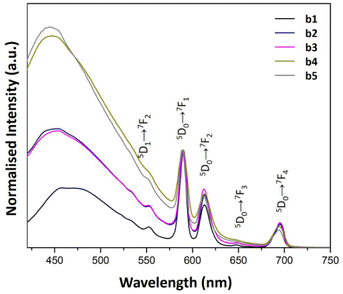 | ||
| Fig. 7 PL emission spectra of b1–b5 samples prepared with AuNRs suspension at various concentrations (λex = 394 nm). | ||
Samples b2 and b3 produced similar emission spectra (see Fig. 7). Nevertheless, there is a dependence on the intensity of the blue contribution in b4 and b5. These results suggested a discrete optical contribution to the overall luminescence of the samples for higher concentrations of AuNRs suspension.
The blue luminescence of the host matrix associated with oxygen defects was previously studied in detail.35 Hence, the characteristic SiO2 band around 459 nm was determined to be the result of defect luminescence caused by two-fold coordinated silicon centers due to oxygen deficit.36 In the present study, the complexity of the chemical mix during the sol–gel process may affect both the intensity and shift of the band due to the changes in the network that precursors and other chemicals induced during synthesis. In this regard, these substances could react to form complexes, which produce changes in the network and consequently alter the luminescent characteristics of the band. The study of the mechanisms involved in the changes observed in the luminescence of the matrix with the increase of AuNRs suspension is beyond the present work.
In addition, the enhancement in the intrinsic luminescence of the host matrix suggests that charge transfer may also occur between gold species and oxygen defects in the b1–b5 samples.16
From the above results, it is clear that the Eu3+ local environment is significantly affected by the europium salt and catalyst employed in the synthesis route. Furthermore, in both synthesis routes, the presence of Au influences the PL spectra, displaying concentration-dependent characteristics. Since BSE confirmed the presence of stable AuNRs in a1–a5 samples, the changes in the luminescent characteristics could be associated with the contribution of the LSPR of AuNRs in the vicinity of Eu3+ ions. On the other hand, the subtle increase in the 5D0 → 7F2 band found in the b1–b5 samples, where no AuNRs were observed, could be attributed to energy transfer between non-plasmonic gold species, e.g., small AuNPs, clusters and molecule-like gold particles, with Eu3+ ions.16
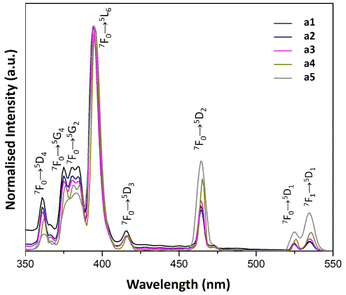 | ||
| Fig. 8 PL excitation spectra of a1–a5 samples prepared with AuNRs suspension at various concentrations (λem = 614 nm). | ||
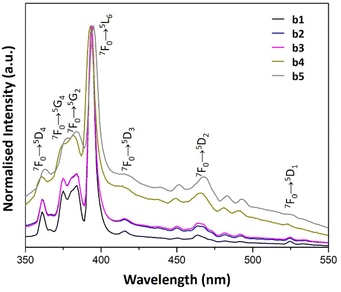 | ||
| Fig. 9 PL excitation spectra of b1–b5 samples prepared with AuNRs suspension at various concentrations (λem = 614 nm). | ||
The PL excitation spectra of a1–a5 samples showed sharp bands as the result of the electronic transitions of the Eu3+ ions. Besides, the characteristic transitions 7F1 → 5D1, 7F0 → 5D1 and 7F0 → 5D2 with maxima at 540, 530 and 470 nm enhance their intensity with AuNRs suspension concentration. This property could be responsible for the enhancement of Eu3+ luminescence in these samples because there is an overlap of the 7F1 → 5D1 and 7F0 → 5D1 bands with the LSPR bands of AuNRs (see Fig. 5 and 8). Therefore, the AuNRs sensitize the Eu3+ ions, enhancing their luminescence as observed in the corresponding emission spectra (see Fig. 6). On the other hand, the 7F1 → 5D2 band does not overlap with the LSPR window, but due to its hypersensitive nature, its intensity enhances with the increase of AuNRs concentration.
In contrast, the 7F1 → 5D1, 7F0 → 5D1 and 7F0 → 5D2 bands in the PL excitation spectra of the b1–b5 samples are not well-defined. The broadening of spectral lines observed in b1–b5 samples compared to a1–a5 samples results from the difference in the chemical environment of Eu3+ ions. The apparent increase in the excitation window between 350 and 550 nm can be seen as a result of the quenching of the 7F0 → 5L6 band. This feature could be responsible for the reduced contribution of the Eu3+ ions to the overall luminescence of these samples when increasing the concentration of AuNRs suspension.
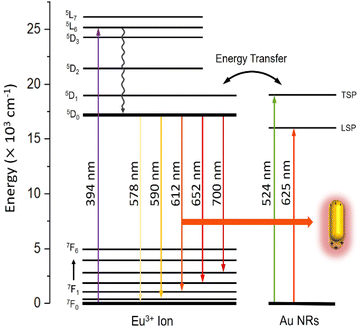 | ||
| Fig. 10 Proposed energy level diagram of Eu3+ ions in the vicinity of AuNRs showing the mechanisms for enhanced emission coupling in a1–a5 samples. | ||
In the vicinity of plasmonic AuNRs, Eu3+ ions can be more efficiently activated from the contribution of the LSPR, inducing a concentrated electric field. These intense local fields increased excitation at 450–550 nm observed in samples a2–a5 (see Fig. 8 and 10). It is worth mentioning that the excitation spectra of samples containing both Eu3+ ions and AuNRs do not show NP absorption characteristics. Therefore, energy transfer from excited AuNRs to Eu3+ ions is not likely to occur in these systems.38,39
Nonetheless, there is another effect that is potentially more important. AuNRs plasmonic bands overlap with the emission wavelengths corresponding to the 5D0–7Fj transitions of Eu3+ ions. In these conditions, an excited Eu3+ ion can interact with a nearby AuNR to induce a plasmon, which then can decay non-radiatively or re-radiate to the far field and create observable emission40 (see Fig. 10). Due to the combined nature of the emission, whose spectra remain the same as the fluorophore, the emission is said to come from a fluorophore-metal complex.41 At 394 nm excitation, it can be found that AuNRs mainly influence the emission process rather than the excitation process, with the hypersensitive 5D0 → 7F2 transition being the most affected.
It is apparent from a1–a5 samples that the PL emission shows a clear dependence on NP concentration. As the concentration increases, particles become closer to each other, so efficient plasmon coupling enhances the emission of Eu3+ and AuNRs species. It should be noticed that the influence of Eu3+ bands on the overall emission of a1–a5 samples, when compared to the silica band centered at 400 nm, reaches a maximum for sample a4. We attribute this effect to quenching for the sample with the highest concentration of AuNRs (a5), as the intensity of LSPR drops at a critical aggregation of NRs,42 reducing the emission of the Eu3+-AuNRs species.
CIE data
Fig. 11 shows the (x,y) chromaticity coordinates of the a1–a5 and b1–b5 samples plotted in CIE (1931) diagrams to display the correlated color temperature (CCT). In the case of a1–a5 samples, AuNRs produced more significant changes in the CCT. Hence, the color of the light emitted for the sample without AuNRs is also located in the white region of the CIE (1931) diagram. However, as the concentration of AuNRs increases, the color of the samples is remarkably tuned towards the reddish-orange region. This feature is attributed to the contributions of the LSPR, and it can be further exploited for designing novel materials with tunable optical properties for biotechnology, medicine, energy conversion, and lighting. However, sample a5 surpasses the critical aggregation of NRs, reducing the emission of the Eu3+ and AuNRs species and resulting in a blue-shift of the color emission.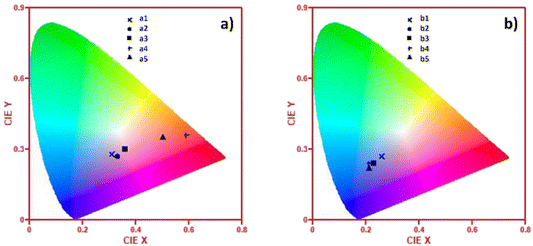 | ||
| Fig. 11 CIE 1931 chromaticity diagrams showing the (x,y) coordinates of: (a) a1–a5 samples and (b) b1–b5 samples. | ||
Conversely, in the b1–b5 samples, the low intensity of the Eu3+ luminescent bands, due to its local symmetry and the null contribution of AuNRs, produced light emitting in the white region in the CIE (1931) diagram. Hence, the concentration of Au species quenched the Eu3+-PL contribution and tuned the color of the samples towards the blue region.
Conclusions
The methodology described in this work helped to study the effects of the chemicals used for the fabrication via the sol–gel technique of nanostructured composite materials comprising AuNRs. In this regard, the BSE and EDS results suggested that structurally stable AuNRs on the silica host matrices highly depend on the chemicals used to synthesize these materials. In this regard, the synthesis route (a), which involved the use of Eu(NO3)3·5H2O and HNO3 as a dopant and catalyst, respectively, not only favored a better stabilization of the AuNRs but also enhanced the luminescent intensity of the Eu3+ ions. This feature was further strengthened by increasing the AuNRs suspension concentration in the a1–a4 samples as a result of the coupling between the emission and excitation luminescent bands of Eu3+ with the SPR of AuNRs. Hence, the hypersensitive transitions contributed significantly to the overall luminescence of the a1–a5 samples, tunning the color of the light emitted towards the reddish-orange region in the CIE (1931) diagram because of the intense contribution of Eu3+ ion to the overall luminescence of the sample. Hence, the activation of the 5D0 → 7F2 transition played an important role. On the other hand, chemicals such as EuCl·6H2O and HCl, used for the synthesis of b1–b5 samples, dissolved the AuNRs. These findings can help to set the basis for designing novel materials with tunable optical properties with applications in biotechnology, medicine, energy conversion, and lighting.Author contributions
J. R. Montes-Bojorquez: carried out experimental work (synthesis and PL experiments), analyzed, organized, and interpreted data. O. Hernández-Negrete: planned the work and strategies, analyzed data, interpreted data (microscopy), discussed results, and wrote the draft. H. E. Esparza-Ponce: planned and carried out experimental work (microscopy) and analyzed data. V. Alvarez-Montaño: analyzed data, planned strategies, and discussed results. J. Hernández-Paredes: conceived the idea, supervised the work, planned strategies, interpreted data, discussed results, and wrote the draft.Conflicts of interest
There are no conflicts to declare.Acknowledgements
The authors thank PRODEP México (grants no. 511-6/18-8537 and 511-6/2020-8599) and Universidad de Sonora (project USO315005524) for financing this work. We also thank the Department of Physics, Semiconductors Laboratory (DIFUS-UNISON), and CIMAV Chihuahua for allowing access to laboratories. We are grateful to Dr Rodrigo Meléndrez Amavizca (DIFUS) for granting access to PL measurements. J. R. Montes-Bojorquez thanks PRODEP México and Conahcyt for the financial support.References
- K. Baskaran, M. Ali, K. Gingrich, D. L. Porter, S. Chong, B. J. Riley, C. W. Peak, S. E. Naleway, I. Zharov and K. Carlson, Microporous Mesoporous Mater., 2022, 336, 111874 CrossRef CAS.
- M. Parashar, V. K. Shukla and R. Singh, J. Mater. Sci.: Mater. Electron., 2020, 31, 3729–3749 CrossRef CAS.
- A. Feinle, M. S. Elsaesser and N. Hüsing, Chem. Soc. Rev., 2016, 45, 3377–3399 RSC.
- T. H. Kim and K. C. Song, Colloids Surf., A, 2022, 647, 129105 CrossRef CAS.
- K. Sharma, A. Hooda, M. S. Goyat, R. Rai and A. Mittal, Ceram. Int., 2022, 48, 5922–5938 CrossRef CAS.
- K. Deshmukh, T. Kovářík, T. Křenek, D. Docheva, T. Stich and J. Pola, RSC Adv., 2020, 10, 33782–33835 RSC.
- Q. Lei, J. Guo, A. Noureddine, A. Wang, S. Wuttke, C. J. Brinker and W. Zhu, Adv. Funct. Mater., 2020, 30, 1909539 CrossRef CAS.
- G. J. Owens, R. K. Singh, F. Foroutan, M. Alqaysi, C.-M. Han, C. Mahapatra, H.-W. Kim and J. C. Knowles, Prog. Mater. Sci., 2016, 77, 1–79 CrossRef CAS.
- V. A. Kravets, E. V. Ivanova and M. V. Zamoryanskaya, J. Phys.: Conf. Ser., 2020, 1697, 012163 CrossRef CAS.
- C. Lin, Y. Song, F. Gao, H. Zhang, Y. Sheng, K. Zheng, Z. Shi, X. Xu and H. Zou, J. Sol-Gel Sci. Technol., 2013, 69, 536–543 CrossRef.
- B. M. Al-Shehri, A.-R. Khder, S. S. Ashour, A. M. Alhanash, M. Shkir and M. S. Hamdy, J. Non-Cryst. Solids, 2019, 515, 68–74 CrossRef CAS.
- I. Gupta, S. Singh, S. Bhagwan and D. Singh, Ceram. Int., 2021, 47, 19282–19303 CrossRef CAS.
- C. Zhu, Y. Yang, X. Liang, S. Yuan and G. Chen, J. Lumin., 2007, 126, 707–710 CrossRef CAS.
- K. Binnemans, Coord. Chem. Rev., 2015, 295, 1–45 CrossRef CAS.
- J. Zheng, X. Cheng, H. Zhang, X. Bai, R. Ai, L. Shao and J. Wang, Chem. Rev., 2021, 121, 13342–13453 CrossRef CAS PubMed.
- M. Eichelbaum and K. Rademann, Adv. Funct. Mater., 2009, 19, 2045–2052 CrossRef CAS.
- N. D. Thien, L. V. Vu and N. N. Long, Opt. Mater., 2018, 78, 319–324 CrossRef CAS.
- B. Nikoobakht and M. A. El-Sayed, Chem. Mater., 2003, 15, 1957–1962 CrossRef CAS.
- K. Kajihara, J. Asian Ceram. Soc., 2013, 1, 121–133 CrossRef.
- E. J. A. Pope and J. D. Mackenzie, J. Non-Cryst. Solids, 1986, 87, 185–198 CrossRef CAS.
- A.-M. Siouffi, J. Chromatogr. A, 2003, 1000, 801–818 CrossRef CAS PubMed.
- C. Huck-Iriart, N. J. Morales, M. L. Herrera and R. J. Candal, J. Sol-Gel Sci. Technol., 2021, 102, 197–207 CrossRef.
- B. Sun, G. Zhou, Y. Zhang, R. Liu and T. Li, Chem. Eng. J., 2015, 264, 125–133 CrossRef CAS.
- H.-W. Han, A. Joe and E.-S. Jang, J. Ind. Eng. Chem., 2021, 96, 202–212 CrossRef CAS.
- L. Scarabelli, A. Sánchez-Iglesias, J. Pérez-Juste and L. M. Liz-Marzán, J. Phys. Chem. Lett., 2015, 6, 4270–4279 CrossRef CAS PubMed.
- P. Innocenzi, From a Sol to a Gel, in The Sol-to-Gel Transition, Springer Nature, Switzerland AG, 2nd edn, 2019, pp. 21–37 Search PubMed.
- J. Schanda, CIE 1931 and 1964 standard colorimetric observers: History, data, and recent assessments, in Encyclopedia of Color Science and Technology, ed. R. Luo, Springer, Berlin, 2015, pp. 125–129 Search PubMed.
- B. Yan, Y. Yang and Y. Wang, J. Phys. Chem. B, 2003, 107, 9159 CrossRef CAS.
- S. Link and M. A. El-Sayed, J. Phys. Chem. B, 2005, 109, 10531–10532 CrossRef CAS.
- H. Shi, H. Bi, B. Yao and L. Zhang, Appl. Surf. Sci., 2000, 161, 276–278 CrossRef CAS.
- L. Li and Y.-J. Zhu, J. Colloid Interface Sci., 2006, 303, 415–418 CrossRef CAS PubMed.
- S. Okuzaki, K. Okude and T. Ohishi, J. Non-Cryst. Solids, 2000, 265, 61–67 CrossRef CAS.
- L. R. P. Kassab, D. S. da Silva and C. B. de Araújo, J. Appl. Phys., 2010, 107, 113506 CrossRef.
- D. Levy, R. Reisfeld and D. Avnir, Chem. Phys. Lett., 1984, 109, 593–597 CrossRef CAS.
- A. N. Trukhin, M. Goldberg, J. Jansons, H.-J. Fitting and I. A. Tale, J. Non-Cryst. Solids, 1998, 223, 114–122 CrossRef CAS.
- S. Banerjee and A. Datta, Langmuir, 2009, 26, 1172–1176 CrossRef PubMed.
- V. Levchenko, J. Lumin., 2018, 193, 5–9 CrossRef CAS.
- L. R. P. Kassab, D. S. da Silva, R. de Almeida and C. B. de Araújo, Appl. Phys. Lett., 2009, 94, 101912 CrossRef.
- D. Kumar, A. Dwivedi, M. Srivastava, A. Srivastava, A. Srivastava and S. K. Srivastava, Optik, 2021, 228, 166130 CrossRef CAS.
- S. Liang, C. L. John, S. Xu, J. Chen, Y. Jin, Q. Yuan, W. Tan and J. X. Zhao, Silica-Based Nanoparticles: Design and Properties, in Advanced Fluorescence Reporters in Chemistry and Biology II, ed. A.P. Demchenko, Springer, Berlin, Heidelberg, 1st edn, 2010, pp. 229–251 Search PubMed.
- J. R. Lakowicz, K. Ray, M. Chowdhury, H. Szmacinski, Y. Fu, J. Zhang and K. Nowaczyk, Analyst, 2008, 133, 1308 RSC.
- K. W. Chan, S. A. Rahman and Z. Aspanut, Mater. Chem. Phys., 2013, 140, 37–41 CrossRef CAS.
Footnote |
| † Electronic supplementary information (ESI) available: Analysis of AuNRs population in samples. See DOI: https://doi.org/10.1039/d3ra04652d |
| This journal is © The Royal Society of Chemistry 2023 |
