 Open Access Article
Creative Commons Attribution 3.0 Unported Licence
Computational approach for investigating nanoscale interfacial ice adhesion trends
Abhay Vincent *,
Marie Pervier
 ,
Hugo Pervier and
Devaiah Nalianda
SATM, Cranfield University, College Road, Cranfield, UK. E-mail: abhay.vincent@cranfield.ac.uk
First published on 12th December 2023
Abstract
For developing high performance, low-energy ice protection systems, it is vital to understand the icing physics at the interface of the ice and substrate. Macroscopic experiments have known limitations when it comes to explaining the adhesion characteristics of ice. There is a need to look at the microscale behaviour of ice and how it interacts with the surface it adheres on. The article describes application of molecular dynamics to the ice-substrate problem by modelling two major modes of ice adhesion test – tensile and shear tests, which are used for ice adhesion strength determination. The coarse-grained model of water is nucleated to form ice at the temperature which is designated for ice adhesion test on a macroscopic level. Steered molecular dynamics (SMD) is then applied to the nucleated ice cube to then obtain tensile and shear adhesion strengths over various FCC surface morphologies that represent the crystal structure of metallic substrates. The results obtained from the adhesion simulations are then used to compare the nanoscale trends on ice adhesion to the macroscale ice adhesion trends. The simulation results show that while contact area and temperature variations have similar trends to the observed macroscopic trends, other variations like tensile and shear loading rate variation at the nanoscale are not directly understood from macroscopic interpretations of ice adhesion.
Introduction
The dangers of icing are well known within the engineering domain. It can lead to hazardous conditions or in extreme cases, serious accidents that can even result in loss of life.1–4 Ice protection systems have thus been developed in order to counter the icing that occurs on engineering structures or systems in various civil and mechanical industries.5–7 The focus on improving these ice protection systems requires a deep understanding of how ice interacts with substrates. This is achieved by testing the ice adhesion strength of various surfaces that form part of the systems or structures which are exposed to icing conditions. Ice adhesion strength is defined as the maximum force required to detach ice from a substrate surface divided by the apparent contact area.8 Traditional methods of measuring ice adhesion strength include the various tensile and shear test methods that have been developed over the years.9 The brittle and complex mechanical behaviour of ice under different kinds of loads makes it difficult to understand the adhesion phenomena and predict accurately how ice might behave when subjected to an external force. Study of interfacial ice adhesion has been conducted extensively to understand the nature of ice and it's behaviour with respect to different substrates.10–13 It is important to analyse the atomistic ice adhesion behaviour to build a comprehensive model to determine behaviour of ice on various substrates. Nanoscale mechanisms of ice adhesion describe the effect of non-bonded interactions like van der Waals and electrostatic interactions being important to adhesion of ice to a substrate.14 An in-depth look at nanoscale fracture mechanics is necessary for our complete understanding of the ice adhesion phenomenon. Macroscale experiments are not the best possible tool when it comes to understanding ice-substrate interactions or adhesion mechanisms precisely because they don't provide access to nanoscale fracture mechanics. The spatial and temporal resolution of macroscale experiments is limited.The best suited tool for analysing nanoscale interactions of ice and substrate is atomistic modelling and molecular dynamics (MD) simulations. Atomistic water models can capture in more detail the solid–water interfacial region.15 It has been used in multiple studies for gaining further understanding of nanoscale ice adhesion mechanisms and interactions with various types of surfaces.16–19 Macroscopic ice adhesion trends have been studied in the past.20–23 These trends have been mostly consistent across the various studies for different factors that affect ice adhesion like temperature, contact area, loading rates etc. The previous literature reviewed for this research work shows that, these ice adhesion testing trends have not yet been studied at nanoscale. This paper describes the development of an ice-substrate atomistic model, based on known tensile and shear ice adhesion tests, using which ice adhesion strength values have been obtained for idealized FCC substrates. The variation in these adhesion strength values are studied with respect to the change in loading rate, temperature, contact area and surface morphology. These trends are then compared to the macroscopic test trends from literature to obtain the similarities or differences between the two scales which is the key contribution to knowledge from this paper. The results from this study can be fed into higher order models like crystal plasticity FEM models for ice adhesion or mesoscale ice formation models. These higher order models can be important tools for optimization of material design for ice protection in the future. The simulations are carried out in the software package called LAMMPS (Large-scale Atomic/Molecular Massively Parallel Simulator).24 Visualization of the models and the simulation results is done in the software package OVITO (Open Visualization Tool).25 For studying the various ice adhesion trends, a coarse-grained modelling strategy is adopted. The substrates for the coarse-grain model are generic Face Centred Cubic (FCC) surfaces of 4 different morphologies.
Background
The molecular dynamics simulations conducted in this research work reproduces a tensile and a shear adhesion test and replicate the mode of force application for both these types of tests. Although, many forms of such tests exist in industrial and research practice today, the two tests that this study focuses on, for a baseline to be used in the MD simulations, are the mode I test26 and Scrape adhesion test,27 both developed at Cranfield University. They have been described below.Mode I test
This test procedure for ice adhesion has been developed by Hammond.28 It is based off the Andrews & Lockington Blister Test. This test process makes use of a hollow cylinder which is covered partially by a small plastic disc. Ice is accreted on the cylinder to a significant enough thickness for the test to be in plane-strain conditions. The pressure is applied to the ice for delamination through the hole in the cylinder. The pressure is increased until the ice breaks of at a value called critical pressure, Pc. The failure can be categorized in 3 different ways: fully adhesive, fully cohesive, or partly adhesive and partly cohesive. Fig. 1 shows the setup for a mode I test with the accreted ice on top of the test substrate with the interfacial plastic disc acting as the defect. Cranfield modifications developed by Hammond includes connecting a vacuum pump in order to keep the plastic disc from falling when the icing tunnel is in operation. The surface of the cylinders faces the oncoming flow and is oriented as such. The plastic disc initiates the crack which means that the dimension of the flaw is known. The load rates can be varied based on the pressure rate applied. Finally, the calculation of the fracture energy needed to break the ice of the substrate can be achieved by the means of an analytical solution and using this method, the fracture toughness, and the tensile strength of ice can be ascertained as well. More details on the test procedure and setup, calculation of fracture energy and adhesion strength can be found in (ref. 26).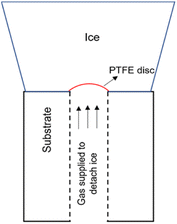 | ||
| Fig. 1 Mode I test design.8 | ||
Scrape adhesion test
The setup for the scrape adhesion test consists of a pipe, on which ice is accreted. A heated cutter is used to make a slot in the accreted ice such that a keyed guide shaft arm consisting of a scraping blade can be used for delamination of the ice. A load cell is used for capturing the recorded force values and a pneumatic actuator provides the requisite force to detach ice from the pipe surface in a shear manner. Fig. 2 shows the detailed design of the scrape adhesion test for a cylindrical pipe sample. Further details for the scrape test setup and test procedure can be found in (ref. 27).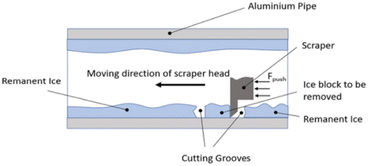 | ||
| Fig. 2 Scraper test design.27 | ||
Methods
Atomistic modelling
The crucial step in atomistic modelling of ice adhesion is to determine the correct water or ice model for simulation. Since, the intent of this research was to study the adhesion trends as they occur in a test setup, it is important that the ice is nucleated on the surface rather than beginning with a pre-defined ice block of any set description. Keeping in mind the simulation timescales required for water nucleation to ice using complex, higher order water models like TIP4P29 and SPC,30 the strategy to use coarse-grained modelling for this work was made. The coarse-grained models are created to simulate the behaviour of complex systems using a simplified or coarse-grained representation of the system. By decreasing molecular details in the modelling, these models can study system behaviours for much longer simulation times. Monoatomic water (mW) potential31 is used for modelling the water molecule in this work. In the coarse-grained mW model, each H2O molecule is treated as a single particle interacting through anisotropic short-ranged potentials (the Stillinger–Weber potential). Although explicit hydrogen atoms and electrostatic terms are not included, the mW model can correctly describe the thermodynamic properties and phase behaviour of water in bulk and on substrate. mW water model is able to replicate the melting point of hexagonal ice to a closer degree (274.6 K) when compared to other available atomistic models of water. It has been reported to reproduce the structural, thermo-dynamical properties of ice and water, and has been extensively applied to study the crystallisation of bulk water and nanodroplets as well as on different substrates.32The different atomistic models for the substrate in the coarse-grained model are defined as four different crystallographic planes of a generic FCC crystal: {111}, {100}, {110}, and {211} surfaces. These models exhibit significant differences in terms of atomic roughness and the symmetry of the outer crystalline layer. The surfaces were created using the Atomic Simulation Environment (ASE) package in Python.33 Due to the difference in surface morphology between the four different types of FCC crystallographic surfaces, the sizes of the models vary slightly along with the number of atoms that range from 8200 to 9250 for the four models. Also, important to note that for most studies on ice adhesion test microscopic trends, FCC111 was chosen as the main representative surface to be used with the water slab. A larger model was also created with the FCC111 lattice orientation, in order to study the effects of a larger contact area on the adhesion strength at the microscopic level. Both tensile and shear simulations were performed on this larger model. The lattice constant was chosen to be around 4.05 for all the surfaces to ensure a good packing density of atoms within the substrate structure and to have a closer match to Aluminium which is the standard material used in Mode I tensile adhesion tests.26 For the water structure, a random lattice of atoms is defined in LAMMPS with dimensions of 10 × 10 × 10 A0 to give around 4000 atoms in total and surface contact area of 1 nm2. This structure is then minimized and equilibrated at 300 K within the canonical ensemble (NVT) for 20 ns to generate the final structure which can be used for the coarse-grained combined model. Fig. 3 shows the four combined water and FCC model used in the coarse-grained models.
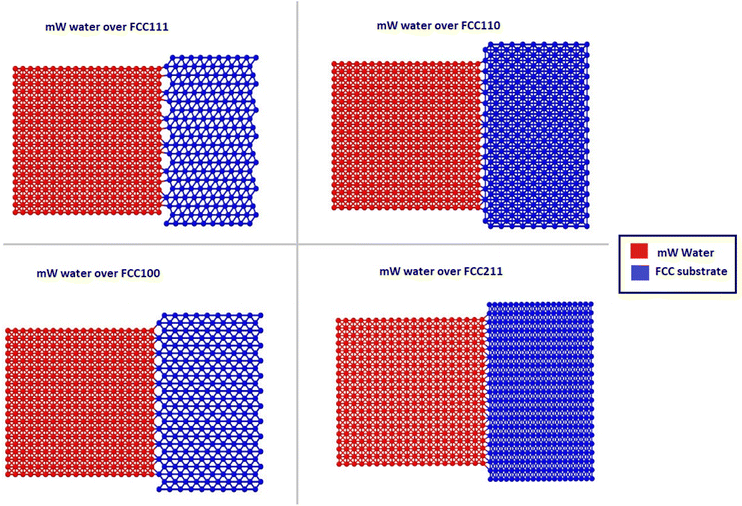 | ||
| Fig. 3 Four ice-substrate atomistic models to represent the different packing of atoms in the FCC substrates pre-equilibration. | ||
The individual FCC lattices have different configurations resulting in different packing densities hence a different number of atoms. The water structure is not directly placed on top of the substrate but separated by a distance of 2 A0. The process of energy minimisation is used to bring both the structures in contact.
Coarse-grained simulations
The coarse-grained potentials have no surface–surface interactions since they are supposed to be generic FCC structures to allow the water model to nucleate effectively on the surface. The surface–water/ice interactions are primarily defined by aluminium–oxygen interactions.35 The aluminium–hydrogen interactions are infinitesimal in comparison and thus are ignored for these simulations. The Lennard–Jones (LJ) potential for these interactions is based on the values defined in Mao et al.34 The main two parameters for the LJ interaction are given in Table 2.
| Parameter | Value |
|---|---|
| εAl–O | 0.053 eV |
| σAl–O | 2.858 Å |
Size effect: the cell is so small the amount of water molecules introduced can only grow in that direction for the box dimensions chosen.
• Geometric size effect: similar to the size effect but pertains more to the geometry of the simulation box which is in effect a square.
• Limitations of coarse graining: the unusual ice crystal growth could be a consequence of interactions at the interface being not captured well enough or being too non-directional, which leads to prismatic growth.
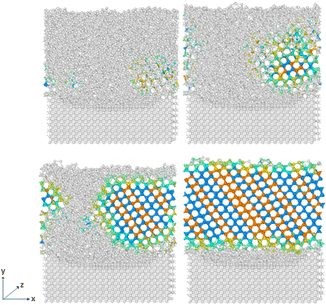
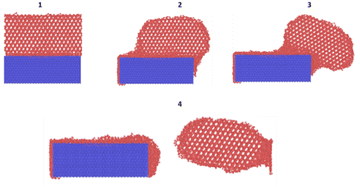
This particular approach with the coarse-grained models is significant in capturing this effect of unusual ice crystal growth on some of the substrates. This also reinforces the perceived complexity in modelling ice-substrate adhesion problem. In order to have a more comprehensive and detailed look at the ice adhesion to various substrates problem and extract useful data from it, there needs to be a consideration of other types of contact between ice and the substrate like basal and pyramidal contact with each relevant substrate surface. Fig. 4 shows the process that the water molecules reorganise themselves into the hexagonal close-packed structure associated with ice during the nucleation process.
Results and discussions
Atomistic ice detaching and shearing mechanics
Under the applied load, the ice substrate is delaminated from the substrate. This force is captured by the 7-vector output produced by the ‘fix smd’ within LAMMPS which gives the following quantities: the x, y, and z component of the pulling force, the total force in direction of the pull, the equilibrium distance of the spring, the distance between the two reference points, and finally the accumulated Potential mean force, PMF (the sum of pulling forces times displacement). The trends for adhesion tests were studied using idealized substrates and coarse-grained models. This facilitated faster computational times allowing for more flexibility and evaluation due to the rapid dynamics of potentials like mW. Although mode I test were used as a rough template for the simulations, it is clear that the models require further development for them to be an accurate replication. This is especially true in terms of the force replication. Mode I test employs pressurized Nitrogen through a hole in the substrate to dislodge the ice accreted on it.8 This was particularly challenging to replicate and needs further investigation in terms of the MD methods currently available. The trends observed have been discussed in more detail below.Ice adhesion strength value
The ice adhesion values found by this research work significantly higher than the ones observed at the macroscopic level. This is consistent with previous work done on ice adhesion in MD simulations.16,17,42 The values are way higher than those observed traditionally in macroscopic experiments which are around 1 MPa.8,43–46 This is mainly due to the loading rates used in molecular dynamics which are of 6–7 orders of magnitude higher than their macroscopic counterparts.Variation of adhesion strength with tensile loading rate
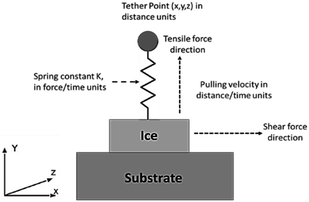
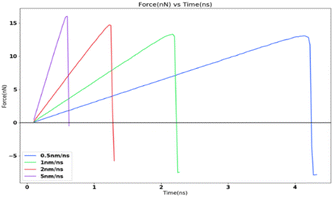
In order to study the effects of the tensile loading rate of the adhesion strength, the assigned spring velocity which represents the loading rate (displacement/time) was varied on the FCC111-ice combined coarse-grained model with lesser apparent contact area of 1 nm2. The temperature of the simulation was maintained at 251 K for all simulations and the NVT ensemble was used for the force-probe simulations. Fig. 7 shows the variation in the tensile force at different loading rates from 0.5 nm ns−1, 1.0 nm ns−1, 2.0 nm ns−1 to 5.0 nm ns−1. The value of adhesion strength and shear force obtained for these force-probe simulations are reported in Table 3. The values show an increase with increasing loading rates.| Spring velocity (nm ns−1) | Peak force (nN) | Adhesion strength (MPa) |
|---|---|---|
| 0.5 | 13.07 | 13![[thin space (1/6-em)]](https://www.rsc.org/images/entities/char_2009.gif) 071.77 071.77 |
| 1.0 | 13.32 | 13![[thin space (1/6-em)]](https://www.rsc.org/images/entities/char_2009.gif) 322.37 322.37 |
| 2.0 | 14.72 | 14![[thin space (1/6-em)]](https://www.rsc.org/images/entities/char_2009.gif) 726.48 726.48 |
| 5.0 | 16.02 | 16![[thin space (1/6-em)]](https://www.rsc.org/images/entities/char_2009.gif) 022.20 022.20 |
The simulation results show that the ice adhesion strength at nanoscale increases with increase in loading rate. Gold20 clearly states that the strength of ice depends on the rate of loading and the manner of the load application to the substrate apart from other factors involved in the process of failure. As noted by Kasaai et al.47 ice exhibits elastic behaviour at low strain rates and brittle behaviour at high strain rates. This in turn means that adhesive failure is more likely at low strain rates and cohesive failure at higher strain rates. This is observed in the results from this research work as well with all the coarse-grained models yielding cohesive or mixed failures. The trend of ice adhesion strength with tensile loading rate is not clear from macroscopic experiments as noted by Meng et al.23 The tensile strength shows little increment with the increase in loading rate. The tensile strength of ice reaches a maximum value at a specified loading rate. The tensile strength after this point, decreases with the loading rate continuing to go up. The tensile strength of ice reaches the maximum 3.3070 MPa at −40 degrees Celsius and the loading strain rate 0.3 kN s−1 (Fig. 8). Thus, it would be objectively wrong to state that the trend observed by the molecular dynamics simulations is actually the case in reality.
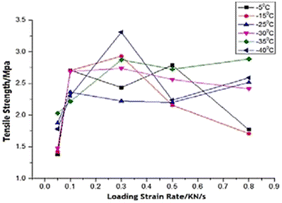 | ||
| Fig. 8 Relationship between tensile strength and loading rate.23 | ||
Variation of adhesion strength with shear loading rate
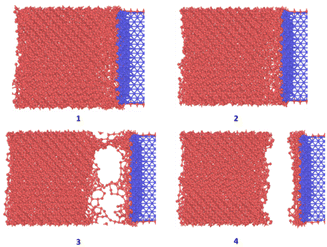
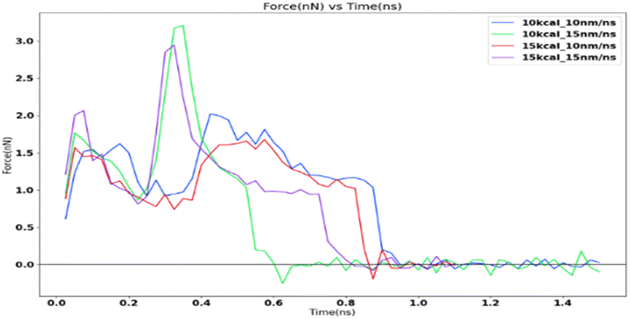
The ice structure was detached under the applied loading although the fracture is observed to be cohesive with a considerable residual layer left on the substrate. The strong interaction between the substrate and the ice atoms which is modelled after the aluminium–oxygen interactions using the LJ potential leads to a completely cohesive break.The force profile as shown in Fig. 9 is reminiscent of the saw-tooth pattern which is observed in shear test force profiles as observed by Xiao.16 The highest peak force was obtained for the 10 kcal spring constant and 15 nm ns−1 simulation. This is around 3.2 nanonewtons (nN). The corresponding shear adhesion strength was 3207.53 MPa. This is considerably higher than the shear strengths observed in actual macroscopic experiments around 500–2500 kPa.8 This is to be expected due to the higher loading rates in molecular dynamic simulations which is around 6–7 order of magnitudes than the macroscopic experiments.
Fig. 10 shows the sequence of ice detachment from the substrate under the applied load. The trend from the simulation shows that the increase in shear loading rate increases the adhesion strength. However, previous studies on analysis of ice shear strength with varying shear rates in experiments have stated that the peak shear strength slightly decreases with increasing shear rates.48 Solid ice is a kind of typical elastoplastic material. When the shear rate is slow, the ice crystal has enough time to shear slip, and it presents ductile failure characteristics. More loading rate data points are required to obtain a holistic picture of shear strength variation for ice with loading rate at the microscale.
Variation of adhesion strength with temperature
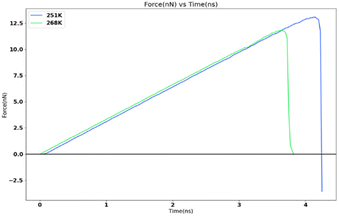
In order to study the variation of adhesion force and strength with temperature at nanoscale, the FCC111-ice combined model with lesser apparent contact area (1 nm2) was subjected to force-probe simulations with the same force and loading rate of 10 kcal mol−1 Ang−2 and 0.5 nm ns−1 at two different temperatures of 251 K and 268 K. These temperatures are similar to two different temperature settings that can be used in the mode I test at Cranfield Icing tunnel. The result from this simulation is reported in Fig. 11. There is a significant decrease in the adhesion force and strength when the temperature is increased from 251 K to 268 K. This is consistent with the observations from the Mode I test results.8 The adhesion strength value changes from 13![[thin space (1/6-em)]](https://www.rsc.org/images/entities/char_2009.gif) 071.77 MPa for 251 K to 11
071.77 MPa for 251 K to 11![[thin space (1/6-em)]](https://www.rsc.org/images/entities/char_2009.gif) 806.89 MPa for 268 K force-probe simulations.
806.89 MPa for 268 K force-probe simulations.
The simulation results show an increase in adhesion strength as the temperature is reduced. The literature study has shown contradicting results regarding this trend. As summarized in (ref. 47), various studies have shown different relationships between ice adhesion and temperature. Studies like Druez et al.49 reported a linear increase of adhesion strength of ice with reduction in temperature. This is consistent with the results observed for the various temperature settings used for Mode I test in the Cranfield Icing Tunnel.8 It was noted by Lack et al.50 that lower freezing temperature resulted in lower ice adhesion strength which is in direct contradiction to the observed trend in this work. Landy and Freiberger22 indicated that the variation in temperature may have two distinct effects based on the thermal coefficients of the ice and substrate:
• Ice adhesion strength should decrease with an increase in temperature if the thermal expansion coefficients of ice and substrate are considerably different from each other.
• if the difference in thermal coefficients of ice and substrate is not appreciable, the ice adhesion strength will vary inversely with the absolute value of the difference between the thermal expansion coefficients. The latter case practically never happens as per the study conducted.
Variation of adhesion strength with contact area
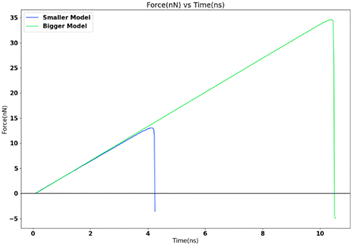
For studying the effect of contact area variation, two FCC111-ice coarse-grained models with varying dimensions and contact area (1 nm2 and 16 nm2) were subjected to a tensile load at 251 K. The tensile load was applied via SMD in LAMMPS with a spring force constant of 10 kcal mol−1 Ang−2 and 0.5 nm ns−1 spring velocity. The increase in apparent area of contact shows a clear decrease in the adhesion strength and significant increase in the detachment force as seen in Fig. 12. The adhesion strength varies from 13![[thin space (1/6-em)]](https://www.rsc.org/images/entities/char_2009.gif) 071.77 MPa for 1 nm2 model to 8467.56 MPa for 16 nm2 model with larger contact area.
071.77 MPa for 1 nm2 model to 8467.56 MPa for 16 nm2 model with larger contact area.
The adhesion strength depends on the contact area21 and is found to increase with a decrease in interfacial area. This trend is found to be consistent in the nanoscale simulations done as part of this research work.
Variation of adhesion strength with surface morphology
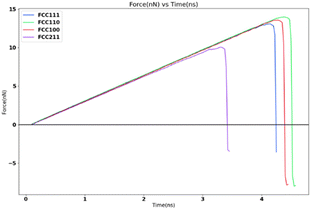
In order to study the effects of surface morphology on the adhesion strength at nanoscale, a tensile load is applied to the four different coarse-grained FCC lattice models with lesser apparent contact area (1 nm2) under the same simulation settings and temperature of 251 K. The tensile load is defined by the spring force constant of 10 kcal mol−1 Ang−2 and 0.5 nm ns−1 spring velocity. Fig. 13 shows the variation in the tensile force for the four surfaces, the values are captured from Table 4.| Surface | Peak force (nN) | Adhesion strength (MPa) |
|---|---|---|
| FCC211 | 10.06 | 10![[thin space (1/6-em)]](https://www.rsc.org/images/entities/char_2009.gif) 067.2 067.2 |
| FCC100 | 13.57 | 13![[thin space (1/6-em)]](https://www.rsc.org/images/entities/char_2009.gif) 572.2 572.2 |
| FCC110 | 13.98 | 13![[thin space (1/6-em)]](https://www.rsc.org/images/entities/char_2009.gif) 989.9 989.9 |
| FCC111 | 13.07 | 13![[thin space (1/6-em)]](https://www.rsc.org/images/entities/char_2009.gif) 071.7 071.7 |
The variation of ice adhesion strength with surface morphology is quite a complicated trend to explain. The variation in surfaces allowed for an interesting facet for exploration with regards to study of ice adhesion strength. As noted by Fitzner et al.,38 the nucleation dynamics of water into ice over the different FCC lattices shows the following trend:
• The different FCC surfaces are shown to mostly promote heterogenous nucleation compared to homogeneous nucleation.
• The {111} and {110} surfaces were seen to promote ice nucleation over a much broader range than the {211} and {100} surfaces.
• It was also noticed that surface symmetry alone was definitely not enough to account for such a difference. In fact, the {111} and {110} surfaces possess different symmetry (hexagonal and rectangular respectively).
• Fig. 14 shows the various regions with respect to the different surfaces that nucleate the ice. This analysis was performed by Fitzner et al.38
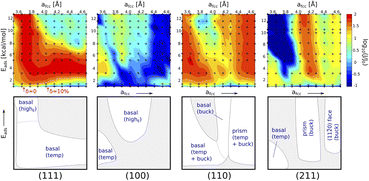 | ||
| Fig. 14 Heat maps representing the values of ice nucleation rates on top of the four different surfaces and sketches of the different regions (white areas) in the space with significant enhancement of the nucleation rate.37 | ||
This might explain the variation observed with the adhesion strength with the FCC110 surface showing highest ice adhesion strength with the FCC111 showing the second highest. However, this needs further study. There is no literature found in the macroscopic regime with respect to this trend which is understandable since this work cannot be conducted with traditional ice adhesion experimental procedures.
Conclusions
The ice adhesion trend analysis was conducted with the use of molecular dynamics simulation. Several variations of these simulations were conducted to study the variation of the ice adhesion strength with loading rates, contact area, temperature, and surface morphology. More data points in general with respect to loading rate in both shear and tensile regimes, contact area and temperature would make for a better and more comprehensive future study. This work has tried to co-relate these trends observed using MD simulations with the trends at macroscopic level. Some of the trends are clearly similar while others need more exploration. It's important to note that research work clearly shows the difficulty in the transability of results from the macroscopic to the nanoscale regime using MD simulations. The applied force for delamination in these simulations operate as a figure-of-merit rather than actual atomic forces. Certain variables like stress and strain do not directly translate at the nanoscale level from the macroscopic level. Usually, it's not virial stress that is computed in these simulations. The strain rates are several degrees higher than the macroscopic regime and thus the results are not one-to-one. However, even with these limitations on the creation of atomic models and the results obtained, it is still worthwhile performing and further exploring the ice-substrate problem using molecular dynamics. The results although not accurate when compared to macroscopic experiments, can still be utilised to create mesoscale models (for e.g.: based on crystal plasticity finite element method (FEM) modelling). These models can be used to study in greater depth, the behaviour of ice on various substrates which is not possible from macroscopic experiments or even engineer more specific substrates. Size effects to study how change in simulation box size, aspect ratio and orientations affect the adhesion strength results and nucleation dynamics is an interesting path for further work. Thermal expansion coefficient study and analysis of structural changes of ice with respect to change in temperature would also be of interest for future work in refining this ice-substrate model study.Conflicts of interest
There are no conflicts to declare.Acknowledgements
This work was partially funded by the ERICE project from Clean Sky 2 Joint Undertaking (CSJU) under grant agreement no. 821301. The JU received support from the European Union's Horizon 2020 (H2020) research and innovation programme and the Clean Sky 2 JU members other than the Union.Notes and references
- G. SD, “A study of U.S. inflight icing accidents and incidents, 1978 to 2002”, in 44th AIAA Aerospace Sciences Meeting and Exhibit, 2006 Search PubMed.
- C. C. Ryerson, Ice protection of offshore platforms, Cold Reg. Sci. Technol., 2011, 65(1), 97–110 CrossRef.
- L. Gao and H. Hu, Wind turbine icing characteristics and icing-induced power losses to utility-scale wind turbines, Proc. Natl. Acad. Sci. U.S.A., 2021, 118(42), e2111461118 CrossRef CAS PubMed.
- E. Andenæs, B. P. Jellea, K. Ramloa, T. Kolås, J. Seljd and S. E. Foss, The influence of snow and ice coverage on the energy generation from photovoltaic solar cells, Sol. Energy, 2018, 159, 318–328 CrossRef.
- H. Rosenthal, D. Nelepovitz and H. Rockholt, “De-Icing of Aircraft Turbine”, FAA Technical Center, Chula Vista, California, 1988 Search PubMed.
- N. Kool, D. Orchard and G. Chevrette, “Testing of Elastomer Icephobic Coatings”, AIAA, Atlanta, US, 2018 Search PubMed.
- P. Beeram, R. Waldman and H. Hu, “Ice Adhesion Measurements of Ice Mitigation Coatings Pertinent to Aircraft Icing”, in 9th AIAA Atmospheric and Space Environments Conference, Denver, Colorado, 2017 Search PubMed.
- M.-L. Pervier, “Mechanics of Ice Detachment Applied to Turbomachinery”, Cranfield University, Cranfield, 2012 Search PubMed.
- M. Schulz and M. Sinapius, “Evaluation of Different Ice Adhesion Tests for Mechanical Deicing Systems”, SAE International, Braunschweig, 2015 Search PubMed.
- L. Makkonen, “Ice Adhesion—Theory, Measurements and Countermeasures”, J. Adhes. Sci. Technol., 2012, 413–445 CrossRef CAS.
- A. J. Meuler, J. D. Smith, K. K. Varanasi, J. M. Mabry, G. H. McKinley and R. E. Cohen, “Relationships between Water Wettability and Ice Adhesion”, ACS Appl. Mater. Interfaces, 2010 Search PubMed.
- D. S. Thompson, D. Meng, A. Afshar, R. Bassou, J. Zhong, E. Bonaccurso, A. Laroche and V. Vercillo, “Initial Development of a Model to Predict Impact Ice Adhesion Stress”, AIAA, Atlanta, US, 2018 Search PubMed.
- S. Jung, M. K. Tiwari, N. V. Doan and D. Poulikakos, Mechanism of Supercooled Droplet Freezing On Surfaces, Nat. Commun., 2012, 615 CrossRef.
- V. F. Petrenko and R. W. Whitworth, Physics of Ice, Oxford University, Oxford, 2006 Search PubMed.
- A. K. N. Nair, R. Cui and S. Sun*, Overview of the Adsorption and Transport Properties of Water, Ions, Carbon Dioxide, and Methane in Swelling Clays, ACS Earth Space Chem., 2021, 5(10), 2599–2611 CrossRef.
- S. Xiao, J. He* and Z. Zhang, Nanoscale deicing by molecular dynamics, Nanoscale, 2016, 8, 14625–14632 RSC.
- S. Xiao, J. He and Z. Zhang, Modeling nanoscale ice adhesion, Acta Mech. Solida Sin., 2017, 30(3), 224–236 CrossRef.
- J. Wang, A. G. Kalinichev and R. J. K. a. R. T. Cygan, Structure, Energetics, and Dynamics of Water Adsorbed on the Muscovite (001) Surface: A Molecular Dynamics Simulation, J. Phys. Chem., 2005, 109(33), 15893–15905 CrossRef CAS PubMed.
- S. Kulinich, M. Farzaneh and S. Farhadi, Ice Adhesion on Superhydrophobic and Hydrophobic Surfaces: Effect of Wetting Hysteresis, in Proceedings of the 13th International Workshop on Atmospheric Icing of Structures, IWAIS XIII, Quebec, Canada, 2009 Search PubMed.
- L. Gold, Process of failure in ice, Can. Geotech. J., 1970, 7(4), 405–413 CrossRef.
- L. E. Raraty and D. Tabor, The Adhesion and Strength Properties of Ice, Proc. R. Soc. A: Math. Phys. Eng., 1958, 245, 184–201 Search PubMed.
- M. Landy and A. Freiberger, Studies of Ice Adhesion, 1: Adhesion of Ice to Plastics, J. Colloid Interface Sci., 1967, 25, 231–244 CrossRef CAS.
- W. Meng and Y. Guo, “Experimental Study on Mechanical Properties of Ice”, in 2015 AASRI International Conference on Industrial Electronics and Applications, IEA 2015, London, UK, 2015 Search PubMed.
- A. P. Thompson, H. M. Aktulga, R. Berger, D. S. Bolintineanu, W. M. Brown, P. S. Crozier, P. J. i. ’. Veld, A. Kohlmeyer, S. G. Moore, T. D. Nguyen, R. Shan, M. J. Stevens, J. Tranchida, C. Trott and S. J. Plimpton, LAMMPS – a flexible simulation tool for particle-based materials modeling at the atomic, meso, and continuum scales, Comput. Phys. Commun., 2022, 271, 108171 CrossRef CAS.
- A. Stukowski, Visualization and analysis of atomistic simulation data with OVITO–the Open Visualization Tool, Modell. Simul. Mater. Sci. Eng., 2009, 18(1), 015012 CrossRef.
- M. Pervier and D. Hammond, Measurement of the fracture energy in mode I of atmospheric ice accreted on different materials using a blister test, Eng. Fract. Mech., 2019, 214, 223–232 CrossRef.
- A. Vincent, “Multi-scale Ice Adhesion Analysis Using Experimental Methods and Molecular Dynamics Simulation,” Cranfield University, Cranfield, UK, 2022 Search PubMed.
- D. Hammond, “Microstructure and mechanical properties of some small impact ice accretions,” in 7th International Workshop on Atmospheric Icing Structures, 1996 Search PubMed.
- W. L. Jorgensen, Transferable Intermolecular Potential Functions for Water, Alcohols, and Ethers - Application to Liquid Water, J. Am. Chem. Soc., 1981, 103(2), 335–340 CrossRef CAS.
- H. J. C. Berendsen, J. P. M. Postma, W. F. v. Gunstaren and J. Hermans, “Interaction Models for Water in Relation to Protein Hydration”, ed. Pullman B., Intermolecular Forces, 1981, Vol. 14, pp. 331–342 Search PubMed.
- V. Molinero and E. B. Moore, Water modeled as an intermediate element between carbon and silicon, J. Phys. Chem. B, 2009, 113(13), 4008–4016 CrossRef CAS.
- A. K. Metya and J. K. Singh, Ice adhesion mechanism on lubricant impregnated surfaces using molecular dynamics simulations, Mol. Simul., 2019, 45(4), 394–402 CrossRef CAS.
- A. H. Larsen, J. J. Mortensen, J. Blomqvist, I. E. Castelli, R. Christensen, M. Dułak, J. Friis, M. N. Groves, B. Hammer and C. Hargus, The atomic simulation environment—a Python library for working with atoms, J. Phys.: Condens. Matter, 2017, 29(27), 273002 CrossRef PubMed.
- T. Fu, Y. Mao, Y. Tang, Y. Zhang and W. Yuan, Molecular Dynamics Simulation on Rapid Boiling of Thin Water Films on Cone-Shaped Nanostructure Surfaces, Nanoscale Microscale Thermophys. Eng., 2015, 19(1), 17–30 CrossRef CAS.
- J. Petrovic and G. Thomas, “Reaction of Aluminum with Water to Produce Hydrogen,” US Department of Energy, 2010 Search PubMed.
- S. Nosé, A molecular dynamics method for simulations in the canonical ensemble, Mol. Phys., 1984, 52(2), 191–198 CrossRef.
- W. G. Hoover, Canonical dynamics: Equilibrium phase-space distributions, Phys. Rev. A, 1985, 31(3), 1695–1697 CrossRef.
- M. Fitzner, G. C. Sosso, S. J. Cox and A. Michaelides, The Many Faces of Heterogeneous Ice Nucleation: Interplay Between Surface Morphology and Hydrophobicity, J. Am. Chem. Soc., 2015, 137(42), 13658–13669 CrossRef CAS PubMed.
- S. Izrailev, K. Isralewitz, M. Lu and S. Wriggers, “Computational Molecular Dynamics: Challenges, Methods, Ideas,” in Lecture Notes in Computational Science and Engineering, Springer-Verlag, Berlin, 1998, pp. 39–65 Search PubMed.
- S. J. Park, Calculating potentials of mean force from steered molecular dynamics simulations, J. Chem. Phys., 2014, 120, 5946 CrossRef.
- C. Jarzynski, Nonequilibrium Equality for Free Energy Differences, Phys. Rev. Lett., 1997, 78(14), 2690–2693 CrossRef CAS.
- A. Afshar, J. Zong, D. S. Thompson and D. Meng, “Fracture of Ice at Interfaces from Molecular Dynamics Simulations,” in Atmospheric and Space Environments Conference, AIAA Aviation Forum, Atlanta, USA, 2018 Search PubMed.
- J. Chen, Z. Luo, Q. Fan, J. Lv and J. Wang, Anti-Ice Coating Inspired by Ice Skating, Small, 2014, 10, 4693–4699 CrossRef CAS.
- R. Dou, J. Chen, Y. Zhang, X. Wang, D. Cui, Y. Song, L. Jiang and J. Wang, Anti-icing Coating with an Aqueous Lubricating Layer, ACS Appl. Mater. Interfaces, 2014, 6(10), 6998–7003 CrossRef CAS PubMed.
- S. B. Subramanyam, K. Rykaczewski and K. K. Varanasi, Ice adhesion on lubricant-impregnated textured surfaces, Langmuir, 2013, 29(44), 13414–13418 CrossRef CAS.
- K. Golovin, S. P. R. Kobaku, D. H. Lee, E. T. DiLoreto, J. M. Mabry and A. Tuteja, Designing Durable Icephobic Surfaces, Advanced Science Magazine, Michigan, USA, 2016 Search PubMed.
- M. R. Kasaai and M. Farzaneh, “A Critical Review of Evaluation Methids of Ice Adhesion Strength on the Surface of Materials”, in 23rd International Conference on Offshore Mechanics and Arctic Engineering, Vancouver, Canada, 2004 Search PubMed.
- S. Huang, H. Cai, Z. Xin and G. Liu, The temperature-dependent shear strength of ice-filled joints in rock mass considering the effect of joint roughness,opening and shear rates, Cryosphere, 2023, 17(3), 1205–1223 CrossRef.
- J. Druez, C. L. Phan, L. J. L. Laforte and D. Nauyen, The Adhesion of Glaze and Rime on Aluminium Electrical Conductors, Trans. Can. Soc. Mech., 1978, 5(4), 215–220 CrossRef.
- H. Lack, M. Quatinetz and A. Freiberger, Ice Adhesion Apparatus and Test Method, ASTM Bulletin, 1957, Vol. 224, pp. 48–50 Search PubMed.
| This journal is © The Royal Society of Chemistry 2023 |

