 Open Access Article
Detection of lean meat powder residues in pig liver based on TLC-SERRS†
Meng Cao,
Feng Xu*,
Li Li,
Honglian Zhang ,
Xin Liang
 ,
Tao Xu and
Qian Li
School of Pharmacy, Qiqihar Medical University, Qiqihar 161006, China. E-mail: 15845205504@qmu.edu.cn; 19917731195@163.com; lilianlinsuo@163.com; zhanghonglian-2006@163.com; liangxin@qmu.edu.cn; harvey-333@163.com; liqian67@126.com
First published on 11th December 2023
Abstract
The objective of this study was to establish a novel method for the detection of lean meat powder (salbutamol sulfate and terbutaline sulfate) residues in commercially available pig liver based on diazo coupling reaction by combining thin layer chromatography (TLC) with surface-enhanced resonance Raman scattering (SERRS). TLC was used to separate samples; after determining the spots of each component, diazo coupling reaction was carried out on the spots in situ to generate azo compounds, and then the spots of azo compounds mixed with silver sol on the TLC plate were qualitatively detected by SERRS. The limit of detection (LOD) of salbutamol sulfate was as low as 0.14 μg kg−1, and that of terbutaline sulfate was as low as 0.04 μg kg−1. The influence of the sample matrix in TLC-SERRS detection of salbutamol sulfate and terbutaline sulfate was investigated by experiment on a simulated positive sample, and salbutamol sulfate and terbutaline sulfate in commercially available pig liver were detected. Compared with the reported method (HPLC-MS/MS), this method has the advantages of strong specificity, high sensitivity, rapidity and low cost. It provides a new reference method for establishing and perfecting the safety system of veterinary drug residues.
1. Introduction
Lean meat powder is an artificially synthesized β-receptor agonist which can reduce fat deposition and accelerate protein accumulation, thereby it can accelerate the growth rate of animals and improve feeding efficiency. Due to the long half-life period of lean meat powder in animal blood, it can lead to the formation of insoluble deposits in muscle or liver. The residual amount in animal products may pose a serious threat to humans, manifested as muscle tremors, vomiting, nausea and chills. China has banned its use as a growth promoter for livestock. With regard to the determination of the limit of phenethylamine epinephrine in pig liver, the Ministry of Agriculture of the People's Republic of China announced (No. 1519) that according to the relevant provisions of the Regulations on the Administration of Feed and Feed Additives, the use of phenethyl alcohol amine and other substances in feed and animal drinking water is prohibited. At present, more than 10 compounds such as terbutaline, salbutamol, clenbuterol, clorprenaline, bambuterol are collectively referred to as clenbuterol.1–5Various analytical techniques used for the determination of such drugs have been developed, such as enzyme-linked immunosorbent assay (ELISA),6 capillary electrophoresis (CE),7 high performance liquid chromatography (HPLC),8 high performance liquid chromatography-mass spectrometry (HPLC-MS)9–12 and so on. However, the above methods have some limitations, such as high cost, high operational requirements, and dependence on extraction. While Raman spectroscopy does not require pretreatment and destruction before sample analysis, and has the advantages of simple and fast operation,13,14 it still has some disadvantages, such as weak Raman signal and sometimes overlapping of different vibration peaks. It has been reported that SERRS can increase the normal Raman signal by 6–10 orders of magnitude.15,16 However, it is not a separation technique, so mixtures are unable to be detected. TLC is a relatively simple, rapid and cheap method among many separation methods,17 but its specificity is low, and sometimes false positive results can easily occur. So in our study, we chose to combine TLC and SERRS to identify trace lean meat powder in commercially available pig liver.
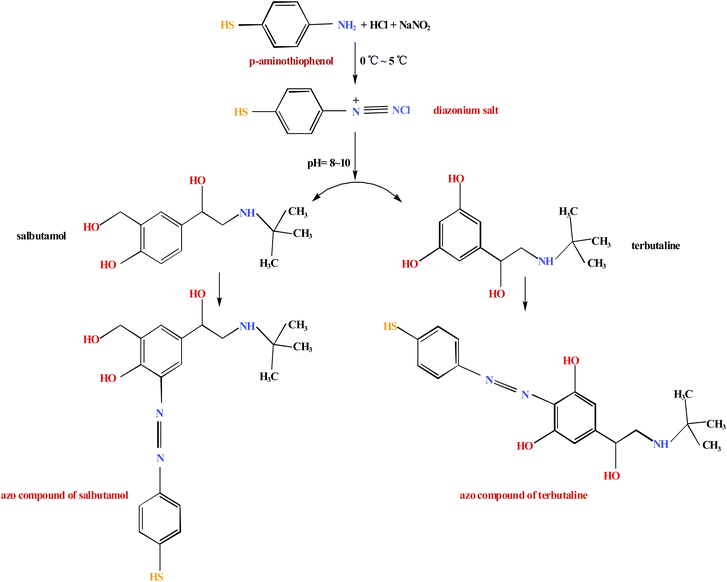
Since most of the target products do not directly generate a SERRS effect, their information can be detected indirectly by derivatization to generate derivatives with a SERRS effect.18 For example, the structure of amino thiophenol contains aromatic primary amines, so it can form a diazonium salt with sodium nitrite under certain conditions. The diazonium salt can form an azo compound with colored derivative by diazo coupling reaction with aromatic or heterocyclic compounds containing hydroxyl or amino groups, such as histidine, tyrosine19,20 and N-methylaniline,21 so the above lean meat powder with phenolic hydroxyl groups (Fig. 1) can produce azo compounds with colored derivatives by diazo coupling reactions under certain conditions; the maximum absorption wavelength of the colored substance appears in the visible light region. If the effect of strengthening the substrate is added, it is likely to produce a SERRS effect. In this study, terbutaline sulfate and salbutamol sulfate, two common lean meat powder components in phenylethylamine epinephrine analogues, were selected for experiments. So we chose a strong-specificity, high-sensitivity, high-speed and low-cost screening method whereby the two components separated from TLC were converted into azo compounds by chemical derivation of azo coupling reaction, and then used SERRS to indirectly identify trace lean meat powder in commercial pig liver. This study provides a new reference method for the detection of lean meat powder in pig liver.
2. Materials and methods
2.1 Materials and reagents
TLC aluminum plates (Merck KGaA, Darmstadt, Germany) was composed of high-performance silica gel 60 F254, and the layer thickness was 0.2 ± 0.03 mm. There was a fluorescent additive (F254) on the plates used to observe the spots. Due to the existence of fluorescent indicator, invisible spots could be seen under the UV light of 254 nm; the 25 μL micro sampler was purchased from Shanghai Gaoge Industry and Trade Co., Ltd (Shanghai, China).The terbutaline sulfate reference substance (100273-201803) and salbutamol sulfate reference substance (100328-201904) were purchased from China Food and Drug Control Institute; while sodium nitrite, p-aminophenylthiol, silver nitrate, sodium citrate, concentrated hydrochloric acid and sodium hydroxide were purchased from Aladdin Industrial Company (Shanghai, China); glacial acetic acid and ethyl acetate were purchased from Tianli Chemical Reagent Co., Ltd; methanol was purchased from Fuchen Chemical Reagent Factory (Tianjin, China); anhydrous ethanol, isopropyl alcohol was purchased from Komio Chemical Reagents Co., Ltd (Tianjin, China); all chemicals were analytical-grade reagents and used without further purification; experimental water was ultrapure water; 4 batches of pig liver were all purchased from the market (Jiefangmen Market, Qiqihar City, Heilongjiang Province, China).
2.2 Apparatus
WFH-203B three purpose ultraviolet analyzer (Shanghai jingke Industrial co., Ltd) was used to locate the separated spots under 254 nm. T6 New Century UV Visible Spectrophotometer (Beijing Puxi General Instrument Co., Ltd) was used to detect the maximum absorption wavelength. Raman scattering spectra were obtained by use of a DxRxi Micro-Raman Imaging spectrometer (Thermo Fisher Scientific, Waltham, MA, USA) with an excitation wavelength of 532 nm, the excitation power was 10.0 mW, the exposure time the 0.05000 s and the number of scans was 30, the microscope times was 10, the scan range was 100–3300 cm−1, the scan mode was area scanning and a 50 μm confocal pinhole aperture was used. The data acquisition and analysis software was OMNICxi and the drawing software was Origin 6.1.2.3 Sample preparation
The reference stock solution of salbutamol sulfate and the reference stock solution of salbutamol sulfate were prepared respectively at a concentration of 1.0 mg mL−1 with methanol. The reference substance solution of salbutamol sulfate and terbutaline sulfate with a concentration of 10 μg mL−1 were prepared by diluting 0.1 mL stock solution (1.0 mg mL−1) with methanol into 10 mL. All solutions were stored in a sealed way for standby.Sample solution was prepared by washing the pig liver samples, drying them naturally, cutting the samples into small pieces with scissors cleaned by anhydrous ethanol, then weighing 10.00 g of the samples accurately, putting them into a 50 mL conical flask with a stopper and adding 5 mL methanol, ultrasonicated at about 20 °C for 5 minutes with an ultrasonic frequency of 40 kHz (repeated three times), and then cooling to room temperature, centrifugating at a speed of 4000 rpm for 5 minutes, transferring the supernatant to a rotary evaporator, heating and concentrating to 2 mL to obtain the sample solution, which was placed in a dark place for standby.
2.4 Preparation of diazonium salt
The synthesis route of diazonium salt was shown in Fig. 2. Diazonium salt was prepared by mixing a dilute hydrochloric acid solution (2.77 mol L−1) of p-aminothiophenol with a concentration of 0.7 mg mL−1 and a sodium nitrite solution with a concentration of 0.03 g mL−1 in a volume ratio of 1![[thin space (1/6-em)]](https://www.rsc.org/images/entities/char_2009.gif) :
:![[thin space (1/6-em)]](https://www.rsc.org/images/entities/char_2009.gif) 1, and reacting in an ice salt bath at 0–5 °C to generate yellow aromatic diazonium salt, then adjusting the pH to 8–10 with a 50% NaOH solution and stirring for 5 minutes.
1, and reacting in an ice salt bath at 0–5 °C to generate yellow aromatic diazonium salt, then adjusting the pH to 8–10 with a 50% NaOH solution and stirring for 5 minutes.
2.5 Preparation of silver sol
The silver sol was prepared by microwave heating method, which was reported in literatur and was improved.22–25 The specific operation method is as follows: dissolving 37.3 mg silver nitrate in 100 mL ultrapure water, heating it until boiling in the microwave oven, then taking it out, and rapidly adding 2.6 mL sodium citrate solution (1%) into the silver nitrate solution only one time. After mixing evenly, continuing microwave heating for 2 minutes, and then cooling to room temperature to obtain grayish green silver sol, which was stored in a 4 °C refrigerator for standby.2.6 The TLC-SERRS detection method
In this method, we focused on TLC-SERRS for rapid and specific detection of lean meat powder (salbutamol sulfate and terbutaline sulfate) in pig liver. In our study, we spotted 4 μL of sample solutions and 4 μL of the reference solution on the same one silica gel 60 F254 aluminum plate. After saturation for 10 min in a developing chamber, it was eluted (20 °C) with ethyl acetate–isopropyl alcohol–water–glacial acetic acid (5![[thin space (1/6-em)]](https://www.rsc.org/images/entities/char_2009.gif) :
:![[thin space (1/6-em)]](https://www.rsc.org/images/entities/char_2009.gif) 2
2![[thin space (1/6-em)]](https://www.rsc.org/images/entities/char_2009.gif) :
:![[thin space (1/6-em)]](https://www.rsc.org/images/entities/char_2009.gif) 1
1![[thin space (1/6-em)]](https://www.rsc.org/images/entities/char_2009.gif) :
:![[thin space (1/6-em)]](https://www.rsc.org/images/entities/char_2009.gif) 2, v/v/v/v), then the TLC plate was evaporated naturally, thin layer development time was 20 min, the separated spots were then visualized and located under 254 nm. After preliminary separation of salbutamol sulfate and terbutaline sulfate, we added 4 μL diazonium salt on separated spots so as to generate azo compounds (Fig. 2), and we added 8 μL silver sol to the spots of azo compounds, this process took approximately 5 minutes, then the SERRS spectra of the corresponding azo compounds were measured in situ at 532 nm. The Raman spectrum could be obtained within approximately 5 minutes of detection time. The Raman spectrum of the test substance was consistent with the Raman spectrum of the corresponding reference substance.
2, v/v/v/v), then the TLC plate was evaporated naturally, thin layer development time was 20 min, the separated spots were then visualized and located under 254 nm. After preliminary separation of salbutamol sulfate and terbutaline sulfate, we added 4 μL diazonium salt on separated spots so as to generate azo compounds (Fig. 2), and we added 8 μL silver sol to the spots of azo compounds, this process took approximately 5 minutes, then the SERRS spectra of the corresponding azo compounds were measured in situ at 532 nm. The Raman spectrum could be obtained within approximately 5 minutes of detection time. The Raman spectrum of the test substance was consistent with the Raman spectrum of the corresponding reference substance.
3. Results and discussion
3.1 Selection of TLC developing agent
The commercial samples were detected by HPLC, and the sample without salbutamol sulfate and terbutaline sulfate were selected as negative samples. According to the sample pretreatment method, the reference substance of salbutamol sulfate and terbutaline sulfate were accurately measured, and added into negative sample of appropriate amount, the corresponding simulated positive sample was obtained. Reference substance stock solutions, negative sample and simulated positive sample were respectively spotted on the same silica gel 60 F254 plate with the sample amount of 4 μL.We mainly investigated three systems in the selection of developing agents, that were respectively ethyl acetate–isopropanol–water–glacial acetic acid, chloroform–methanol–water–glacial acetic acid and ethyl acetate–methanol–glacial acetic acid. Because chloroform is toxic and harmful to human body, this system was removed. Because salbutamol sulfate and terbutaline sulfate have higher polarity (Fig. 1), when using the system of ethyl acetate–methanol–glacial acetic acid, most of the component spots were near the baseline, so water was used instead of methanol, and isopropanol was also added to it, then different proportions of ethyl acetate–isopropanol–water–glacial acetic acid systems were investigated. Finally, when ethyl acetate–isopropanol–water–glacial acetic acid (5![[thin space (1/6-em)]](https://www.rsc.org/images/entities/char_2009.gif) :
:![[thin space (1/6-em)]](https://www.rsc.org/images/entities/char_2009.gif) 2
2![[thin space (1/6-em)]](https://www.rsc.org/images/entities/char_2009.gif) :
:![[thin space (1/6-em)]](https://www.rsc.org/images/entities/char_2009.gif) 1
1![[thin space (1/6-em)]](https://www.rsc.org/images/entities/char_2009.gif) :
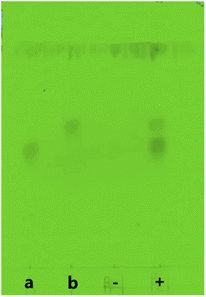
:![[thin space (1/6-em)]](https://www.rsc.org/images/entities/char_2009.gif) 2, v/v/v/v) was used as the developing agent, the separation effect of the two components was the best, and the Rf values were 0.48 and 0.60, respectively. It could be seen from Fig. 3 that at the corresponding position with the reference substance in TLC plate, the positive sample had spots and the negative sample had no spots, indicating that the reference substance could be preliminarily separated from the matrix in pig liver, and the separation effect was good.
2, v/v/v/v) was used as the developing agent, the separation effect of the two components was the best, and the Rf values were 0.48 and 0.60, respectively. It could be seen from Fig. 3 that at the corresponding position with the reference substance in TLC plate, the positive sample had spots and the negative sample had no spots, indicating that the reference substance could be preliminarily separated from the matrix in pig liver, and the separation effect was good.
3.2 Selection of excitation wavelength of Raman spectrum
Because the intensity of Raman signal was affected by the excitation wavelength, the following experiments were carried out in this study. Terbutaline sulfate stock solution, salbutamol sulfate stock solution, blank azo compound, terbutaline sulfate azo compound solution, salbutamol sulfate azo compound solution, silver sol, mixed solution of terbutaline sulfate azo compound solution and silver sol, and mixed solution of salbutamol sulfate azo compound and silver sol were diluted by appropriate times respectively, and the spectrum was scanned in the wavelength range of 200 nm to 700 nm.The results (Fig. S1†) show that the maximum absorption wavelength of terbutaline sulfate and salbutamol sulfate solution was 278 nm, and that of silver sol solution was 432 nm. As the conjugated chain of terbutaline sulfate and salbutamol sulfate generates azo compounds, and then interacts with silver sol, the maximum absorption wavelengths of terbutaline sulfate and salbutamol sulfate were red shifted to 504 nm and 511 nm respectively. According to the existing conditions in the laboratory, 532 nm and 780 nm lasers were used as light sources of micro Raman spectrometer. When the micro Raman spectrometer uses 532 nm laser as the light source, the wavelength of excitation light was close to the maximum absorption wavelength of silver sol mixed solution of azo compound molecules, and the resonance of surface plasma greatly enhances the Raman detection signal, thus realizing the SERRS detection of terbutaline sulfate and salbutamol sulfate, and improving the sensitivity of terbutaline sulfate and salbutamol sulfate detection. Therefore, the excitation light wavelength used in this study was 532 nm.
3.3 Raman spectra by TLC-SERRS of azo compounds
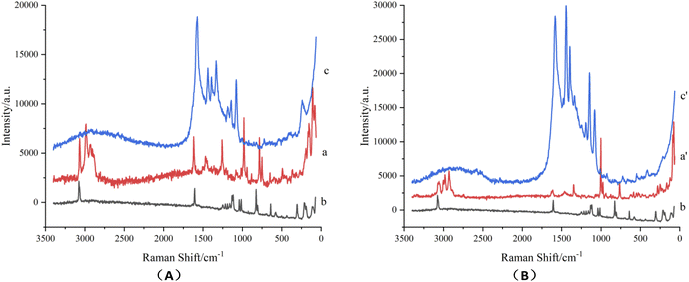
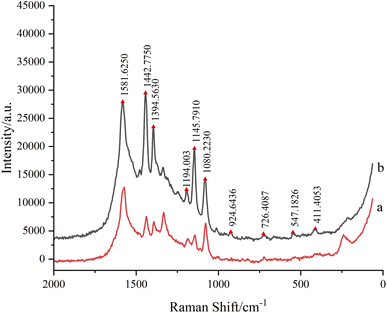
Micro-Raman spectra of terbutaline sulfate and salbutamol sulfate powder were showed in Fig. 4, which could been seen that the peak shapes and positions of the two reference substances were significantly different, and could been distinguished. Micro-Raman spectra of terbutaline sulfate and salbutamol sulfate spots after TLC (Fig. 3) were measured, then diazo coupling reaction was carried out on the two component spots in situ to generate azo compounds, and Raman spectra of corresponding azo compounds were measured on the TLC plate, and finally silver sol was dripped onto the azo compound spots to measure SERRS spectra of azo compounds.As could be seen from the synthetic route in Fig. 2, the structure of the generated salbutamol azo compound contained a partial structure of p-aminophenthiophenol and a partial structure of salbutamol, and the structure of terbutaline azo compound contained a partial structure of p-aminophenthiophenol and a partial structure of terbutaline. In the range of 1000–2000 cm−1 in Fig. 3 (Fig. S2†), the Raman spectra of salbutamol azo compounds were equivalent to the sum of the Raman spectra of p-aminophenthiophenol and salbutamol; similarly, the Raman spectra of terbutaline azo compounds were equivalent to the sum of the Raman spectra of p-aminophenthiophenol and terbutaline, and There is also the characteristic peak of ν (N![[double bond, length as m-dash]](https://www.rsc.org/images/entities/char_e001.gif) N) of 1440 cm−1 of the newly generated azo compound, which proves the formation of the azo compound.
N) of 1440 cm−1 of the newly generated azo compound, which proves the formation of the azo compound.
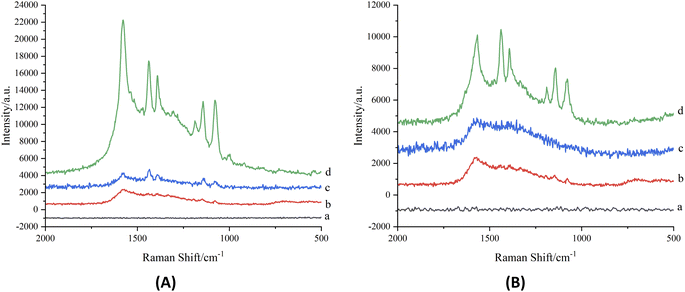
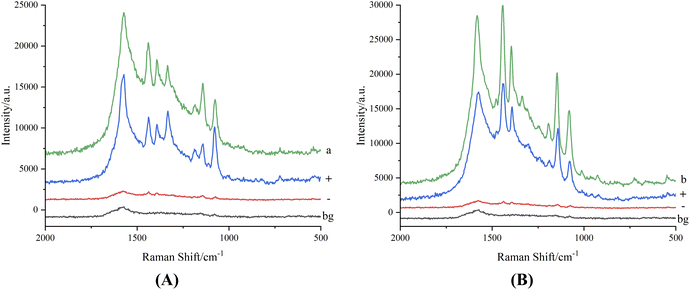
It could be seen from Fig. 5A that when the sample deposition amount of salbutamol sulfate solution was 4 μg, there was no Raman spectrum signal (a), and the characteristic Raman spectrum signal of azo compound which was from salbutamol sulfate and aromatic diazonium salt to generate was also weak (c), so the detection result of salbutamol sulfate could not be satisfied by only using chemical derivatization to generate azo compound. Therefore, silver sol was used as the active substrate to add to the detection system of the generated azo compound, the Raman spectrum detection signal was greatly enhanced (d). The reason considered was that azo compound was a colored compound with a long conjugate system (Fig. 2), the maximum absorption was in the visible light region, after the interaction of silver sol and sulfhydryl on the azo compound, its maximum absorption wavelength was close to 532 nm of laser light source, due to the resonance of the surface plasma, the sensitivity of salbutamol sulfate detection was improved, and the SERRS detection of salbutamol sulfate was realized. The Raman spectrum signal of diazonium salt mixed with silver sol has a weak absorption peak near 1500 cm−1 (b), which was quite different from the SERRS peak shape and peak position of salbutamol sulfate azo spot, so it had little influence on the SERRS detection of salbutamol sulfate and might be ignored. Similarly, it could be seen from Fig. 5(B), after generated azo compound mixed with silver sol, SERRS signal of terbutaline sulfate was significantly enhanced, the SERRS detection of terbutaline sulfate was realized.
The salbutamol sulfate and terbutaline sulfate could be distinguished in the corresponding TLC-SERRS spectra, as shown in Fig. 6, thus, the method (TLC-SERRS) used for the two lean meat powder is a suitable and very practical method, which proves the high selectivity in detecting SERRS of terbutaline sulfate and salbutamol sulfate. The molecular structures of salbutamol sulfate and terbutaline sulfate were showed in Fig. 1. They have the same phenylethylamine structure, and the characteristic peaks of azo compound in the TLC-SERRS were also similar with salbutamol sulfate and terbutaline sulfate (Fig. 6). The peak near 1580 cm−1 was caused by ν (C![[double bond, length as m-dash]](https://www.rsc.org/images/entities/char_e001.gif) C) of benzene ring, the peak at 1440 cm−1 belonged to the ν (N
C) of benzene ring, the peak at 1440 cm−1 belonged to the ν (N![[double bond, length as m-dash]](https://www.rsc.org/images/entities/char_e001.gif) N), which proved the generation of azo compounds, the peak at 1390 cm−1 belonged to the δ (–C–H) on –CH3, the peaks at 1190 cm−1, 1150 cm−1 and 1080 cm−1 belonged to the δ (–C–H) on unsubstituted phenyl and the peak near 725 cm−1 was caused by stretching vibration of tert-butyl skeleton.26
N), which proved the generation of azo compounds, the peak at 1390 cm−1 belonged to the δ (–C–H) on –CH3, the peaks at 1190 cm−1, 1150 cm−1 and 1080 cm−1 belonged to the δ (–C–H) on unsubstituted phenyl and the peak near 725 cm−1 was caused by stretching vibration of tert-butyl skeleton.26
3.4 Analysis of simulated positive samples
The results showed (Fig. 3) that the color and the position of the spots of the reference substance and the simulated positive sample on the TLC plate were similar. In order to further improve the specificity of detection of salbutamol sulfate and terbutaline sulfate in pig liver, 4 μL diazonium salt and 8 μL silver sol were respectively dripped into the control spots of salbutamol sulfate and terbutaline sulfate in Fig. 3, and the corresponding SERRS spectra of the spots of azo compounds were detected in situ at 532 nm. It could be seen from Fig. 7A and B that the peaks shapes and positions of the reference substance and the simulated positive sample were consistent, while the negative sample had no SERRS signal, which indicated that the matrix in pig liver had no influence on the detection of salbutamol sulfate and terbutaline sulfate by TLC-SERRS, and the SERRS of the reference substance could clearly reflect the fingerprint information of its structure, which proved a high specificity for the detection of terbutaline sulfate and salbutamol sulfate.3.5 Inspection of limit of detection (LOD) and repeatability
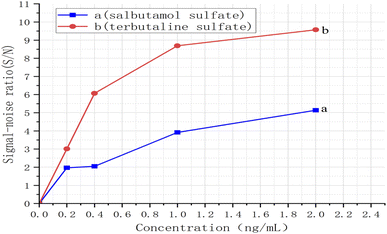
With the proposed method, the limit of detection (LOD) and repeatability should be inspected. The reference solution of salbutamol sulfate and terbutaline sulfate with a concentration of 10 μg mL−1 were diluted with methanol to 0.2, 0.4, 1.0, 2.0 ng mL−1, respectively, and the reference stock solution of salbutamol sulfate and terbutaline sulfate at a concentration of 1.0 mg mL−1.Using TLC-SERRS, 5.0 μL of different concentrations of the solution were separately deposited onto the TLC plates, and their corresponding TLC-SERRS were obtained. The results were shown in Fig. 8–10. A signal-to-noise ratio of 3![[thin space (1/6-em)]](https://www.rsc.org/images/entities/char_2009.gif) :
:![[thin space (1/6-em)]](https://www.rsc.org/images/entities/char_2009.gif) 1 (S/N = 3
1 (S/N = 3![[thin space (1/6-em)]](https://www.rsc.org/images/entities/char_2009.gif) :
:![[thin space (1/6-em)]](https://www.rsc.org/images/entities/char_2009.gif) 1) was considered as the LOD of salbutamol sulfate and terbutaline sulfate. The S/N was calculated by the ratio of the height of the characteristic peak ν (N
1) was considered as the LOD of salbutamol sulfate and terbutaline sulfate. The S/N was calculated by the ratio of the height of the characteristic peak ν (N![[double bond, length as m-dash]](https://www.rsc.org/images/entities/char_e001.gif) N) to that of the noise peak, and the Raman shifts of these characteristic peaks occurred at 1438 cm−1 (salbutamol sulfates) and 1442 cm−1 (terbutaline sulfate). The S/N values of the characteristic peak of the reference substance at different concentrations were separately determined using TLC-SERRS, and the measurement was repeated three times for each peak. The RSDs of the S/N of the salbutamol sulfate and terbutaline sulfate were 3.1% and 4.0%. This result indicates that this method has a good repeatability.
N) to that of the noise peak, and the Raman shifts of these characteristic peaks occurred at 1438 cm−1 (salbutamol sulfates) and 1442 cm−1 (terbutaline sulfate). The S/N values of the characteristic peak of the reference substance at different concentrations were separately determined using TLC-SERRS, and the measurement was repeated three times for each peak. The RSDs of the S/N of the salbutamol sulfate and terbutaline sulfate were 3.1% and 4.0%. This result indicates that this method has a good repeatability.
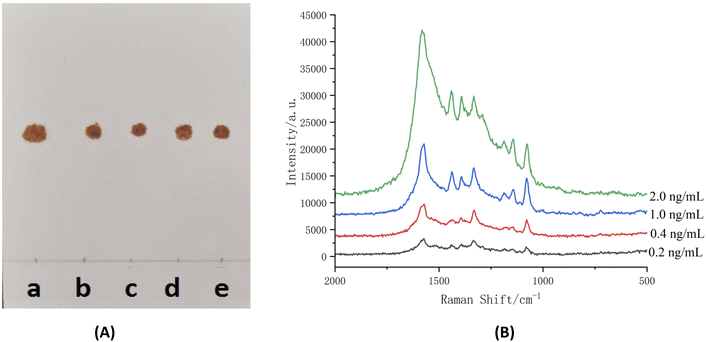 | ||
| Fig. 8 LOD of TLC ((A) azo compound under visible light) and TLC-SERRS (B) for salbutamol sulfate [inset (a–e): 0.2 ng mL−1, 0.4 ng mL−1, 1.0 ng mL−1, 2.0 ng mL−1, 1.0 mg mL−1]. | ||
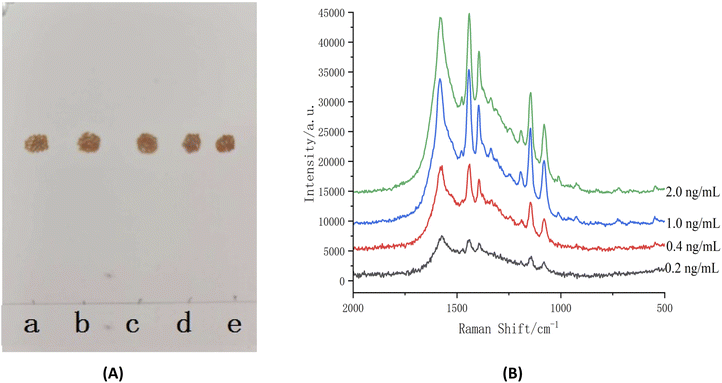 | ||
| Fig. 9 LOD of TLC ((A) azo compound under visible light) and TLC-SERRS (B) for terbutaline sulfate [inset (a–e): 0.2 ng mL−1, 0.4 ng mL−1, 1.0 ng mL−1, 2.0 ng mL−1, 1.0 mg mL−1]. | ||
The curves were established by concentrations and S/N. The results are shown in Fig. 10. According to the curves, the LODs of the salbutamol sulfate was 0.7 ng mL−1 and that of terbutaline sulfate was 0.2 ng mL−1. Then, according to the preparation method of sample solution, the LODs of the salbutamol sulfate and terbutaline sulfate were converted to 0.14 μg kg−1 and 0.04 μg kg−1, respectively. The calculated result was less than 0.5 μg kg−1, which was considered as no detection according to the National Standard of the People's Republic of China (No. GB/T22286-2008, HPLC-MS/MS). Therefore, the LOD of the TLC-SERRS can meet the requirements for testing whether the levels of the salbutamol sulfate and terbutaline sulfate residues exceed the limits in food. This method of the TLC-SERRS with high sensitivity is relatively simple for sample processing, and is superior to HPLC-MS/MS in terms of operation and time required (Table S1†). In TLC-SERRS, because the matrix in the food is composed of some compounds that do not produce the SERRS, the sample pretreatment is simple, the method is easy to operate, and less time is required (approximately 30 min), so the method is suitable for the rapid on-site detection of contaminants in food. However, in HPLC-MS/MS, a cum-bersome and time-consuming (approximately 240 min) sample pretreatment method is required so as to prevent the chromatographic column being blocked by the food matrix, so the method is unsuitable for the rapid on-site detection of food contaminants. In addition, TLC-SERRS can be performed with small, low-cost and portable Raman spectroscopy instruments, whereas HPLC-MS/MS must be completed using large and expensive instruments. Therefore, TLC-SERRS is more suitable for on-site analysis than HPLC-MS/MS.
3.6 Detection of real samples
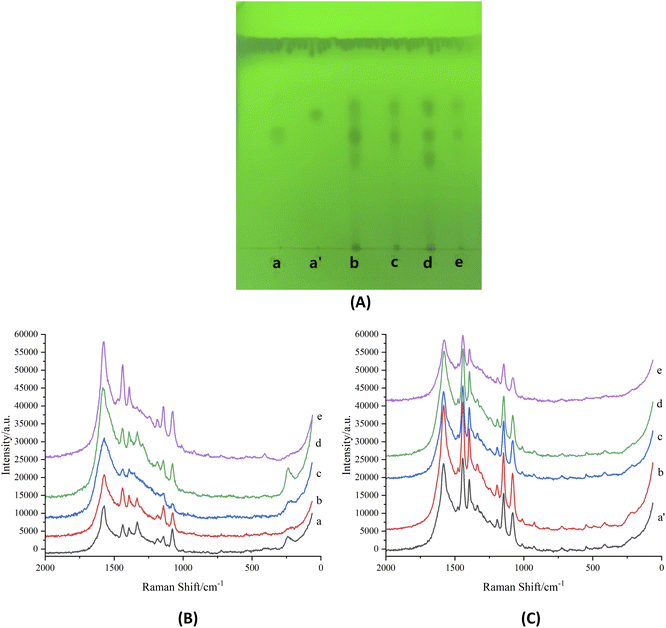
With salbutamol sulfate and terbutaline sulfate as the target components, four batches of randomly selected pig livers were detected by TLC-SERRS. The results showed that similar spots as salbutamol sulfate and terbutaline sulfate were detected by TLC of the four batches of samples (Fig. 11A). On the TLC plate, diazonium salt and silver sol were added at the Rf position of the same as that of the salbutamol sulfate spot and terbutaline sulfate spot, and then the SERRS was detected (Fig. 11B and C). It was found that the peak shapes and positions were consistent with those of reference azo compound, which indicated that they contained salbutamol sulfate and terbutaline sulfate.4. Conclusions
In this study, the sample was separated by TLC to obtain component spots, and then the spots were chemically derivatized to obtain spots of azo compound. Finally, the spots of azo compound were in situ added with the surface enhancer silver sol, and their SERRS were measured in situ under the condition of 532 nm laser. TLC combined with SERRS was used for the first time to separate and detect salbutamol sulfate and terbutaline sulfate in pig liver. This method has strong specificity, high sensitivity and low detection cost. It could provide a new reference method for establishing and perfecting the safety system of veterinary drug residues.Author contributions
Meng Cao: conceptualization, data curation, writing – original draft, investigation, formal analysis. Feng Xu: methodology, project administration, resources, writing – review & editing, funding acquisition. Li Li: resources, supervision. Honglian Zhang: formal analysis, software. Xin Liang: validation. Tao Xu: software. Qian Li: validation.Conflicts of interest
There are no conflicts to declare.Acknowledgements
This study is supported by Project (Grant No. QMSI2022Z-03) of Qiqihar Academy of Medical Sciences and Science and Technology Plan Project (Grant no. LSFGG-2022060) of Qiqihar Science and Technology Bureau of Heilongjiang Province of China.References
- L. Xiang, B. Q. Zheng, L. W. Hao, S. H. Zhang, Y. Zhang, B. Qi and S. N. Tang, Chinese Livestock and Poultry Breeding, 2022, 18, 12–13 Search PubMed.
- G. X. Liu, Swine Production, 2021, vol. 3, pp. 4–6 Search PubMed.
- H. Y. Wang, Swine Industry Science, 2018, vol. 35, pp. 40–42 Search PubMed.
- L. Zhang, Y. J. Zhang, Y. N. Wang, Y. M. Wang, P. C. Dong, X. Luo and Y. W. Mao, Sci. Technol. Food. Ind., 2022, 12, 1–11 Search PubMed.
- Q. Z. Cao, Agri. Eng. Technol., 2022, 42, 89–90 Search PubMed.
- Y. Cong, H. Dong, X. Y. Wei, L. Q. Zhang, J. K. Bai, J. L. Wu, J. X. Huang, Z. Q. Gao, H. Ueda and J. H. Dong, Ecotoxicol. Environ. Saf., 2019, 182, 1094731–1094736 CrossRef.
- G. H. Deng, S. Y. Chen, J. Gao and H. Wang, Chin. J. Anal. Labor., 2012, 31, 25–28 CAS.
- R. L. Zhang, B. Zhang, W. H. Jian and F. Y. An, Agri. Technol. Serv., 2018, 5, 72–73 Search PubMed.
- R. Y. Zhang, W. T. Li, Z. Shi, J. X. Chen and X. Li, J. Food Safe. Qual., 2017, 8, 3831–3836 Search PubMed.
- X. L. Sun, X. L. Li, X. M. Cao, Y. F. Yang, J. Wang, S. T. Wang, Y. D. Wang, X. Y. Wang and Z. N. Qu, Anal. Chem., 2017, 45, 124–132 CAS.
- B. Velasco-Bejarano, R. Velasco-Carrillo, E. Camacho-Frias, J. Bautista, R. López-Arellano and L. Rodríguez, Drug. Test. Anal., 2022, 14, 1130–1139 CrossRef CAS PubMed.
- B. Velasco-Bejarano, A. Gómez-Tagle, M. O. Noguez-Córdova, M. L. Zambrano-Zaragoza, A. Mirabda-Molina, J. Bautista, L. Rodríguez and R. Velasco-Carrillo, Food Chem., 2022, 370, 131–261 CrossRef.
- A. B. Cai and L. W. Wang, Yunnan Chem. Technol., 2018, 45, 89–90 Search PubMed.
- W. W. Zhang and W. Niu, Chem. Eng. J., 2016, 30, 56–58 CAS.
- L. Yang, C. Yue, Y. T. Zhang, Q. W. Kou, Y. J. Zhang, Y. X. Wang, L. Chen, Y. T. Sun, H. L. Zhang and Y. M. Jung, Molecules, 2018, 23, 2–10 Search PubMed.
- F. Nicolson, L. E. Jamieson, S. Mabbott, K. Plakas, N. C. Shand, M. R. Detty, D. Graham and K. Faulds, Analyst, 2018, 143, 5965–5973 RSC.
- Y. Gu and Y. Feng, Lishizhen Med. Mater. Med. Res., 2006, 17, 2589–2590 CAS.
- L. Li, F. Xu, G. Sun, M. R. Sun, S. S. Jia, H. M. Li, T. Xu, H. L. Zhang, Y. Wang, Y. Guo and T. H. Liu, Spectrochim. Acta, Part A, 2021, 252, 119–490 Search PubMed.
- H. M. Sui, Y. Wang, Z. Yu, Q. Cong, X. X. Han and B. Zhao, Talanta, 2016, 159, 208–214 CrossRef CAS.
- H. M. Sui, Y. M. Wang, X. L. Zhang, X. L. Wang, W. N. Cheng, H. L. Su, X. Wang, X. Y. Sun, X. X. Han, B. Zhao and Y. Ozaki, Analyst, 2016, 141, 5181–5188 RSC.
- L. Li, F. Xu, G. Sun, M. R. Sun, S. S. Jia, H. M. Li, T. Xu, H. L. Zhang, Y. Wang, Y. Guo and T. H. Liu, Spectrochim. Acta, Part A, 2021, 252, 119490–119510 CrossRef CAS.
- K. Guo, Y. J. Li, S. H. Chen and R. Xiao, Mil. Med. Sci., 2017, 41, 540–542 CAS.
- R. Hao, C. J. Zhang, Y. Lu, D. J. Zhang, Y. W. Hao and Y. Q. Liu, Prog. Chem., 2016, 28, 1186–1195 CAS.
- J. Ma, D. D. Kong, X. H. Han, W. L. Guo and X. F. Shi, Spectrosc. Spectral Anal., 2013, 33, 2688–2693 CAS.
- L. X. Xia, H. B. Wang, J. Wang, K. Gong, Y. Jia, H. L. Zhang and M. T. Sun, J. Chem. Phys., 2008, 9, 3703–4713 Search PubMed.
- Z. Y. Zhu, R. A. Gu and T. H. Lu, Application of Raman spectroscopy in Chemistry, North. Univ. Press, 1998 Search PubMed.
Footnote |
| † Electronic supplementary information (ESI) available: Fig. S1: Spectrograms of different solutions; Fig. S2: Raman spectra of salbutamol sulfate powder (A) and terbutaline sulfate powder (B); Table S1: Comparison between the TLC-SERRS and the HPLC-MS/MS to determine of the two residues in pig liver. See DOI: https://doi.org/10.1039/d3ra07202a |
| This journal is © The Royal Society of Chemistry 2023 |


