 Open Access Article
A hollow void catalyst of Co@C(Z-d)@void@CeO2 for enhancing the performance and stability of the Fischer–Tropsch synthesis†
Masoud Safari,
Ali Haghtalab * and
Farzaneh Arabpour Roghabadi
Faculty of Chemical Engineering, Department of Process, Tarbiat Modares University, P.O. Box: 14115-143, Tehran, Iran. E-mail: haghtala@modares.ac.ir
First published on 1st August 2023
Abstract
To enhance the catalyst performance of Fischer–Tropsch synthesis (FTS), removing the mass-transfer restriction in the catalysis synthesis is essential. Although the core–shell nanostructures can improve the activity and stability of the catalyst, they can restrict the reactants' diffusion towards the active sites and the transfer of the products from these sites in FTS. Creating an adequate porosity between the core and the outer shell of the catalyst structure can tackle this issue. In this work, the synthesized cobalt-based nano-catalyst is encapsulated with two shells and a middle porous shell. The first shell is a carbon shell at the core of the catalyst derived from ZIF-67, the second one is the outer shell of ceria, and the middle porous shell is formed by removing the sacrificial silica shell through the etching technique. The characterization and performance tests represent significant evidence of the etching treatment's impact on the FTS catalyst performance. Besides, molecular dynamics simulation is also utilized to clarify its effect. The FTS catalytic performance is enhanced more than 2 times with the etched catalyst versus the catalyst without it at 17.5 bar and a (H2/CO) ratio of 1.2. In addition, not only does the etched catalyst with high porosity play the role of a nanoreactor and intensify its catalytic performance, but it also has higher stability.
1. Introduction
The Fischer–Tropsch synthesis (FTS) reaction is the critical step in the gas to liquid (GTL) process, the process that produces clean fuels from syngas (H2 and CO) which is derived from methane reforming or coal and biomass gasification. The catalyst plays a major role in the FTS. To enhance the catalyst performance, one could focus much attention on the catalyst specifications such as metal particle size, dispersion, and accessibility.1 Alongside these attributes, stability is the principal feature that should be considered, particularly in the harsh thermal conditions of FTS. In recent years, a noticeable focus on the core–shell cobalt-based catalyst in FTS has occurred.2–5 Core-shell nanostructures can enhance the activity and stability of the catalyst by providing well-controlled size, shape, and surface properties. Furthermore, they can improve the catalyst selectivity by employing a porous shell.6,7 In addition, the core–shell nano-catalysts can provide uniform dispersion of the metal nanoparticles (MNPs) as active sites, and high metal loading leads to significant improvement of their activity.2–4,6–8There is a wide range of researches on FTS cobalt-based catalysts that utilize the core–shell structure. A prominent achievement is represented by encapsulating the cobalt nanoparticles with two shells consisting of an inert nanolayer of carbon which encapsulates and immobilizes cobalt nanoparticles in the core and the main outer shell is formed by inorganic oxides like SiO2 or TiO2.1,4,9–12 The carbon nanolayers can be derived from a metal–organic framework (MOF) such as ZIF-67, which can provide the highest cobalt dispersion due to the confinement effect of the carbon framework.1,9 The inorganic oxides have presented significant features like the simplicity of fabrication, tunability of formation, cost-effectiveness, tunable morphology, adjustable sizes, extensive surface area, and pore volume. So, these metal oxides can be nominated as the best material for synthesizing the outer shell.8
Although the inorganic oxide shell has many suitable attributes, its multi-layer matrix structure reduces the reactants' and products' mass transfer rate through the FTS process. Besides, in core–shell structure, the outer shell may cover some of the active Co sites, leading to a decline in the accessibility of the reactants, and then a diminution occurs in the CO conversion.9
In this work, a novel catalyst structure is introduced to tackle this issue. First of all, according to recent studies,1,9,10 ZIF-67 is synthesized and the nano-porous carbon layers are derived from it through the thermal steps. Nano-porous carbon layers encapsulate the active cobalt sites and provide a suitable dispersion at the catalyst's core. The core is encapsulated by two shells that are SiO2 and CeO2, where the middle one is employed as a sacrificial shell and removed at the end step of catalyst preparation, providing adequate hollow space to facilitate the diffusion of reactants towards the active sites or transfer of products out of them. The outer shell, CeO2, is formed to involve the mentioned features of the inorganic oxide. Following the initial evaluation of the characteristics of the synthesized catalysts, we studied their performance in the FTS. Accordingly, for a better understanding of the porous shell impacts on the performance of the catalyst in the FTS, the diffusion of the reactants and products is evaluated by employing molecular dynamic (MD) simulation.
2. Experimental and theoretical approach
2.1 Catalyst synthesis
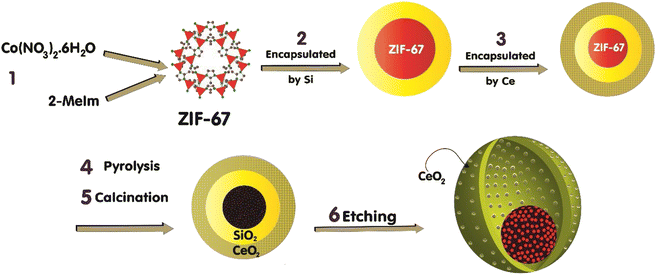
The fabrication of the catalyst, which is conducted in a multi-step procedure, is depicted in Fig. 1. Initially, the zeolitic imidazolate framework (ZIF-67) that contains Co(MeIm)2 (MeIm = 2-methylimidazolate) is synthesized. Then, in the second step, the ZIF-67 is encapsulated by the SiO2 through the impregnation and hydrolysis of tetraethyl orthosilicate (TEOS). In the third step, via the impregnation technique, the ZIF-67@SiO2 is encapsulated by the Ce(III) salt crystals. Subsequently, the catalyst thermal treatment approaches are initiated by the pyrolysis of the sample at 610 °C under N2 for 4 h, followed by the calcination in air at 350 °C for 2 h.1 As a result, ZIF-67 acts as a sacrificial template and converts to a porous carbon that encapsulates the cobalt nanoparticles. Although calcination in air may remove some of carbon layer, the chosen calcination conditions9 do not result in the complete carbon removal which is confirmed later by FE-SEM/EDX mapping. Besides, through the thermal treatment step, the CeO2 is formed, and the obtained black brown powder is Co@C(Z-d)@SiO2@CeO2. To achieve a porous shell throughout the catalyst, the layers of SiO2 is removed via the etching technique through the chemical treatment step by applying aqueous NaOH (1 N) at 50 °C for 10 h. After this step, our sample is in the form of Co@C(Z-d)@void@CeO2. Eventually, the catalyst preparation is accomplished by reducing it in the presence of H2 to achieve the cobalt metallic species. In order to study the impact of the etching treatment on the catalyst performance and features, we prepared two catalysts; one of them is etched (NC–V) and the other one is not etched (NC). The detailed methods of catalyst preparation are explained as follows.2.1.1.1 Synthesis of the ZIF-67. Firstly, 1.83 g of Co(NO3)2·6H2O is dissolved in 100 mL methanol, and separately a 100 mL solution of methanol including 5.49 g of 2-methylimidazole (MeIm) with 0.2 g CTAB is prepared. Then, the two solutions are mixed under vigorous stirring for 15 min followed by aging for 30 h at room temperature. Afterward, the bright purple products are separated by a centrifuge, washed with methanol, and dried in a vacuum oven at 80 °C for 12 h.
2.1.1.2 Synthesis of ZIF-67@SiO2. Initially, 0.5 g of the synthesized ZIF-67 is dissolved in 100 mL ethanol, then a 100 mL solution of 1% weight ratio of CTAB and deionized water is added to the initial solution. Next, 5 mL of TEOS is added drop by drop during stirring at the temperature of 50 °C for 2 h. After 20 h of remaining at room temperature, the sediment is separated by centrifugation, followed by vacuum drying at the temperature of 85 °C for 20 h.
2.1.1.3 Synthesis of ZIF-67@SiO2@CeO2. 1 g of ZIF-67@SiO2 and 5 g of Ce(NO3)3·6H2O are separately dissolved in 20 mL ethanol. Then the two solutions are mixed with gentle stirring at 37 °C until ethanol is evaporated.
2.1.1.4 Synthesis of the NC catalyst (Co@C(Z-d)@SiO2@CeO2). Initially, to pyrolysis 1 g of ZIF-67@SiO2@CeO2, a quartz tubular reactor is applied by a 3 °C min−1 heating rate for 3 h with flowing N2 (100 mL min−1) until reaching 610 °C, which maintains for 3 h in this temperature. Then, the obtained powder is calcined in the air (100 mL min−1) with heating rate of 3 °C min−1 until reaching 350 °C and remaining there for 3 h.
2.1.1.5 Synthesis of the NC–V catalyst (Co@C(Z-d)@Void@CeO2). To accomplish the etching approach, 0.5 g of Co@C(Z-d)@SiO2@CeO2 should be dissolved in an aqueous solution of NaOH (1 N) at 50 °C for 10 h. Then, the sediment is separated by centrifugation and washed with water until the system is neutralized, followed by vacuum drying at 50 °C for 20 h.
2.2 Structural characterization
The Co loading in the catalysts is measured by inductively coupled plasma atomic emission spectroscopy (ICP-OES) Varian-735. X-ray diffraction (XRD) patterns are measured by Philips X'Pert MPD X-ray diffractometer using monochromatic Co Kα radiation (λ = 0.179026 nm). From the XRD patterns cobalt, crystalline size is calculated by the Scherrer equation (2θ = 44.2°) as follows:13
 | (1) |
During the H2-TPD test, 0.07 g catalyst is perfectly reduced at 475 °C for 12 h by utilizing a H2 flow, then cooled to 100 °C in the H2 stream and held at this temperature in the Ar ambient for one hour. Later, the temperature is raised to 475 °C with 5 °C min−1 to desorb all the hydrogen. Eventually, the sample is re-oxidized at 475 °C by pulses of O2 in He as the carrier gas. By measuring the amount of oxygen consumption during the oxygen titration and based on the percentage of reduction, the DOR of each sample and the corrected dispersion can be evaluated, respectively.14,15 The test is applied in a U-tube quartz reactor with the quantachrome CHEMBET-3000 unit, which incorporates a thermal conductivity detector (TCD).
N2 adsorption–desorption isotherms and Brunauer–Emmett–Teller surface area are obtained using Micromeritics Tristar 3020 on degassed samples. TEM imaging is implemented on Talos F200X (FEI) microscopes operated at 200 kV. The cobalt crystalline diameter (dTEM) can be calculated from the TEM results by using eqn (3) if at least 200 nanoparticles are considered.
 | (2) |
To implement the field emission scanning electron microscope (FE-SEM), the TESCAN MIRA3 is utilized.
2.3 Technical description of MD simulations
To study the catalyst performance, it is crucial to engage the theoretical computations in which, in this study, the molecular dynamic (MD) simulation paves the way to obtain this achievement. The evolution of atoms over time is traced and computed by MD simulation. The trajectories of atoms are determined by numerical solving of Newton's equations of motion for a system of atoms, where forces between the atoms and their potential energies are often computed by employing interatomic potentials. In our research, all simulations are performed using LAMMPS software.16–18 Technically, in the simulation box, periodic boundary conditions are implemented in three directions.19 Furthermore, the volume of this computational box is set to 500 nm3 in two samples. Afterward, the Nose–Hoover algorithm is implemented on the atomistic systems at fix temperature of 27 °C with 0.001 fs as a simulation time step.20 Our total simulation time in modeled samples is set to 10 ns.The obtained results from the MD simulations depend on the choice of the interatomic force field. In this study, the interatomic force field for various compounds is based on universal force field (UFF) potential.21 The computation phase is implemented by determining the force field for molecules in the simulation box. Then the atomic diffusion ratio/time is computed. These coefficients averaged per 10![[thin space (1/6-em)]](https://www.rsc.org/images/entities/char_2009.gif) 000-time steps to eliminate numerical fluctuations. Because of the computational point, the mean square displacement (MSD) parameter should be calculated first to estimate the diffusion coefficient. It is the most common measure of the spatial extent of random motion and can be thought of as measuring the portion of the system estimated by the random walker.
000-time steps to eliminate numerical fluctuations. Because of the computational point, the mean square displacement (MSD) parameter should be calculated first to estimate the diffusion coefficient. It is the most common measure of the spatial extent of random motion and can be thought of as measuring the portion of the system estimated by the random walker.
In the second simulation section, after the equilibrium phase occurs in simulated structures, their thermal behavior is estimated. In this step of the calculations, the Green–Kubo approach is used to describe the thermal behavior of simulated samples.22,23 Technically, thermal calculation in the current study is performed with a micro-canonical (NVE) ensemble as the following equation:
 | (3) |
In this equation kB, V, and S define the Boltzmann constant (1.380649 × 10⁻²³ J K−1), volume, and heat vector, respectively. At each simulation time step in LAMMPS computational package, the heat current of atoms can be estimated by using velocity and stress tensor. The mean of the heat current autocorrelation function is represented by <S(t)·S(0)>.
Table 1 represents MD simulation settings in current computational research. Structurally, various atomic membranes are modeled inside MD simulation boxes. x (out shell thickness), y (porous shell/SiO2 shell diameter), and z (core diameter) constants in these membranes are the principal structural parameters which are listed in Table 2. In this model, the potential energy for an arbitrary geometry of a molecule is expressed as a superposition of bonded (Eval) and non-bonded (Enb) interactions as eqn (4):24
| E = Eval + Enb | (4) |
| MD Simulation parameter | Value/settings |
|---|---|
| Box length | 500 × 500 × 500 nm3 |
| Initial temperature | 300 K |
| Time step | 0.001 fs |
| Used ensembles | NVT |
| Temperature damping ratio | 0.1 |
| Simulation time | 10 ns |
| Membrane ID | x (nm) | y (nm) | z (nm) |
|---|---|---|---|
| NC–V catalyst | 8 | 360 | 330 |
| NC catalyst | 8 | 355 | 330 |
The bonded interactions consist of bond strength, bond-angle bend, dihedral angle torsion, and inversion terms. In this model, non-bond interaction between atoms is modeled by the Lennard–Jones (LJ) potential as below formalism:25
 | (5) |
The variables qi and qj denote the partial charge of ionic species of i and j atoms, respectively, and ε0 is the permittivity of the vacuum. The first variable of the van der Waals term prevents the overlap of the atoms and molecules, and the second term of this potential represents the short-range repulsive interaction and dipole-induced attractive interaction, respectively. In this equation, rij is the distance between two atoms, rc is the cutoff radius, and εij and σij are the energy and length scales. Both εij and σij parameters depend on the type of atoms in the simulated structure. The length scale parameter and energy for various atoms of defined compounds are listed in Table 3.21 Finally, simple harmonic oscillator equations describe the bond-based stretch in the united atom model.
| Atoms | ε (kcal mol−1) | σ (angstrom) |
|---|---|---|
| C | 0.105 | 3.851 |
| Ce | 0.013 | 3.556 |
| Co | 0.014 | 2.82 |
| H | 0.044 | 2.886 |
| O | 0.060 | 3.500 |
For computations of the atom's motion through time, Newton's second law at the atomic level is used as the gradient of the potential (force field) function in the following equation,24
 | (6) |
The Association of defined formulations is done by the Velocity-Verlet method to integrate Newton's law.26,27
2.4 Catalytic testing
The catalyst performance in the FTS process is evaluated by utilizing a mini vertical fixed bed reactor. The inner diameter of the tube is 10 mm. Due to uniform heat dispersion, 0.3 g of each catalyst is loaded into the reactor with the silicon carbide. The silicon carbide is added until the reactor is filled. The reactor's temperature schedule is as follows: first, the reactor temperature grows at the rate of 1 °C min−1 from room temperature to 475 °C and remains at this temperature for 12 h under hydrogen flow to activate the catalyst by providing reduction conditions for the catalyst. Next, by reducing the reactor temperature to operating conditions and achieving steady-state conditions, the FTS reaction experiments can be carried out. In this set, digital mass flow controllers and pressure regulators are employed to adjust the flow rate of the syngas and the pressure, respectively. The operating conditions are at a fixed temperature and GHSV of 245 °C, and 800 h−1 and at three different pressures and feed ratios of (17.5, 20, 25 bar), and (H2/CO = 1.2, 2, 1.6), respectively.Then, after the gas and liquid separation by two traps, they can be analyzed by utilizing an Agilent 7890A refinery gas analyzer (RGA) and an Agilent 7890A detailed hydrocarbon analyzer (DHA), respectively. By applying the results of the analyzers, the CO conversion (XCO) can be evaluated, and then by subtracting the fraction of CO that is used for the formation of C1 to C4 products (hydrocarbons with one to four carbons), the C5+ (hydrocarbons with more than five carbons) selectivity can be calculated. In addition, the turnover frequency (TOF) can be evaluated by dividing the mole of converted CO by the mole of active sites per reaction time.28
 | (7) |
 | (8) |
| SC5+(%) = 100 − (SC1 + SC2 + SC3 + SC4) | (9) |
3. Results and discussion
3.1 Characterization
Multiple characterization techniques have been conducted to characterize the structure and depict the effective features of the catalyst. At first, the XRD pattern of synthesized catalysts (Fig. 2a), before and after the etching step, demonstrates that the chemical treatment eliminates the silica shell while not leaving any damage to the catalyst structure. Fig. 2a displays the catalysts' crystallite NPs following the mentioned standard cards. The XRD pattern peaks of the NC–V catalyst are sharper than the NC catalyst, which implies the crystallinity growth of the NC–V catalyst through the elimination of the amorphous silica compared with the NC Catalyst. Fig. 2a compares the 2θ area in the 22° range in both catalysts. More cobalt oxide crystallites are recognized in the NC–V catalyst by (222) and (440) crystal planes (Fig. 2a). Furthermore, the cobalt crystalline size that is listed in Table 4 can be evaluated by the Scherrer equation from the results of XRD characterization.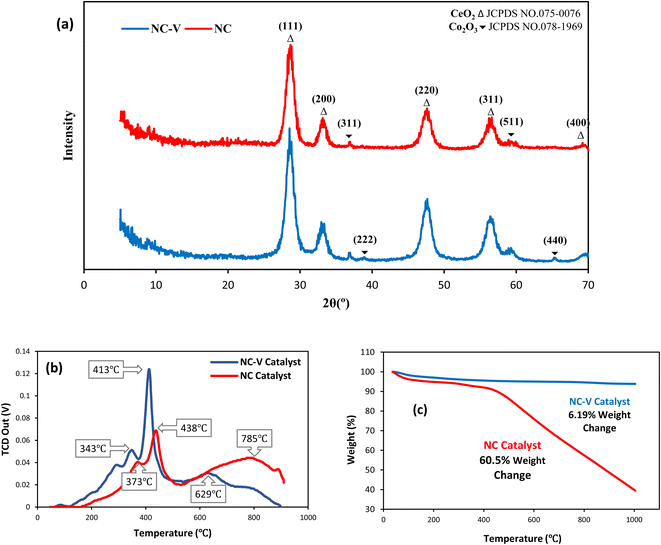 | ||
| Fig. 2 (a) XRD patterns, (b) H2-TPR profiles, (c) TGA profiles of the NC–V (blue line) and NC (red line) catalysts. | ||
| Sample | SBET (m2 g−1) | VP (cm3 g−1) | PD (nm) | Da (nm) | Db (nm) | DOR (%) | Dispersion (%) |
|---|---|---|---|---|---|---|---|
| NC–V catalyst | 414 | 0.445 | 4.3 | 6.76 | 8.84 | 78.1 | 11.24 |
| NC catalyst | 219 | 0.118 | 2.16 | 7 | 9.87 | 65.73 | 10.07 |
Then, the temperature-programmed reduction in H2 (H2-TPR) is conducted to study the reducibility of the metallic species of the catalyst. Fig. 2b illustrates the H2-TPR curves of both catalysts, which depict three prominent peaks. Following Jacobs et al.29 the first peak indicates the reduction of Co3O4 to CoO, and the second one expresses the reduction of metallic Co. The NC–V catalyst's H2-TPR patterns demonstrate that these reduction peaks are approximately placed at low temperatures of 343 and 413 °C, respectively. Furthermore, a tiny peak can be detected for this catalyst at a lower temperature of 300 °C. As a result, silica removal paves the way for reducing the Co nanoparticles (NPs) with lower energy consumption. In contrast, the peaks of the H2-TPR of the NC catalyst initiate at 373 °C and follow by the second one at 438 °C. In addition, due to the existence of cobalt silicate which is hardly reduced, the third peak in the NC catalyst occurs at a higher temperature of 785 °C with a broader band compared with the NC–V catalyst which is considered another evidence of the silica removal during the etching step of the NC–V catalyst synthesis and shows the silica removal's role on facilitating the catalyst reduction at lower temperatures. As Fig. 2b shows, the third peak for the NC–V catalyst is at 629 °C. Furthermore, following the Trovarelli30 report, the majority of ceria reduction happens at the temperature range of 600–850 °C, so the third peak also covers the ceria reduction while it reveals that the reduction of ceria in the NC catalyst in the presence of silica is harder than the etched catalyst (NC–V). Besides, the low TPR peaks of the NC–V catalyst imply the facilitated reduction owing to the etching treatment.
In addition, to reveal the impact of the etching treatment on the catalyst performance, the degree of reduction (DOR) and the rate of Co active sites dispersion is evaluated by the hydrogen temperature programmed desorption (H2-TPD) and oxygen titration. The results of these parameters are rendered in Table 4 which represents that the NC–V catalyst has higher DOR and appropriate dispersion of Co active sites compared to the NC catalyst. Thus, these results indicate that the silica coating at the NC catalyst engages more Co active sites than the NC–V catalyst. Besides, the average size of cobalt particles is also derived from the H2-TPD test.14 In both characterizations (XRD, and H2-TPD), there is not a significant distinction between the size of both catalysts, indicating no destructive impact of the etching step on the particle size of the catalyst.
Moreover, the thermal gravimetric analysis (TGA) is implemented to study the range of temperature decomposition of both catalysts, representing a stunning distinction between them as shown in Fig. 2c. The NC–V catalyst loses its weight by less than 5% until 400 °C while NC catalyst loses more than 11%. Besides, the NC catalyst is decomposed roughly to 40% of its initial mass until 1000 °C; on the contrary, the NC–V catalyst does not lose more weight than 6% during the same raising temperature condition which is in good agreement with the other works.31,32 The weight loss of the NC catalyst is roughly the same as that of silica-coated catalysts in the other literature.9,33 The TGA results reveal the impact of the internal void space as an insulator on increasing the NC–V catalyst thermal stability. In this regard, to indicate the role of NC–V catalyst's internal void space in its thermal stability, the thermal resistance of both catalysts is compared by computing their thermal conductivity with MD. If the thermal conductivity of the catalyst is lower, the heat transfer to the core of the catalyst will be restricted and the catalyst decomposition will be decreased. The catalyst decomposition occurs when metal oxides' bulk oxygen ions transfer to the surface sites34,35 or the carbon layer oxidizes at a high temperature. Hence, low thermal conductivity can provide suitable resistance versus high-temperature increases.
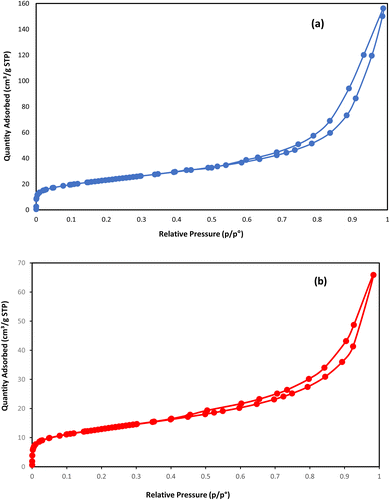
To compare the textural properties of the two catalyst samples N2-adsorption/desorption is utilized. Both of the catalysts display the type IV adsorption isotherm with type H2 hysteresis that locates at P/P0 ≈ 0.45 and P/P0 ≈ 0.54 for the NC catalyst and NC–V catalyst, respectively (Fig. 3a and b). Furthermore, Table 4 represents the other textural properties of catalysts, the Brunauer–Emmett–Teller area (SBET), and the total pore volume (VP) of the NC–V catalyst is placed at a higher level than the NC catalyst. Also, the pore diameter (PD) of the NC–V catalyst with 4.3 nm is higher than the NC catalyst with 2.16 nm. These results reveal chemical treatment's impact on modifying the catalyst's porosity. Besides, diagrams of the pore volume versus the pore diameter in Fig. 4a and b exhibits that roughly 70% of NC–V catalyst particles are mesoporous; on the contrary, 69% of NC catalyst particles are microporous. The microporous particles ratio to the mesoporous particles in the NC–V and NC catalysts is 0.24 and 2.27, respectively. Hence, the NC–V catalyst's mesoporous structure implies the internal porous shell in the etched catalyst.
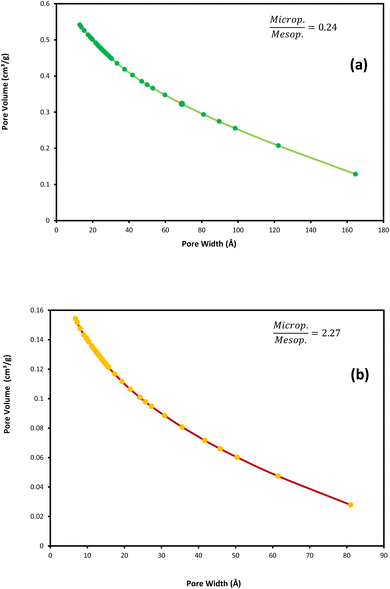 | ||
| Fig. 4 BJH adsorption cumulative pore volume (pore size distribution): (a) NC–V catalyst and (b) NC catalyst. | ||
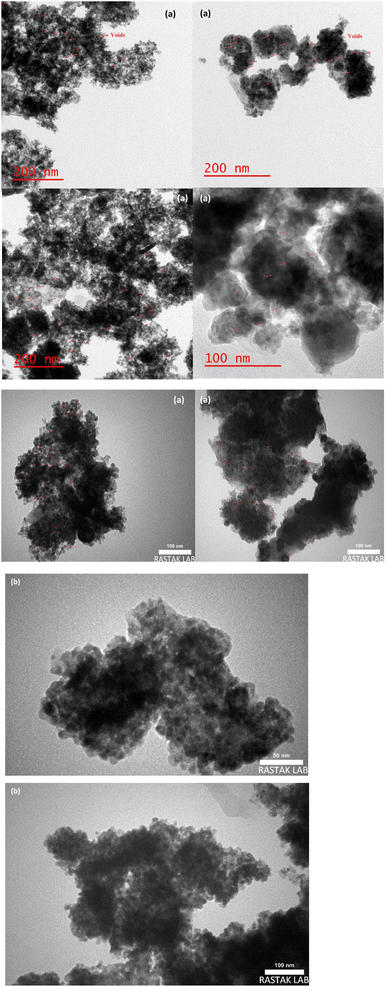
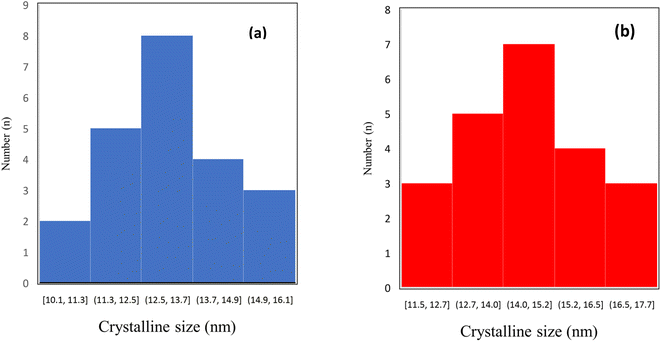
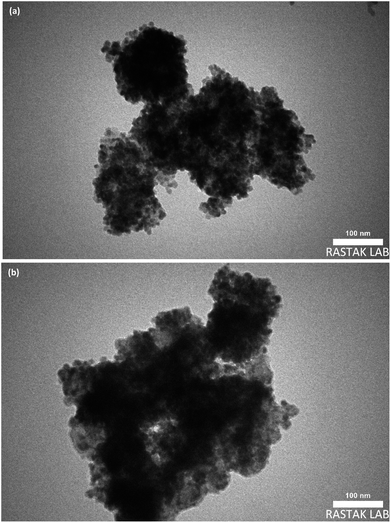
TEM and FE-SEM/EDX are applied to provide more information on the textural properties of both types of catalysts. Representative TEM images of the catalyst samples are displayed in Fig. 5a and b which reveal internal void spaces in the etched catalyst by red remarking in contrast with the not etched catalyst. Besides, the crystallite size distribution diagram of each catalyst is shown in Fig. 6a and b. In addition, the TEM images of spent catalysts after TOS of 192 h are shown in Fig. 7a and b. After the etching step, the NC–V catalyst images have much brighter areas around the darker central core of Co3O4@C. These very bright areas are related to the removal of a part of the silica layer in the core–shell structure, which is more reflective than the rest of the parts. The etching treatment does not completely remove the silica layer but only randomly removes the silica in this layer, and this area is brighter than the rest of the areas in the TEM image. The phenomenon of cavity formation has also been confirmed by BET analysis, that the surface area of the sample has increased due to the etching effect, which is the reason for the formation of internal void spaces in the NC–V catalyst.
The FE-SEM map data (Fig. S1 and S2 in ESI†) indicates a uniform elemental distribution all over both catalyst samples and gives prominent evidence of silica shell elimination in the NC–V catalysts. Besides, they reveal that the carbon nanolayer is maintained, despite the calcination of the catalyst in the air following Wang et al.10 Besides, the results of imaging methods reconfirm that not only the chemical treatment step does not leave any damage but also plays the role of a catalyst decorator to reveal the catalyst's active sites. Furthermore, the results of the chemical composition of the catalyst samples are expressed in Table 5, which the FE-SEM/EDX and ICP-OES measures. The comparison of Si percentage in both catalysts that are presented in Table 5 highlights the Si elimination through the etching step, although a mild percentage of Si has remained. Due to the removal of the silica coating, more percentage of active cobalt sites can be achieved, and as a result, the etched catalyst (NC–V) represents higher cobalt loading values than the NC catalyst, which is demonstrated in Table 5. The cobalt amounts in the NC catalyst that the ICP-OES reports are roughly 12% lower than the NC–V catalyst. The etching step modifies the catalyst and makes more accessways towards active cobalt sites by removing the majority of the silica coating shell. As Table 5 demonstrates, not only the cobalt NPs are unwrapped during the etching step, but also the ceria particles are mostly flourished.
| Sample | Elemental content (FE-SEM/EDX) % | Elemental content (ICP-OES) w% | ||||
|---|---|---|---|---|---|---|
| Co | Si | Ce | Co | Si | Ce | |
| NC–V catalyst | 18.19 | 12.26 | 69.55 | 27.8 | 11.6 | 60.6 |
| NC catalyst | 11.5 | 46.17 | 42.33 | 13.7 | 49 | 37.3 |
3.2 Molecular simulation
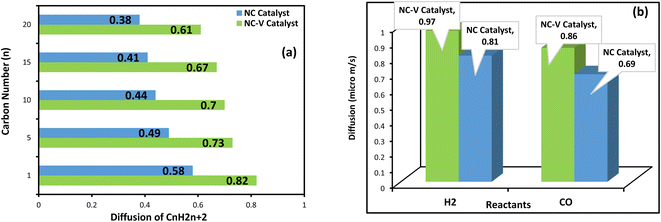
Since the mass transfer has a critical impact on the FTS catalyst performance, the diffusion coefficient of the reactants (H2 and CO) and paraffinic products with the carbon number n (n = 1, 5, 10, 15, 20) are evaluated by the MD simulation. In addition, to disclose the reason for the high thermal stability of the NC–V catalyst, the role of the internal porous shell in the catalyst's thermal resistance is evaluated by computing the thermal conductivity of both catalysts.The results of the MD computations are depicted in Fig. 8a and b. Not only does the diffusion of the reactants in the NC–V catalyst overtake the NC catalyst, but also the diffusion of the hydrocarbon products outside of the NC–V catalyst is higher than in the NC catalyst. In addition, the MD results illustrate a descending pattern for the diffusion values of the hydrocarbon chains in both catalysts, which have occurred by increasing the number of carbon atoms. The descending pattern becomes more noticeable from methane to pentane which then continues with a gradual trend that not only does it bring a simple confirmation of MD simulation correctness by obvious evidence but also compares the catalysts' confinement for the diffusion of the components with different molecular weight.
As Table 6 illustrates, the calculated thermal conductivity of the NC catalyst, 15.24 W m−1 K−1, is roughly 18.5% more than the NC–V catalyst. Besides, the computed heat flux value in the NC catalyst, 0.831 W m2, is higher than the NC–V catalyst with a value of 0.696 W m2. Hence, the MD computations reconfirm that the thermal resistance of the NC–V catalyst is higher than the NC catalyst.
| Sample | Heat flux (W m2) | Thermal conductivity (W m−1 K−1) |
|---|---|---|
| NC–V catalyst | 0.696 | 12.86 |
| NC catalyst | 0.831 | 15.24 |
3.3 Catalyst performance
We evaluate each catalyst's performance in the FTS under three series of circumstances, which are expressed in Table 7. The NC–V catalyst at the 17.5 bar and feeds ratio of 1.2 presents higher CO conversion and C5+ selectivity in comparison with the NC catalyst, with 48% and 93.47% respectively. Although the CO conversion of both catalysts increases at a higher pressure of 20 bar and the H2/CO ratio of 2, the methane selectivity (SC1) grows, and C5+ selectivity reduces. Not only the highest XCO of 86% is achieved at the highest pressure (25 bar) and feed ratio of 1.6, but also the lowest SC1 of 4% is achieved in the NC–V catalyst. To explain the above results, the Co loading, dispersion, and reducibility should be considered because they represent the available active cobalt sites that have a significant role in the CO conversion.1 Based on the dispersion, DOR, and Co loading results which are listed in Tables 4 and 5, respectively, the NC–V catalyst has more potential to provide active cobalt sites than the NC catalyst. Besides, the experimental values of cobalt time yield (CTY) in FTS for the NC–V catalyst, presented in Table 7, are higher than the NC catalyst. Furthermore, the turnover frequency (TOF) results for both catalysts (Table 7) reveal the same pattern. According to CTY values which present the activity per gram of cobalt, imply the presence of another agent by eliminating the impacts of cobalt loading on CO conversion, and the importance of mass transfer rate is shown. Considering the MD computations, the diffusion coefficient values of CO, H2, and hydrocarbon product molecules in the NC catalyst are smaller than in the NC–V catalyst, since the mass transfer of the reactants and products decline through the matrix layers of the SiO2 shell. It is one of the principal reasons for the lower CO conversion and C5+ selectivity of the NC catalyst in comparison with the NC–V catalyst. Hence, the etching step by removing the silica layer raises the accessibility towards the active sites by soaring the cobalt loading and facilitating the mass transfer. This leads to achieving a significant catalyst performance in FTS. Besides, although the diffusion coefficient of syngas molecules (H2 and CO) into the NC catalyst is lower than NC–V catalyst, trapping of the heavy hydrocarbons in the matrix of the SiO2 shell as a result of mass transfer resistance in the SiO2 shell9 boosts the syngas mass transfer rate reduction in NC catalyst; so, it leads to a decreased contribution chance for the new CHx intermediates species in the chain growth step of the FTS mechanism and boosts the methanation route by putting forward the terminate step and the selectivity of the NC catalyst in the FTS process shifts towards lower hydrocarbons, in particular, methane.| Sample | Pres. (bar) | H2/CO | CO (conv.%) | CTY (10−4 mol CO g−1 Co s−1) | TOF (10−3 s−1) | SC1 (%) | SC2–4 (%) | SCO2 (%) | SC5+ (%) |
|---|---|---|---|---|---|---|---|---|---|
| NC–V catalyst | 17.5 | 1.2 | 48 | 5.2 | 8.1 | 4.4 | 2.13 | 0.025 | 93.47 |
| NC–V catalyst | 20 | 2 | 81 | 12 | 18.5 | 5 | 2.2 | 0.006 | 92.8 |
| NC–V catalyst | 25 | 1.6 | 86 | 13 | 19.6 | 4 | 1.58 | 0.01 | 94.42 |
| NC catalyst | 17.5 | 1.2 | 18.2 | 2.2 | 3.9 | 7.6 | 7.2 | 0.035 | 85.2 |
| NC catalyst | 20 | 2 | 39 | 6.4 | 11.2 | 11 | 6 | 0.01 | 83 |
| NC catalyst | 25 | 1.6 | 63 | 10 | 18.1 | 8.8 | 4 | 0.02 | 87.2 |
CO2 is mainly formed by the water gas shift reaction. According to the other studies,36,37 a high tendency to reverse water gas shift reaction for the Co/CeO2 catalysts at the low temperature is observed, which is derived from the low tendency of Co NPs to WGSR and ceria's oxygen vacancies with a high tendency to CO2 adsorption. Hence, during the catalytic tests, a negligible CO2 selectivity is detected, which is lower in the NC–V catalyst than in the NC catalyst (Table 7).
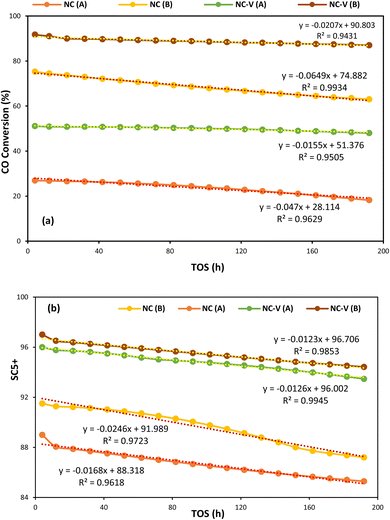
On the other hand, Fig. 9a and b depict, respectively, the CO conversion and SC5+ values for each catalyst versus time on stream (TOS) of 192 h at the two different operating conditions (A: 245 °C, 17.5 bar, H2/CO = 1.2, and GHSV = 800 h−1 – B: 245 °C, 25 bar, H2/CO = 1.6, and GHSV = 800 h−1). It presents that the NC–V catalyst has considerably higher stability in both operating conditions with a noticeable distinction in CO conversion. The NC–V catalyst loses its conversion by approximately 6% which its trend is shown in Fig. 9 by two lines, each of them having a slope of 0.0155 and 0.0207 at (A) and (B) conditions, respectively. In contrast, Fig. 9a exhibits that the NC catalyst performance reduces by 32% and 16% at the (A) and (A) conditions, respectively, with the line's slope of 0.047 and 0.0649. Besides, Fig. 9b indicates that the SC5+ decreases more noticeably in the NC catalyst, with line's slope of 0.0168 and 0.0246 than in the NC–V catalyst, with line's slope of 0.0126 and 0.0123, at the (A) and (B) conditions, respectively.
3.4 Discussion
Not only internal void spaces are shown in the TEM images of the etched catalyst, but also their footprint on the characterization tests, particularly TGA is sensible owing to its dramatic impact on the thermal stability by increasing the thermal resistance. Moreover, the N2-adsorption/desorption test reveals that the etched catalyst complies with the mesoporous structure which implies its internal porous shell. Besides, the diffusion and thermal conductivity results of the MD simulation prove the porous shell's impact on the catalyst performance. The mentioned results imply that adequate porosity has a significant impact on the FTS catalyst performance. In addition, the SBET values of catalysts illustrate that the surface area of the NC–V catalyst is noticeably higher than the NC catalyst, which significantly enhances its catalytic performance. The FTS products, in particular hydrocarbons with more than five carbons (C5+), which are the main target products, should leave the active sites after spending adequate residence time. Although the core–shell structure restricts diffusion, the structure with adequate porosity provides a suitable condition by facilitating product diffusion in the FTS catalyst.9,38,39 The MD results confirm the porous shell impact by reporting a higher amount of diffusion coefficients of reactants and products in the NC–V catalyst with void space than in the NC catalyst without void space. The synthesized NC–V catalyst's properties comply with the heterogeneous catalysts that represent nanoreactors. Because of the catalyst's unique structure, in which a porous carbon shell encapsulates the active cobalt sites at the core of the catalyst, a porous shell surrounds the core, and core's encapsulation by porous ceria as the outer shell, the NC–V catalyst can be presented as an effective nanoreactor.40–43Etching at the end of catalyst fabrication steps provides an adequate void space between the core and outer shell of CeO2. This nanoreactor framework intensifies the operative pressure and temperature by creating an effective confinement void around the active sites. Besides, not only does the porous shell of this nanoreactor framework supply adequate void space for conducting the reaction effectively, but also the accessibility to the active cobalt sites is significantly facilitated owing to removing the majority cover of the silica shell that coated the active cobalt sites or bonded with them as cobalt silicate. Therefore, through this structure, the entire metal sites at the core might be accessible, and the NC–V catalyst structure's ability to perform FTS is higher in comparison with the core–shell configuration of the NC catalyst. In particular, in comparison with the NC catalyst, at low pressure and with the minimum ratio value of H2/CO, a noticeable CO conversion with high selectivity to C5+ can be achieved in the FTS process in the presence of the NC–V catalyst (Table 7). On the other hand, it is essential to supply high pressure which means high energy consumption to obtain an appropriate CO conversion by the NC catalyst. Thus, even though high pressure leads to higher CO conversion in the NC catalyst, the selectivity grows towards unsuitable products like methane, and a tiny growth occurs for C5+. Furthermore, compared with the NC catalyst, the NC–V catalyst illustrates higher conversion at a higher pressure, and the selectivity to lighter hydrocarbons has a slight drop.
From another point of view, after the FTS process reaches a steady state condition, the products are formed and occupy the pores of the catalyst, which can lead to the reduction of the reactants (H2, CO) accessibility to the active sites and as a result, the CO conversion may decrease. Because the accumulation of the primarily generated hydrocarbons, particularly in the core–shell structure of the NC catalyst, does not allow the reactants to reach the active cobalt sites, the CO conversion is reduced. Therefore, the diffusion value of products has a crucial role in enhancing the catalyst performance.
It should be mentioned that trapping the products in the pores of the catalyst may increase the residence time and lead to chain growth through re-adsorption or secondary reaction, particularly of the smaller chains. Eventually, the high selectivity to the longer hydrocarbon chains could be achieved. Still, in agreement with the literature that applied the encapsulated cobalt-base catalyst by silica,1,9,11 this core–shell structure would restrict the reaching of the reactants (H2, CO) to the active sites. Therefore, although the longer residence time may enhance the longer chain products, it shouldn't be as much to reduce the reaction yield by restricting the conversion that leads to low heavier hydrocarbon formation. The experimental results confirm that the desirable situation can be achieved through the etched catalyst (NC–V). Following the review study of Zhou Wei et al.44 the mesoporosity of the catalyst suppresses the light hydrocarbons. The low selectivity of the NC–V catalyst towards the light hydrocarbons which have two to four carbons (SC2–4%) indicates that the void space can pave the way to enhance the selectivity toward hydrocarbons with more than five carbons (SC5+%) by facilitating the diffusion of reactants and products. Moreover, the higher DOR of the etched catalyst in comparison to the silica-coated catalyst provides a higher percentage of cobalt active sites which leads to higher CHx formation and intensifies the C–C bonds formation to the carbon chain growth significantly. Therefore, lower selectivity to the light hydrocarbons (C2–C4) occurs in the NC–V catalyst versus the NC catalyst.
On the other hand, the stability of the etched catalyst is higher than the without etched catalyst. TGA test indicates a low significant weight loss under high temperatures for the etched catalyst, which reveals its high thermal stability. Besides, the MD computations highlight the only structural distinction of these catalysts, the internal porous shell, which reduces the catalyst's thermal conductivity value at the NC–V catalyst. So, the internal porous shell plays the role of thermal resistance in the etched catalyst which reduces the heat transfer to the core of the catalyst due to the lower thermal conductivity and protects the catalyst from decomposition. Besides, the evaluation of CO conversion variation during TOS of 192 h indicates that the NC–V catalyst has remarkable stability during the FTS process. The TEM image of the spent NC catalyst indicates darker spots than the NC–V catalyst, which reveals the agglomeration of catalyst NPs. In contrast, the TEM image of the NC–V catalyst's spent sample illustrates the same duplicate as the fresh NC–V catalyst, which verifies its high stability against deactivation. As a result, the internal porous shell raises the catalyst's resistance against harsh thermal conditions and improves its stability significantly.
4. Conclusion
Overall, the FTS catalyst employed in this work could be introduced as a multi-shell cobalt-based catalyst which had two shells made out of derived carbon from ZIF-67 and ceria, respectively, and an internal porous shell between these two shells that encapsulated the cobalt active sites. The etching technique accomplished the FTS catalyst decoration by creating a porous shell without leaving any damage. The etched catalyst with the porous shell promotes the diffusion of reactants and products, and simultaneously the elimination of the silica shell intensified the accessibility towards the Co-active sites through the etching step. In addition, the catalyst reducibility improved alongside the remarkable thermal stability of the catalyst. Due to the MD computations that illustrated the thermal conductivity value for the catalyst without the void space is higher, it can be concluded that the internal void space of the etched catalyst structure acted as thermal resistance. Therefore, the etched catalyst enhances the FTS catalyst performance compared to the without etched catalyst.Author contributions
Masoud Safari: writing – original drafting, data curation, investigation, software, validation, formal analysis, visualization. Ali Haghtalab: conceptualization, methodology, supervision, resources, writing – reviewing and editing, project administration, software, funding acquisition. Farzaneh Arabpour Roghabadi: formal analysis.Conflicts of interest
The authors declare that they have no known competing financial interests or personal relationships that could have appeared to influence the work reported in this paper.Acknowledgements
The authors greatly appreciate the research grant of the vice president of research and technology of Tarbiat Modares University.References
- X. Sun, et al., Manufacture of highly loaded silica-supported cobalt Fischer–Tropsch catalysts from a metal-organic framework, Nat. Commun., 2017, 8(1), 1–8 CrossRef PubMed.
- C. Gao, F. Lyu and Y. Yin, Encapsulated metal nanoparticles for catalysis, Chem. Rev., 2020, 121(2), 834–881 CrossRef.
- H. O. Otor, J. B. Steiner, C. García-Sancho and A. C. Alba-Rubio, Encapsulation methods for control of catalyst deactivation: a review, ACS Catal., 2020, 10(14), 7630–7656 CrossRef CAS.
- C. Qin, J. Bai, Y. Xu, Y. Du, J. Wang and M. Ding, A high active sites exposed hollow Co@SiO2 nanoreactor for high-performance Fischer–Tropsch synthesis, Fuel, 2022, 323, 124377 CrossRef CAS.
- C. Xing, et al., A hierarchically spherical co-based zeolite catalyst with aggregated nanorods structure for improved Fischer–Tropsch synthesis reaction activity and isoparaffin selectivity, Microporous Mesoporous Mater., 2016, 233, 62–69 CrossRef CAS.
- M. Rahmati, M.-S. Safdari, T. H. Fletcher, M. D. Argyle and C. H. Bartholomew, Chemical and thermal sintering of supported metals with emphasis on cobalt catalysts during Fischer–Tropsch synthesis, Chem. Rev., 2020, 120(10), 4455–4533 CrossRef CAS PubMed.
- Q. Zhang, I. Lee, J. B. Joo, F. Zaera and Y. Yin, Core–shell nanostructured catalysts, Acc. Chem. Res., 2013, 46(8), 1816–1824 CrossRef CAS.
- M. Safari and V. Nobakht, Encapsulation of Metal Nanoparticles (MNPs) as Catalyst, 2022 Search PubMed.
- Y. Chen, et al., Controllable synthesis of core-shell Co@C@SiO2 catalysts for enhancing product selectivity in Fischer–Tropsch synthesis by tuning the mass transfer resistance, J. Energy Chem., 2020, 51, 199–206 CrossRef.
- H. Wang, et al., Core–shell-structured Co–Z@TiO2 catalysts derived from ZIF-67 for efficient production of C5+ hydrocarbons in Fischer–Tropsch synthesis, Ind. Eng. Chem. Res., 2019, 58(19), 7900–7908 CrossRef CAS.
- R. Xie, et al., Core@shell Co3O4@Cm-SiO2 catalysts with inert C modified mesoporous channel for desired middle distillate, Appl. Catal., A, 2015, 492, 93–99 CrossRef CAS.
- B. Zeng, B. Hou, L. Jia, D. Li and Y. Sun, Fischer–Tropsch synthesis over different structured catalysts: the effect of silica coating onto nanoparticles, J. Mol. Catal. A: Chem., 2013, 379, 263–268 CrossRef CAS.
- Q. Cheng, et al., Confined small-sized cobalt catalysts stimulate carbon-chain growth reversely by modifying ASF law of Fischer–Tropsch synthesis, Nat. Commun., 2018, 9(1), 3250 CrossRef PubMed.
- G. Jacobs, T. K. Das, Y. Zhang, J. Li, G. Racoillet and B. H. Davis, Fischer–Tropsch synthesis: support, loading, and promoter effects on the reducibility of cobalt catalysts, Appl. Catal., A, 2002, 233(1–2), 263–281 CrossRef CAS.
- A. T. Najafabadi, A. A. Khodadadi, M. J. Parnian and Y. Mortazavi, Atomic layer deposited Co/γ-Al2O3 catalyst with enhanced cobalt dispersion and Fischer–Tropsch synthesis activity and selectivity, Appl. Catal., A, 2016, 511, 31–46 CrossRef.
- W. M. Brown, P. Wang, S. J. Plimpton and A. N. Tharrington, Implementing molecular dynamics on hybrid high-performance computers-short-range forces, Comput. Phys. Commun., 2011, 182(4), 898–911 CrossRef CAS.
- S. Plimpton, Fast parallel algorithms for short-range molecular dynamics, J. Comput. Phys., 1995, 117(1), 1–19 CrossRef CAS.
- S. J. Plimpton and A. P. Thompson, Computational aspects of many-body potentials, MRS Bull., 2012, 37(5), 513–521 CrossRef CAS.
- W. Mai, et al., Prism-based DGTD with a simplified periodic boundary condition to analyze FSS With D 2n symmetry in a rectangular array under normal incidence, IEEE Antenn. Wireless Propag. Lett., 2019, 18(4), 771–775 Search PubMed.
- S. Nosé, A unified formulation of the constant temperature molecular dynamics methods, J. Chem. Phys., 1984, 81(1), 511–519 CrossRef.
- A. K. Rappé, C. J. Casewit, K. Colwell, W. A. Goddard III and W. M. Skiff, UFF, a full periodic table force field for molecular mechanics and molecular dynamics simulations, J. Am. Chem. Soc., 1992, 114(25), 10024–10035 CrossRef.
- M. S. Green, Markoff random processes and the statistical mechanics of time-dependent phenomena. II. Irreversible processes in fluids, J. Chem. Phys., 1954, 22(3), 398–413 CrossRef CAS.
- R. Kubo, Statistical-mechanical theory of irreversible processes. I. General theory and simple applications to magnetic and conduction problems, J. Phys. Soc. Jpn., 1957, 12(6), 570–586 CrossRef.
- D. Frenkel, B. Smit, and M. A. Ratner, Understanding Molecular Simulation: From Algorithms to Applications, Academic Press, San Diego, 1996 Search PubMed.
- J. E. Jones, On the determination of molecular fields.—I. From the variation of the viscosity of a gas with temperature, Proc. R. Soc. A, 1924, 106(738), 441–462 CAS.
- W. Press, S. Teukolsky, W. Vetterling and B. Flannery, Second-order conservative equations, in Numerical Recipes: The Art of Scientific Computing, 2007 Search PubMed.
- L. Verlet, Computer experiments on classical fluids. I. Thermodynamical properties of Lennard–Jones molecules, Phys. Rev., 1967, 159(1), 98 CrossRef CAS.
- Y. Zhang, et al., Ru/TiO2 catalysts with size-dependent metal/support interaction for tunable reactivity in Fischer–Tropsch synthesis, ACS Catal., 2020, 10(21), 12967–12975 CrossRef CAS.
- G. Jacobs, Y. Ji, B. H. Davis, D. Cronauer, A. J. Kropf and C. L. Marshall, Fischer–Tropsch synthesis: temperature programmed EXAFS/XANES investigation of the influence of support type, cobalt loading, and noble metal promoter addition to the reduction behavior of cobalt oxide particles, Appl. Catal., A, 2007, 333(2), 177–191 CrossRef CAS.
- A. Trovarelli, Catalytic properties of ceria and CeO2-containing materials, Catal. Rev., 1996, 38(4), 439–520 CrossRef CAS.
- M. S. Ghasemzadeh and B. Akhlaghinia, C–P bond construction catalyzed by Ni II immobilized on aminated Fe3O4@TiO2 yolk–shell NPs functionalized by (3-glycidyloxypropyl) trimethoxysilane (Fe3O4@TiO2 YS-GLYMO-UNNi II) in green media, New J. Chem., 2019, 43(14), 5341–5356 RSC.
- H. Sun, H. Y. Yip, Z. Jiang, L. Ye, I. M. Lo and P. K. Wong, Facile synthesis of oxygen defective yolk–shell BiO2−x for visible-light-driven photocatalytic inactivation of Escherichia coli, J. Mater. Chem. A, 2018, 6(12), 4997–5005 RSC.
- M. Pudukudy and Z. Yaakob, Methane decomposition over Ni, Co, and Fe based monometallic catalysts supported on sol-gel derived SiO2 micro flakes, Chem. Eng. J., 2015, 262, 1009–1021 CrossRef CAS.
- S. Kaliaguine, A. Van Neste, V. Szabo, J. Gallot, M. Bassir and R. Muzychuk, Perovskite-type oxides synthesized by reactive grinding: part I. Preparation and characterization, Appl. Catal., A, 2001, 209(1–2), 345–358 CrossRef CAS.
- S. Royer, D. Duprez and S. Kaliaguine, Oxygen mobility in LaCoO3 perovskites, Catal. Today, 2006, 112(1–4), 99–102 CrossRef CAS.
- L. Wang, H. Liu, Y. Chen and S. Yang, Reverse water–gas shift reaction over co-precipitated Co–CeO2 catalysts: effect of Co content on selectivity and carbon formation, Int. J. Hydrogen Energy, 2017, 42(6), 3682–3689 CrossRef CAS.
- L. Wang and H. Liu, Mesoporous Co-CeO2 catalyst prepared by colloidal solution combustion method for reverse water-gas shift reaction, Catal. Today, 2018, 316, 155–161 CrossRef CAS.
- A. Cao, R. Lu and G. Veser, Stabilizing metal nanoparticles for heterogeneous catalysis, Phys. Chem. Chem. Phys., 2010, 12(41), 13499–13510 RSC.
- J. C. Park and H. Song, Metal@silica yolk-shell nanostructures as versatile bifunctional nanocatalysts, Nano Res., 2011, 4(1), 33–49 CrossRef CAS.
- V. Evangelista, B. Acosta, S. Miridonov, E. Smolentseva, S. Fuentes and A. Simakov, Highly active Au-CeO2@ZrO2 yolk–shell nanoreactors for the reduction of 4-nitrophenol to 4-aminophenol, Appl. Catal., B, 2015, 166, 518–528 CrossRef.
- X. Huang, C. Guo, J. Zuo, N. Zheng and G. D. Stucky, An assembly route to inorganic catalytic nanoreactors containing sub-10-nm gold nanoparticles with anti-aggregation properties, Small, 2009, 5(3), 361–365 CrossRef CAS.
- V. Subramanian, et al., Nanoreactors: an efficient tool to control the chain-length distribution in Fischer–Tropsch synthesis, ACS Catal., 2016, 6(3), 1785–1792 CrossRef CAS.
- Y. Yang, et al., A yolk–shell nanoreactor with a basic core and an acidic shell for cascade reactions, Angew. Chem., Int. Ed., 2012, 51(36), 9164–9168 CrossRef CAS.
- W. Zhou, et al., New horizon in C1 chemistry: breaking the selectivity limitation in transformation of syngas and hydrogenation of CO2 into hydrocarbon chemicals and fuels, Chem. Soc. Rev., 2019, 48(12), 3193–3228 RSC.
Footnote |
| † Electronic supplementary information (ESI) available. See DOI: https://doi.org/10.1039/d3ra04884e |
| This journal is © The Royal Society of Chemistry 2023 |

