 Open Access Article
A controllable surface etching strategy for MOF-derived porous ZnCo2O4@ZnO/Co3O4 oxides and their sensing properties†
Wang Li *ab,
Yulin Guoa,
Yan Liua,
Wen Yanga,
Jifan Huab and
Jiangwei Ma*ab
aCollege of Materials Science and Engineering, Taiyuan University of Science and Technology, Taiyuan 030003, China. E-mail: 2019014@tyust.edu.cn; jiangweima@tyust.edu.cn
bLaboratory of Magnetic and Electric Functional Materials and the Applications, The Key Laboratory of Shanxi Province, Taiyuan 030024, China
First published on 22nd August 2023
Abstract
Here, we report a surface etching strategy for the controllable synthesis of metal–organic framework (MOF)-derived ZnCo2O4@ZnO/Co3O4 oxides. Different from previous studies, ZnCo-glycolate (ZnCo-gly) spheres acted as sacrificial templates to provide Zn2+ and Co2+ ions, which coordinated with 2-MeIm to form Zeolitic Imidazolate Frameworks (ZIFs) on the surface of ZnCo-gly. A series of characterizations were employed to clarify the evolution of the surface etching strategy. Interestingly, the ZIF thickness of the ZnCo-gly surface could be controlled by adjusting the reaction time. After calcination, p–n heterojunctions were formed between the MOF-derived ZnO and Co3O4, which made it show excellent selectivity to methanal gas.
1. Introduction
Metal–organic frameworks (MOFs), as a kind of representative porous material, have emerged as an extensive class of crystalline materials with ultrahigh porosity and enormous internal surface area.1 These properties, together with the extraordinary variability of both the organic and inorganic components, make MOFs of interest for potential applications in clean energy,2 gas storage3 and separation, and catalysis.4–6 Zeolitic imidazolate frameworks (ZIFs) are a sub-family of MOFs, consisting of cations (Zn, Co, Ni etc.) and an imidazolate linker, formed by a self-assembly strategy. They simultaneously possess the advantages of both MOFs and zeolites; in particular, their selective gas adsorption behaviour makes ZIFs and ZIF-derived metal oxides very attractive for overcoming the selectivity problem in gas sensors.7–9 For example, Lu and cooperators proposed a facile method to construct concave nanocube porous Co3O4 based on a ZIF-67 template. By controlling the calcination temperature, the as-obtained ZIF-derived Co3O4 showed a high specific surface area and ultrafine grains, thus displaying the highest response to ethanol.10 Yuan's team reported ZnO nanosheets derived from MOFs for ppb-level CO and VOC gas sensing.11 The high performance can be attributed to numerous factors, such as the hierarchical mesoporous structure, high specific surface area, unpaired electrons, and consequent bandgap narrowing. Because both zinc and cobalt can form very similar ZIFs with 2-methylimidazole ligands, some research studies have been conducted on bimetallic ZnCo-MOF-derived oxides.12 For instance, Sun et al. found that Co3O4/ZnO sensors synthesised using a bimetallic MOF sacrificial template have a fast response and rapid recovery for HCHO gas.13 The above studies show that MOF-derived metal oxides have excellent properties in gas sensors, especially Co3O4 and ZnO oxides.As is well-known, cobaltosic oxide (Co3O4) is a typical p-type semiconductor with a band gap (2.2 eV), and spinel structure containing various states of Co3+ and Co2+.14 Different kinds of Co3O4 porous nanostructures, such as nanoflowers, nanorods, and nanospheres, have been obtained by thermal decomposition of Co-based coordination complexes and MOFs.15–17 Cao et al. reported that Co3O4 synthesized from nanoplates had a hierarchical structure, and then derived microspherical composites.18 The resulting multilayer structure Co3O4 sensor presented a great sensitivity to 50 ppm alcohol. Meanwhile, zinc oxide (ZnO) is a representative n-type semiconductor with a wide band gap (3.37 eV), nontoxicity, high electron mobility, and ease of crystallization. These distinctive properties mean that it is considered to be one of the most favorable materials for gas sensing. The gas-sensing properties of synthesized ZnO nanostructures strongly depend on their morphology and crystallinity.19 There is some literature reporting that p–n heterojunctions composed of ZnO and other p-type semiconductors (such as Co3O4, NiO) exhibit optimized sensing properties.20,21 Zhu and co-workers synthesized flower-like NiO/ZnO heterogeneous nanomaterials by a simple one-pot hydrothermal method. The heterojunction formed between NiO/ZnO endows it with a high gas-sensitive response to ethanol and positive repeatability compared to ZnO.22
Inspired by the above research, both zinc and cobalt can form very similar ZIF structures with 2-methylimidazole ligands, and the ZIF-derived Co3O4 and ZnO can construct a p–n heterojunction to optimize the sensing properties. There is an appropriate candidate template, ZnCo-gly nanospheres, which may achieve the goals above. Herein, we propose an effective surface etching route to fabricate Zn- and Co-based bimetallic MOFs from ZnCo-gly microsphere templates. Different from the conventional approaches, the Zn2+ and Co2+ sources come from the ZnCo-gly precursors and react with 2-methylimidazole (2-MeIm) ligands to form bimetallic ZnCo-ZIFs. After annealing, MOF-derived porous ZnO/Co3O4 nanohybrids were obtained. The whole preparation strategy is described in Scheme 1. The surface etching strategy could well-control the thickness of the surface ZIFs, thus effectively enhancing the MOF-derived ZnCo2O4@ZnO/Co3O4 sensor's performance.
 | ||
| Scheme 1 Schematic illustration of the etching process for the MOF-derived ZnCo2O4@ZnO/Co3O4 spheres. | ||
2. Experimental section
2.1 Materials
The chemicals used in ZnCo-glycolate microsphere synthesis include Co(CH3COO)2·4H2O (99.7%), Zn(CH3COO)2·2H2O (99.7%), and ethylene glycol (EG, 99%) from Tianjin Zhiyuan Chemical Reagent Co., Ltd. N,N-Dimethylformamide (DMF, 99.7%) and 2-methylimidazole (2-MeIm, 99%) were obtained from West Asia Reagent Company.2.2 Synthesis of ZnCo-glycolate microspheres (denoted as ZnCo-gly)
ZnCo-gly nanosphere precursors were synthesized using a refluxing method, which has been reported before.23 Typically, 219.5 mg (1 mmol) of Zn(CH3COO)2·2H2O and 498.2 mg (2 mmol) of Co(CH3COO)2·4H2O were dissolved in 50 mL of EG under stirring for 30 min, then refluxed at 170 °C for 2 h. The purple precipitate was collected and washed with ethanol three times, followed by vacuum-drying at 60 °C overnight.2.3 Synthesis of MOF-derived ZnCo-gly@ZIF microspheres
Firstly, 50 mg of the as obtained ZnCo-gly precursors and 169.4 mg of 2-methylimidazole ligand were dispersed in 30 mL of DMF solvent under ultrasonication. Then, the light purple solution was stirred at 40 °C in a water bath for several hours (1 h to obtain the ZnCo-gly-1 h and 6 h to obtain ZnCo-gly-6 h). The light purple precipitate was collected and washed with ethanol three times, followed by vacuum-drying at 60 °C overnight.2.4 Synthesis of MOF-derived ZnCo2O4@ZnO/Co3O4 microspheres
The as-prepared ZnCo-gly precursors, ZnCo-gly@ZIFs-1 h and ZnCo-gly@ZIFs-6 h were calcined at 400 °C under an air atmosphere for 2 h at a heating rate of 1 °C min−1. After cooling down to room temperature, the black powder was collected and denoted as ZnCo2O4, ZnCo2O4@ZnO/Co3O4-1 h, and ZnCo2O4@ZnO/Co3O4-6 h, respectively.2.5 Measurements of gas sensing performance
The sensing performance was determined on a statically stable gas-sensing testing system (WS-30A, Weisheng, Zhengzhou, China). The preparation process was as follows: firstly, appropriate amounts of the samples and terpineol were fully ground to a paste in an agate mortar. The pastes were evenly drop-coated on the surface of an alumina ceramic tube that was premounted with gold electrodes and platinum conducting wires. The sensors were dried in air overnight, and then calcined in a muffle furnace at 300 °C for 2 h to remove the adhesive. Finally, four Pt electrodes and the heating coil that were inserted into the ceramic tube were welded to the base. Three gas sensors were prepared for each sample to ensure accuracy. The sensors were aged on an aging instrument (TS-60, Weisheng, Zhengzhou, China) for 7 days at 300 °C to improve the stability of the structure and resistance. During the gas sensing measurements, the humidity was 49% RH, and the ZnCo2O4@ZnO/Co3O4-6 h sensor device was tested under different humidities toward 100 ppm methanal to evaluate the stability. In detail, a hygrometer (O-296, Dretec, Japan) was placed in the test chamber, while a certain amount of deionized water was located on the evaporation table. When the estimated deionized water evaporated completely, the hygrometer readings will stabilize at the desired humidity value, and the gas sensitivity test is performed at the moment. The humidity conditions are changed by adjusting the amount of water on the evaporation platform.2.6 Characterization
Scanning electron microscopy (SEM) and energy dispersive spectroscopy (EDS) images were obtained on a JSM-7500F electron microscope. X-ray diffraction (XRD) patterns were recorded on a Shimadzu XRD-6000 with Cu Kα radiation (λ = 1.5418 Å) operating at 40 kV and 30 mA. Thermo-gravimetric differential scanning calorimetry (TG-DSC) analysis was carried out under an air atmosphere with a METTLER TGA/DSC 1 SF/1382 within a temperature range from room temperature to 800 °C with a heating rate of 10 °C min−1. The BET (Brunauer–Emmett–Teller) surface area and pore size of the catalysts were determined on a QuadraSorb SI instrument. Transmission electron microscopy (TEM) and high-resolution transmission electron microscopy (HRTEM) images were taken on JEM-F200 microscopes at 200 kV. X-ray photoelectron spectroscopy (XPS) was performed using a Shimadzu Axis Supra (600 W) using 200 W monochromated Al Kα radiation. A 500 μm X-ray spot was used for XPS analysis. The base pressure in the analysis chamber was about 3 × 10⁻¹⁰ mbar. Typically, the hydrocarbon C 1s line at 284.8 eV from adventitious carbon is used for energy referencing.3. Results and discussion
3.1 Physicochemical characteristics
Time-evolution images of the ZnCo-gly@ZIFs are shown in Fig. 1. In detail, a certain amount of Zn2+ and Co2+ (the mole ratio of Zn2+/Co2+ = 1![[thin space (1/6-em)]](https://www.rsc.org/images/entities/char_2009.gif) :
:![[thin space (1/6-em)]](https://www.rsc.org/images/entities/char_2009.gif) 2) was dispersed in glycol solvent and refluxed at 170 °C to prepare the ZnCo-gly precursors. The as-obtained ZnCo-gly precursors present a uniform micro-sphere morphology with a smooth surface, as shown in Fig. 1A. With an appropriate amount of precursor and 2-MeIm ligand dispersed in DMF solvent, the surface of the precursors changed from smooth to rough (Fig. 1B). As the reaction time goes by, the surface etching thickness increases gradually as illustrated in Fig. 1A–C. Mapping analysis of ZnCo-gly@ZIF-6 h (Fig. 1D) demonstrates that Zn, Co, and N were evenly dispersed. It should be noticed that the ZnCo-gly is composed of Zn, Co, O, and C atoms, while the N element comes from 2-MeIm, proving that the surface etching step occurred successfully. X-ray diffraction (XRD) analysis is further used to clarify the composition of the samples. As we all know, ZnCo-gly is a kind of organic material with no significant peaks as shown by the black line in Fig. 1E. With the etching stage occurring, the characteristic peaks of the ZnCo-ZIFs before 20° gradually appeared and enhanced with prolonged reaction time, further confirming the results of SEM and EDS analysis.
2) was dispersed in glycol solvent and refluxed at 170 °C to prepare the ZnCo-gly precursors. The as-obtained ZnCo-gly precursors present a uniform micro-sphere morphology with a smooth surface, as shown in Fig. 1A. With an appropriate amount of precursor and 2-MeIm ligand dispersed in DMF solvent, the surface of the precursors changed from smooth to rough (Fig. 1B). As the reaction time goes by, the surface etching thickness increases gradually as illustrated in Fig. 1A–C. Mapping analysis of ZnCo-gly@ZIF-6 h (Fig. 1D) demonstrates that Zn, Co, and N were evenly dispersed. It should be noticed that the ZnCo-gly is composed of Zn, Co, O, and C atoms, while the N element comes from 2-MeIm, proving that the surface etching step occurred successfully. X-ray diffraction (XRD) analysis is further used to clarify the composition of the samples. As we all know, ZnCo-gly is a kind of organic material with no significant peaks as shown by the black line in Fig. 1E. With the etching stage occurring, the characteristic peaks of the ZnCo-ZIFs before 20° gradually appeared and enhanced with prolonged reaction time, further confirming the results of SEM and EDS analysis.
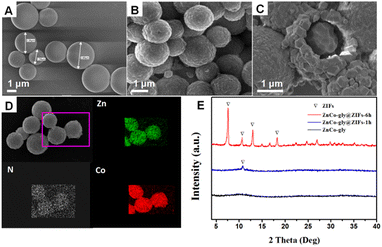 | ||
| Fig. 1 SEM images of (A) ZnCo-gly, (B) ZnCo-gly@ZIF-1 h and (C) ZnCo-gly@ZIF-6 h. (D) Mapping analysis images of ZnCo-gly@ZIF-6 h. (E) XRD pattern of ZnCo-gly, ZnCo-gly@ZIF-1 h, and ZnCo-gly@ZIF-6 h. | ||
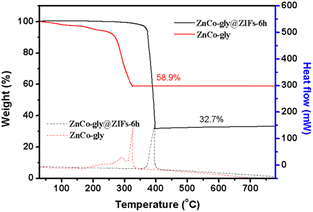
The calcination temperature has a significant influence on the porous structure and morphology of the MOF-derived metal oxide, further affecting its sensing performance. Therefore, thermo-gravimetric differential scanning calorimetry (TG-DSC) analysis (Fig. 2) of ZnCo-gly and ZnCo-gly@ZIFs-6 h was performed with a heating rate of 10 °C min−1 under an air atmosphere. This will helps us to determine the appropriate calcination temperature. For the ZnCo-gly precursor (red line in Fig. 2), there is a slight mass-loss of about 9% under 250 °C, corresponding to the removal of adsorbed H2O. Another significant mass loss of 58.9% can be observed between 250 °C and 330 °C, indicating that ZnCo-gly begins to decompose, with future increases beyond 330 °C meaning that organics are removed completely. After the etching step, the TG curve reveals that the pyrolysis temperature of ZnCo-gly@ZIFs-6 h (black line in Fig. 2) is higher than that of the pure ZnCo-gly precursor. Specifically, ZnCo-gly@ZIFs-6 h exhibits approximately 3% weight loss below 360 °C, which is attributed to the adsorbed H2O on ZnCo-gly@ZIFs-6 h. No weight loss was observed after 400 °C, but a sharp drop in weight was observed between 350 and 400 °C, indicating that the ZnCo-gly@ZIFs-6 h could be completely converted to metal oxides before 400 °C. Distinct exothermic peaks at 327 and 397 °C were observed in the differential scanning calorimetry (DSC) curves as shown by the dotted lines in Fig. 2.
According to the above analysis, all of the samples were heat-treated at 400 °C before gas sensor testing. The XRD patterns indicate that ZnCo-gly was decomposed into a ZnCo2O4 spinel structure after calcination as presented in Fig. 3A. The characteristic peaks of ZnCo2O4 were located at 2θ = 18.96°, 31.21°, 36.80°, 59.28°, and 65.15°, corresponding to the (111), (220), (311), (511), and (440) planes, respectively (PDF # 23-1390). Due to the XRD patterns of the ZnCo2O4, ZnCo2O4@ZnO/Co3O4-1 h and ZnCo2O4@ZnO/Co3O4-6 h samples being very similar, we magnified Fig. 3A from 33–39°, and presented the results in Fig. 3B. Through careful observation, two small peaks can be found, which are barely shown in ZnCo2O4, as marked with yellow squares in Fig. 3B. These two characteristic peaks at 34.43° and 36.84° correspond to the ZnO (002) and Co3O4 (311) planes, indicating that the surface ZnCo-ZIFs were decomposed to ZnO and Co3O4 nanoparticles and the inner unetched ZnCo-gly was pyrolysed into the ZnCo2O4 spinel structure.24 The characteristic peaks of ZnO are located at 2θ = 31.77°, 34.43°, 36.26°, 56.61° and 62.87°, corresponding to the (100), (002), (101), (110), and (103) planes, respectively (PDF # 36-1451). And the diffraction peaks of Co3O4 are observed at 2θ = 18.99°, 31.27°, 36.84°, 59.35° and 65.23°, assigned to the (111), (220), (311), (511), (440) planes, respectively (PDF # 43-1003). The absence of the ZIF's characteristic peaks illustrates the successful derivation of the ZnCo-gly@ZIF precursors into a ZnCo2O4@ZnO/Co3O4 composite.
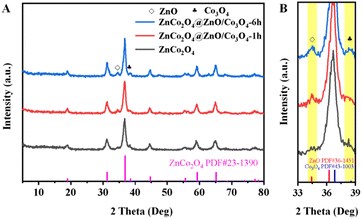 | ||
| Fig. 3 XRD diffractograms of the ZnCo2O4, ZnCo2O4@ZnO/Co3O4-1 h, and ZnCo2O4@ZnO/Co3O4-6 h samples: full range (A), magnified short range (B). | ||
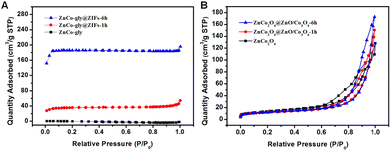
The etching step not only influences the morphology and structure, but also has the consequent benefit of increasing the specific surface area and pore volume. The N2 adsorption–desorption isotherm curves are shown in Fig. 4, while the specific surface area, pore volume, and pore diameter are listed in Table 1. Moreover, all of the samples present a representative type IV isotherm with an H3-type hysteresis loop. We can obverse that ZnCo-gly@ZIFs-6 h has a much larger specific surface area compared to ZnCo-gly@ZIFs-1 h and ZnCo-gly, benefiting from the ZIF shell structure. The pore size and pore volume of ZnCo-gly, ZnCo-gly@ZIFs-1 h, and ZnCo-gly@ZIFs-6 h are increased as listed in Table 1. After calcination at 400 °C, all of the precursors decompose into metal oxide nanoparticles, and ZnCo2O4 unexpectedly shows a slightly larger BET specific surface area. It is possible that the slow heating rate of 1 °C min−1 results in a core@shell structure of ZnCo2O4 (Fig. S1†), which may be one reason for the larger BET specific surface area. In addition, we also calculated the particle size distribution of the metal oxide nanoparticles composed of ZnCo2O4 and ZnCo2O4@ZnO/Co3O4-6 h, from which we can see that the particle size of ZnCo2O4 (10.94 nm) is slightly smaller than that of ZnCo2O4@ZnO/Co3O4-6 h (11.4 nm), which may be another reason for the larger specific surface area of ZnCo2O4. However, there is no evidence to suggest that the sensing performance must only depend on the largest surface area, and it is possibly affected by both the pore size and pore volume. Furthermore, the effects of large mesopores have been frequently reported previously for diverse applications, including catalysis, gas storage or separation, and electrochemical energy conversion.25–28 During calcination, the organic ligands of ZnCo-gly@ZIFs will decompose and escape resulting in a bigger pore size and pore volume, which may be a possible factor improving the sensing properties.29,30 For example, Han et al. reported that the porosity and particle size played key roles in determining the gas response.30 In addition, Zhong and co-workers also reported that the pore structure affected the sensing properties.29 More recently, a publication further highlighted the important impact of pore size.1 According to the above analysis, ZnCo2O4@ZnO/Co3O4-6 h shows the largest pore size and pore volume, which will improve mass transfer and enhance the sensing properties.
| BET surface area (m2 g−1) | Pore size (nm) | Pore volume (cm3 g−1) | ||||
|---|---|---|---|---|---|---|
| Before calcination | After calcination | Before calcination | After calcination | Before calcination | After calcination | |
| ZnCo-gly | 0.3397 | 44.88 | 0 | 9.96 | 0.0025 | 0.169 |
| ZnCo-gly@ZIFs-1 h | 136 | 41.27 | 1.55 | 17.05 | 0.021 | 0.170 |
| ZnCo-gly@ZIFs-6 h | 737 | 41.37 | 2.07 | 18.70 | 0.0019 | 0.193 |
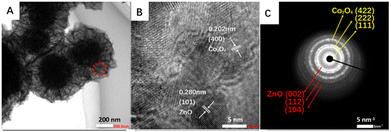
The transmission electron microscopy (TEM) image shows the morphological features of ZnCo2O4@ZnO/Co3O4-6 h (Fig. 5A). It can be seen that the as obtained ZnCo2O4@ZnO/Co3O4-6 h retains its microspherical morphology, and the folded flower-like structure on the surface is derived from ZnCo-ZIFs. Compared to the unetched inner metal oxide, the surface metal oxide nanoparticles derived from ZnCo-ZIF were looser, and such a loose porous structure may provide more activity reaction space for gas sensing. The high-resolution (HRTEM) image (Fig. 5B) illustrates that the porous spheres were composed of ZnO and Co3O4 nanoparticles, and the lattice fringes of 0.280 nm and 0.202 nm correspond well to the (101) plane of ZnO and (400) plane of Co3O4, respectively. Meanwhile, the selected area electron diffraction (SAED) pattern in Fig. 5C exhibits the typical polycrystalline concentric diffraction rings, which can be well ascribed to the (422), (222) and (111) facets of spinel Co3O4, and (002), (112) and (104) facets of ZnO, and these results matched well with the XRD pattern shown in Fig. 3. Hereto, it could be confirmed that the surface ZIF structure is decomposed into a mixture of ZnO and Co3O4.
X-ray photoelectron spectroscopy (XPS) measurement was employed to investigate the oxidation states and chemical composition of the synthesized ZnCo2O4@ZnO/Co3O4-6 h. The full-survey-scan spectrum reveals the presence of C, Co, Zn, and O elements in Fig. 6A. There are no peaks of other elements observed, demonstrating the purity of the obtained nanocomposite. Two strong peaks centred at 1020.54 eV and 1043.66 eV were assigned to Zn 2p3/2 and 2p1/2, respectively (Fig. 6B). The peaks observed at 780.63 eV and 796.03 eV should be ascribed to the Co2+, while those at 779.13 and 794.53 eV belong to Co3+ (Fig. 6C). Besides, two weak vibrating satellite peaks located at 788.1 and 804.7 eV were observed. The peaks of the O atom come from ZnO and Co3O4, which could be deconvoluted into four peaks indicating three types of oxygen species as shown in Fig. 6D. The oxygen vacancies (Ov) and chemisorbed oxygen (Oad) were located at 531.13 eV and 532.41 eV, respectively. And the peaks at 529.27 eV and 527.49 eV belong to lattice oxygen (OL). The OV, Oad, and OL account for 25.7%, 16.9%, and 57.4%, respectively (Table 1). Noticeably, the original lattice oxygen is stable and has no contribution to the gas sensing performance,12 and the higher content of Ov and Oad in ZnCo2O4@ZnO/Co3O4-6 h (Table 2) may be an important contributor to the gas sensing performance.31
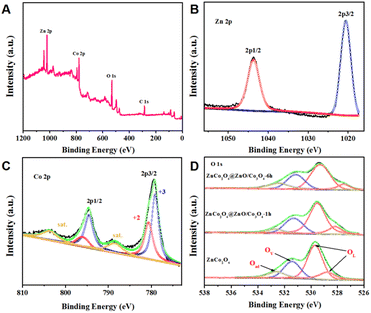 | ||
| Fig. 6 XPS analysis of ZnCo2O4@ZnO/Co3O4-6 h: (A) survey spectrum, (B–D) Zn 2p, Co 2p and O 1s core level spectra. | ||
| OL | OV | Oad | ||||
|---|---|---|---|---|---|---|
| Binding energy (eV) | Relative percentage (%) | Binding energy (eV) | Relative percentage (%) | Binding energy (eV) | Relative percentage (%) | |
| ZnCo2O4 | 529.67 and 528.74 | 62.7 | 531.40 | 24.1 | 532.57 | 13.2 |
| ZnCo2O4@ZnO/Co3O4-1 h | 529.50 and 528.15 | 62.3 | 531.29 | 25.2 | 532.61 | 12.5 |
| ZnCo2O4@ZnO/Co3O4-6 h | 529.27 and 527.49 | 57.4 | 531.13 | 25.7 | 532.41 | 16.9 |
3.2 Gas sensing properties
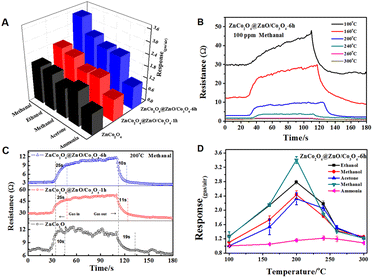
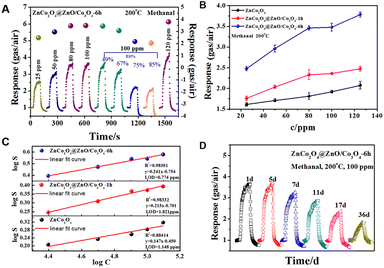
Based on the above analysis, the surface etching strategy is indeed an advisable method for fabricating MOF-derived bimetallic oxides. Predictably, such large pore size and pore volume, and high content of oxygen vacancies and adsorbed oxygen will probably enhance their structure-related properties, such as gas sensing. In order to evaluate the selectivity of the MOF-derived ZnCo2O4@ZnO/Co3O4 sensors, five common application gases, including methanol, ethanol, methanal, ammonia, and acetone, were chosen as target atmospheres. Firstly, orthogonal tests at different temperatures from 100 °C to 300 °C were conducted to select the optimal working temperature. Fig. S3–S5† present the dynamic curves and response values of ZnCo2O4, ZnCo2O4@ZnO/Co3O4-1 h, and ZnCo2O4@ZnO/Co3O4-6 h toward 100 ppm ethanol, methanal, acetone, methanol, and ammonia at different working temperatures. The chemical activation is faint at a low operating temperature, leading to a weak response. Meanwhile, the adsorbed molecules may escape from the sensor's surface when the temperature is too high. It can be obviously concluded from Fig. S2–S4† that the optimal working temperature is 200 °C. Selectivity is an important indicator for sensors, and it can be observed from the bar chart (Fig. 7A) that all of the sensors exhibit a highly selective response toward 100 ppm methanal, and ZnCo2O4@ZnO/Co3O4-6 h presents a superior selective response toward all gases at 200 °C, especially to methanal. The highest response value of ZnCo2O4@ZnO/Co3O4-6 h (3.47) indicated that the retained ZIF structure and bigger pore size were in favour of the sensing performance. Fig. 7B shows the dynamic curves of the best sensor ZnCo2O4@ZnO/Co3O4-6 h at different temperatures. The response/recovery times of the sensors upon expose to 100 ppm methanal gas were calculated in Fig. 7C, and compared to ZnCo2O4@ZnO/Co3O4-1 h and ZnCo2O4 sensors, ZnCo2O4@ZnO/Co3O4-6 h exhibits a slow response time (25 s) and the fastest recovery time (10 s). All of the ZnCo2O4@ZnO/Co3O4-6 h sensors present a “volcano” shape (Fig. 7D) with increasing working temperature and show the highest response value at 200 °C toward the five different gases.As described above, all of these sensors present good selectivity to methanal; therefore, more sensing measurements were conducted toward methanal at 200 °C. Furthermore, the ZnCo2O4@ZnO/Co3O4-6 h sensor device was tested under different concentrations and humidities, and presented a sharp rise and fall tendency with methanal present and absent, as shown in Fig. 8A. The humidity and stability of sensors are critical considerations for practical applications. Obviously, ZnCo2O4@ZnO/Co3O4-6 h displays better repeatability under a low humidity environment (below 67% relative humidity) toward 100 ppm methanal at 200 °C as illustrated in Fig. 8A. Fig. 8B indicates that the response values rose with an increase in the methanal concentration (from 25 ppm to 120 ppm), and ZnCo2O4@ZnO/Co3O4-6 h shows higher responsiveness to all of the methanal concentrations. The fitting equations between the response and gas concentration can be expressed as y = 0.261x − 0.754, y = 0.215x − 0.701, and y = 0.147x − 0.450, corresponding to the ZnCo2O4@ZnO/Co3O4-6 h, ZnCo2O4@ZnO/Co3O4-1 h, and ZnCo2O4 sensors as shown in Fig. 8C, respectively. The correlation coefficient for the ZnCo2O4@ZnO/Co3O4-6 h sensor is 0.98301, indicating a good linear fitting. From the fitting equation, we can also calculate the limit of detection (LOD) of the ZnCo2O4@ZnO/Co3O4-6 h sensor as 0.774 ppm, which is much lower than that of the ZnCo2O4@ZnO/Co3O4-1 h and ZnCo2O4 sensors. The repeatability and stability tests for the ZnCo2O4@ZnO/Co3O4-6 h sensor were conducted at 1, 5, 7, 11, and 36 days toward 100 ppm methanal at 200 °C as illustrated in Fig. 8D, and the ZnCo2O4@ZnO/Co3O4-6 h sensor maintained relative repeatability within one week, proving the good stability of the sensor materials.
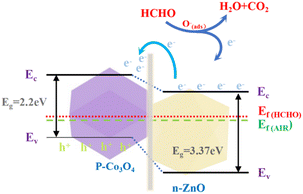
The possible gas-sensing behaviour of the MOF-derived metal oxide ZnCo2O4@ZnO/Co3O4-6 h relates to the redox reaction between the target gases and oxygen species on the sensor surface. First of all, oxygen ions are adsorbed on the surface and capture electrons at the working temperature of 200 °C. Upon exposure to a methanal atmosphere, the methanal molecules react with the adsorbed oxygen and release electrons. The possible reaction mechanism is as follows:
| O2(gas) → O2(ads) | (1) |
| O2(ads) + e− → O2(ads)− | (2) |
| O2(ads)− + e− → 2O(ads)− | (3) |
| HCHO(ads) + 2O(ads)− → CO2 + H2O + e− | (4) |
As we know, the Fermi level (Ef) of ZnO is higher than that of Co3O4, so electrons will transfer from n-type ZnO to p-type Co3O4 while holes will transfer in the opposite direction until the Fermi level is balanced, leading to p–n heterojunctions being formed at the interface as shown in Fig. 8.24 The enhancement of the ZnCo2O4@ZnO/Co3O4-6 h sensing properties can be explained by three reasons: (i) higher oxygen vacancy and adsorb oxygen content, (ii) increased pore size and pore volume, and (iii) the formation of p–n heterojunctions between the surface ZnO and Co3O4 (Fig. 9).
4. Conclusions
In summary, we have proposed a controllable surface etching strategy to in situ fabricate ZIFs on ZnCo-gly templates, and the ZIF thickness is controllable by tuning the reaction time. After heat treatment, MOF-derived porous ZnCo2O4@ZnO/Co3O4 oxides were obtained. The gas sensitive selectivity and response value of the as-synthesized sensor devices follows the sequence ZnCo2O4 < ZnCo2O4@ZnO/Co3O4-1 h < ZnCo2O4@ZnO/Co3O4-6 h. The ZnCo2O4@ZnO/Co3O4-6 h sensor exhibits the highest response, excellent selectivity and good repeatability to 100 ppm methanal at 200 °C. The enhancement of the sensing properties can be attributed to the special pore structure, the high content of adsorbed and vacancy oxygen, and the formation of p–n heterojunctions between ZnO and Co3O4.Although the gas sensor performance of the MOF-derived ZnCo2O4@ZnO/Co3O4 obtained by this surface etching strategy has been effectively improved, it is not a sharp increase. What we'd like to emphasize is that such a functional surface etching synthesis method can not only obtain MOF-derived bimetallic ZnO/Co3O4 oxide spheres under air conditions by calcination, but the surface ZIF structure can convert into different N-doping carbon layers by calcination under an inert atmosphere. This makes it have a variety of functions, and it is expected to be more widely used in batteries, catalysis, adsorption separation, and other fields.
Author contributions
Wang Li: conceptualization, resources, writing-original draft, funding acquisition; Yulin Guo: investigation, formal analysis. Yan Liu: investigation. Wen Yang, Jifan Hu and Jiangwei Ma: writing-review & editing and funding acquisition.Conflicts of interest
There are no conflicts to declare.Acknowledgements
This work was supported by the Fundamental Research Program of Shanxi Province (No. 202103021223279), Scientific and Technological Innovation Programs of Higher Education Institutions in Shanxi (No. 2020L0336), funding for outstanding doctoral research in Jin (No. 20202003), Taiyuan University of Science and Technology Doctoral Research Startup Fund (No. 20192025), the special fund for Science and Technology Innovation Teams of Shanxi Province (No. 202204051001002), and the National Nature Science Foundation (62201376).Notes and references
- C.-Z. Wang, J. Chen, Q.-H. Li, G.-E. Wang, X.-L. Ye, J. Lv and G. Xu, Angew. Chem., Int. Ed., 2023, 62, e202302996 CrossRef CAS PubMed.
- D. Liu, X. Zhang, Y. J. Wang, S. Song and B. Fang, Nanoscale, 2020, 12, 9524–9532 RSC.
- T. Kundu, M. Wahiduzzaman, B. B. Shah, G. Maurin and D. Zhao, Angew. Chem., 2019, 131, 8157–8186 CrossRef.
- C. Sharp, B. Bukowski, H. Li, E. Johnson, S. Ilic, A. Morris, D. Gersappe, R. Snurr and J. Morris, Chem. Soc. Rev., 2021, 50, 11530–11558 RSC.
- Y. Han, C. Liu, W. Yue and A. Huang, Mater. Lett., 2022, 318, 132158 CrossRef CAS.
- T. Wang, L. Gao, J. Hou, S. J. A. Herou, J. T. Griffiths, W. Li, J. Dong, S. Gao, M. M. Titirici and R. V. Kumar, Nat. Commun., 2019, 10, 1340 CrossRef PubMed.
- X. Zhang, Y. Xu, H. Liu, W. Zhao, A. Ming and F. Wei, RSC Adv., 2020, 10, 2191–2197 RSC.
- W. Chen, S. Wang and M. Yang, Mater. Lett., 2023, 331, 133408 CrossRef CAS.
- M. S. Yao, W. X. Tang, G. E. Wang, B. Nath and G. Xu, Adv. Mater., 2016, 28, 5229–5234 CrossRef CAS PubMed.
- Y. Lü, W. Zhan, Y. He, Y. Wang, X. Kong, Q. Kuang, Z. Xie and L. Zheng, ACS Appl. Mater. Interfaces, 2014, 6, 4186–4195 CrossRef PubMed.
- H. Yuan, S. Aljneibi, J. Yuan, Y. Wang, H. Liu, J. Fang, C. Tang, X. Yan, H. Cai, Y. Gu, S. J. Pennycook, J. Tao and D. Zhao, Adv. Mater., 2019, 31, e1807161 CrossRef PubMed.
- W. Yan, H. Xu, M. Ling, S. Zhou, T. Qiu, Y. Deng, Z. Zhao and E. Zhang, ACS Sens., 2021, 6, 2613–2621 CrossRef CAS PubMed.
- J. Sun, L. Sun, S. Bai, H. Fu, J. Guo, Y. Feng, R. Luo, D. Li and A. Chen, Sens. Actuators, B, 2019, 285, 291–301 CrossRef CAS.
- P. G. Choi, T. Fuchigami, K. I. Kakimoto and Y. Masuda, ACS Sens., 2020, 5, 1665–1673 CrossRef CAS PubMed.
- W. Li, D. Liu, X. Feng, Z. Zhang, X. Jin and Y. Zhang, Adv. Energy Mater., 2019, 9, 1803583 CrossRef.
- F. Meng, Z. Fang, Z. Li, W. Xu and X. Guo, J. Mater. Chem. A, 2013, 1, 7235–7241 RSC.
- N. Yan, L. Hu, Y. Li, Y. Wang, H. Zhong, X. Hu, X. Kong and Q. Chen, J. Phys. Chem. C, 2012, 116, 7227–7235 CrossRef CAS.
- A. M. Cao, J. S. Hu, H. P. Liang, W. G. Song and S. H. Xia, J. Phys. Chem. B, 2006, 110, 15858–15863 CrossRef CAS PubMed.
- Y. Seekaew, A. Wisitsoraat and C. Wongchoosuk, Diamond Relat. Mater., 2023, 132, 109630 CrossRef CAS.
- C. Qin, B. Wang, N. Wu, C. Han and Y. Wang, ACS Appl. Mater. Interfaces, 2021, 13, 26318–26329 CrossRef CAS PubMed.
- Y. Seekaew, S. Kamlue and C. Wongchoosuk, ACS Appl. Nano Mater., 2023, 6, 9008–9020 CrossRef CAS.
- L. Zhu, W. Zeng, J. Yang and Y. Li, Ceram. Int., 2018, 44, 19825–19830 CrossRef CAS.
- F. Wang, X. Wang, D. Liu, J. Zhen, J. Li, Y. Wang and H. Zhang, ACS Appl. Mater. Interfaces, 2014, 6, 22216–22223 CrossRef CAS PubMed.
- D. Zhang, Z. Yang, Z. Wu and G. Dong, Sens. Actuators, B, 2019, 283, 42–51 CrossRef CAS.
- F. Baizeng, F. V. Heuveln and F. B. Dias, Rare Met., 2000, 19, 1–10 Search PubMed.
- B. Fang, Y. Z. Wei, K. Suzuki and M. Kumagai, Electrochim. Acta, 2005, 50, 3616–3621 CrossRef CAS.
- B. Fang, H. Zhou and I. Honma, J. Chem. Phys., 2006, 124, 204718 CrossRef.
- B. Fang, L. Daniel, A. Bonakdarpour, R. Govindarajan, J. Sharman and D. P. Wilkinson, Small, 2021, 17, 2102288 CrossRef CAS PubMed.
- X. Zhong, Y. Shen, S. Zhao, T. Li and K. Wei, Vacuum, 2019, 167, 118–128 CrossRef CAS.
- M. A. Han, H. J. Kim, H. C. Lee, J. S. Park and H. N. Lee, Appl. Surf. Sci., 2019, 481, 133–137 CrossRef CAS.
- L.-l. Qi, C.-y. Zhong, Z.-h. Deng, T.-t. Dai, J.-q. Chang, S.-m. Wang, X.-d. Fang and G. Meng, Chin. J. Chem. Phys., 2020, 33, 477–484 CrossRef CAS.
Footnote |
| † Electronic supplementary information (ESI) available. See DOI: https://doi.org/10.1039/d3ra05135h |
| This journal is © The Royal Society of Chemistry 2023 |

