 Open Access Article
An S-scheme heterojunction between Mn/Mg co-doped BiFeO3 and g-C3N4 nanosheets for photodegradation of organic pollutants
Wei-Cheng Chena and
Xiaoding Qi *ab
*ab
aDepartment of Materials Science and Engineering, National Cheng Kung University, Tainan City 70101, Taiwan. E-mail: xqi045@ncku.edu.tw
bCenter for Micro/Nano Science and Technology, National Cheng Kung University, Tainan City 70101, Taiwan
First published on 19th September 2023
Abstract
BiFe1−2xMnxMgxO3 (BFMM, x = 0−8%) was mixed with exfoliated g-C3N4 (GCN) to form a composite for establishing an S-scheme heterojunction for photodegradation. BFMM was synthesized by sol–gel method, and showed a decreased band gap from 2.24 eV to 1.75 eV as x increased from 0% to 7%, allowing a more efficient absorption of sunlight. GCN was prepared by thermal polymerization of melamine and then exfoliated to form nanosheets by sulfur acid in order to increase the specific surface area and thus increase reaction sites. A composite with a weight ratio of BFMM/GCN equal to 1![[thin space (1/6-em)]](https://www.rsc.org/images/entities/char_2009.gif) :
:![[thin space (1/6-em)]](https://www.rsc.org/images/entities/char_2009.gif) 3 was prepared by sintering the powder mixture at 300 °C. Such a composite showed a greatly improved efficiency in photodegradation of methylene blue, which was over 6 times faster than pristine BiFeO3, and the Mn/Mg co-doping improved the efficiency by 48%. The Mott–Schottky plots showed that both GCN and BFMM are n-type semiconductors with flat-band potentials of −0.79 and +0.11 V (vs. NHE), respectively. So, the band alignment allowed the S-scheme to work, leading to an efficient separation of photogenerated electrons and holes, which was confirmed by the greatly increased photocurrents measured with the composites.
3 was prepared by sintering the powder mixture at 300 °C. Such a composite showed a greatly improved efficiency in photodegradation of methylene blue, which was over 6 times faster than pristine BiFeO3, and the Mn/Mg co-doping improved the efficiency by 48%. The Mott–Schottky plots showed that both GCN and BFMM are n-type semiconductors with flat-band potentials of −0.79 and +0.11 V (vs. NHE), respectively. So, the band alignment allowed the S-scheme to work, leading to an efficient separation of photogenerated electrons and holes, which was confirmed by the greatly increased photocurrents measured with the composites.
1. Introduction
As an environment-friendly technique, semiconductor photodegradation has been widely used to decompose organic contaminants. Many transition-metal (TM) oxides, such as TiO2, ZnO, CdS, WO3, etc., have been investigated for such a purpose. However, there are some intrinsic limitations for these simple TM oxides, in particular the large band gap, low carrier density, and high recombination rate.1,2 So, complex oxides have been studied in recent years, among which are those containing heavy p-block metals, such as bismuth (Bi), because of the good photo-oxidation performance and efficiency for absorption of sunlight.3,4 The valence band (VB) of such complex oxides is composed of hybridized O 2p and Bi 6s orbitals. The weak bonding between the heavy-metal and oxygen atoms favours the construction of a dispersive band structure, which elevates the VB maximum, leading to a small bandgap of bismuth-containing oxides (typically less than 3.0 eV).3,4 BiFeO3 (BF) with a band gap around 2.2 eV is one of such Bi-containing complex oxides, which has been studied extensively for photodegradation during recent years.3,5–12 However, despite the advantages mentioned, more studies are needed for BF to become a highly efficient photocatalyst. Firstly, as with most oxide semiconductors, the recombination process is rapid in BF, which means that only a small number of photo-generated charges can be retained for redox reactions. Secondly, although BF has a relatively small band gap compared to many other perovskite-structured oxides, it only absorbs a part of the sunlight spectrum (<560 nm), so a further reduction in its band gap is needed for enhancing the photodegradation efficiency.In this work, BF was co-doped with Mn and Mg, i.e. BiFe1−2xMnxMgxO3 (BFMM, x = 0–8%), in order to reduce the band gap. Such a co-doping effect on band gap was reported recently.13 BFMM was then mixed with g-C3N4 (GCN, band gap ≈ 2.8 eV) to form a composite, in which an S-scheme heterojunction was expected to establish at the BFMM/GCN interface for lowering the recombination rate. The S-scheme usually consists of a reduction photocatalyst (RP) and an oxidation photocatalyst (OP) with a staggered band structure,14 where the photo-generated electrons and holes are kept in the conduction band (CB) of RP and the VB of OP, respectively, because the opposite charges in both sides of the junction (i.e., holes in the VB of RP and electrons in the CB of OP) have been evacuated by the cross-recombination at the RP/OP junction.14 In this work, BFMM acted as OP, while GCN took the role of RP. The BFMM/GCN composites showed a greatly improved photodegradation efficiency, which was well explained based on such an S-scheme heterojunction.
2. Experimental
BFMM with the Mn and Mg doping level x = 0–8% was synthesized by sol–gel method. The precursors included the powders of Bi(NO3)3·5H2O (≥98.0%, Alfa Aesar), Fe(NO3)3·9H2O (≥99.0%, Showa Chemical), Mg(NO3)2·6H2O (≥98.0%, Alfa Aesar), and Mn (≥99.5%, 325 mesh, Strem Chemicals). The powders were weighed according to the stoichiometric ratios of the metallic elements in BFMM and then dissolved in the acetic acid (≥99.7%) and ethylene glycol (≥99.9%) solution, which was blended with the volume ratio of 3![[thin space (1/6-em)]](https://www.rsc.org/images/entities/char_2009.gif) :
:![[thin space (1/6-em)]](https://www.rsc.org/images/entities/char_2009.gif) 1. The solution, which had the molar concentration of 0.25 M, was heated to 130 °C on a hotplate and stirred at 300 rpm. The solution thickened gradually and after about 4 h, an aerogel was formed. The aerogel was then ground into powders and heated at 300 °C for 10 min to burn off the organic ligands. Afterwards, the powders were calcined at 550 °C for 0.5 h to form the desired phase. GCN was prepared by thermal polymerization of melamine (≥99.0%), Alfa Aesar), which took place at 550 °C for 4 h under argon atmosphere. The obtained GCN was then exfoliated into nanosheets by the following process. 1.0 g of the ground powders of GCN was added into 20 ml sulfuric acid (≥97%) and heated at 90 °C with vigorous stirring. After about 5–6 h, a clear yellow solution was formed, which was allowed to cool to room temperature and then poured into ethanol (≥99.5%). White precipitates of the exfoliated GCN occurred, which were collected by centrifugation and filtration. The nanosheets were washed by ethanol and deionized water until pH around 7.
1. The solution, which had the molar concentration of 0.25 M, was heated to 130 °C on a hotplate and stirred at 300 rpm. The solution thickened gradually and after about 4 h, an aerogel was formed. The aerogel was then ground into powders and heated at 300 °C for 10 min to burn off the organic ligands. Afterwards, the powders were calcined at 550 °C for 0.5 h to form the desired phase. GCN was prepared by thermal polymerization of melamine (≥99.0%), Alfa Aesar), which took place at 550 °C for 4 h under argon atmosphere. The obtained GCN was then exfoliated into nanosheets by the following process. 1.0 g of the ground powders of GCN was added into 20 ml sulfuric acid (≥97%) and heated at 90 °C with vigorous stirring. After about 5–6 h, a clear yellow solution was formed, which was allowed to cool to room temperature and then poured into ethanol (≥99.5%). White precipitates of the exfoliated GCN occurred, which were collected by centrifugation and filtration. The nanosheets were washed by ethanol and deionized water until pH around 7.
To form the composite, fine powders of both BFMM and GCN were suspended in ethanol and well mixed by ultrasonic vibration for 1 h. The powder mixture was dried and then calcined at 300 °C for 1 h. The phase and microstructure of the synthesized samples were characterized by X-ray diffraction (XRD, Rigaku MiniFlex II) and transmission electron microscopy (TEM, Jeol JEM-2100F). The band gap was measured by the ultraviolet-visible diffuse reflectance spectroscopy (Hitachi U-4100), in which the reflectance spectrum was converted to the Kubelka–Munk function, F(R∞), and the band gap was obtained by the Tauc plot. Photoelectrochemical property and impedance analysis were carried out by a commercial electrochemical workstation (CH Instruments, CHI6273E) with a standard three-electrode system. Pt wire and Ag/AgCl were used as the counter and reference electrodes, respectively. An aqueous solution of Na2SO4 (0.5 M, pH = 7) was used as the electrolyte. A solar simulator (Oriel LCS-100) with 100 W Xenon lamp and AM1.5G filter was used as the simulated sunlight source in the measurements of photocurrent and photodegradation, which were carried out at room temperature. In the photodegradation experiment, the methylene blue (MB) solution was prepared by dissolving 2.5 mg of MB in 250 ml deionized water (i.e., 10 mg L−1). 15 mg of the catalyst was then added into 30 ml of such MB solution (i.e., 31.2 μmol L−1) with the pH value being kept at about 7. The degradation rate was monitored every 0.5 h by the ultraviolet-visible absorption spectroscopy (Chromtech CT-2200).
3. Results and discussion
3.1. Phases and microstructures
Fig. 1(a) and (b) show the XRD patterns of BFMM (x = 0 & 6%), which confirm that the samples belong to the rhombohedral phase (R3m) of BF (PDF#74-2016). It is noted that a small amount of the secondary phase, Bi25FeO40 (PDF#46-0416), was presented in the samples. Fig. 1(c) shows the XRD pattern of the composite with the BFMM/GCN weight ratio of 1![[thin space (1/6-em)]](https://www.rsc.org/images/entities/char_2009.gif) :
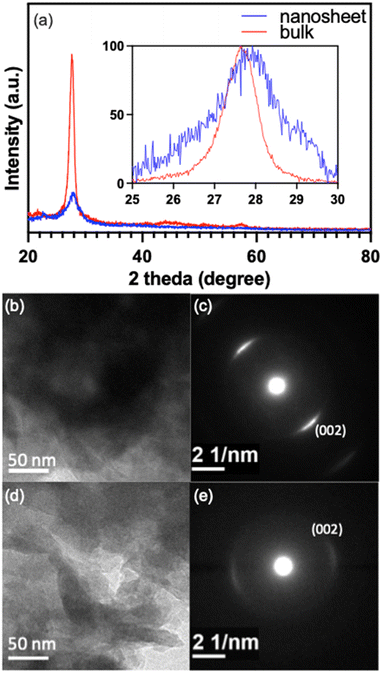
:![[thin space (1/6-em)]](https://www.rsc.org/images/entities/char_2009.gif) 3, where the great increase in the peak intensity at 2θ ≈ 28.0° came from the contribution of GCN. This is apparent by comparison with the XRD patterns for pure GCN, which are shown in Fig. 2(a) for both the bulk GCN prepared by thermal polymerization and the GCN nanosheets after exfoliated in sulfur acid. Only the (002) peak at 2θ ≈ 28.0° was observed for GCN due to its layered 2D structure, which was consistent with the XRD result given in previous publications.15,16
3, where the great increase in the peak intensity at 2θ ≈ 28.0° came from the contribution of GCN. This is apparent by comparison with the XRD patterns for pure GCN, which are shown in Fig. 2(a) for both the bulk GCN prepared by thermal polymerization and the GCN nanosheets after exfoliated in sulfur acid. Only the (002) peak at 2θ ≈ 28.0° was observed for GCN due to its layered 2D structure, which was consistent with the XRD result given in previous publications.15,16
Fig. 2(a) indicates that compared to bulk GCN, the peak intensity for GCN nanosheets reduced greatly with a notable increase in peak width. This agrees with the crystallite-size-related peak broadening in XRD. Based on the full-width at half-maximum (FWHM), Scherrer equation can be applied to estimate the crystallite dimension vertical to the reflection plane,17 which is actually the thickness in the case of layered crystallites. As shown in the inset of Fig. 2(a), the FWHM of GCN nanosheets was much larger than that of bulk GCN, indicating a much smaller thickness, which was calculated to be about 5.5 nm. On the other hand, Fig. 2(a) also shows a peak shift to higher 2θ side for the nanosheets, indicating that the d-spacing of (002) planes in the GCN nanosheets was shorter than that in bulk GCN, presumably arising from a stronger bonding between the pi-conjugated (002) atomic layers in the GCN nanosheets. To further confirm that the exfoliation process was indeed effective, TEM was carried out and the results are shown in Fig. 2(b)–(e). The exfoliated GCN (Fig. 2(d)) displays a clearly different morphology from the bulk GCN (Fig. 2(b)). The former can readily be recognized with the stacked flakes, which have a much higher transparency due to their much thinner thickness. Also, the spots in the selected-area electron diffraction (SAED) are much weaker and more diffusive for the exfoliated GCN (Fig. 2(e)) compared to the bulk GCN (Fig. 2(c)), as the consequence of a very thin thickness.
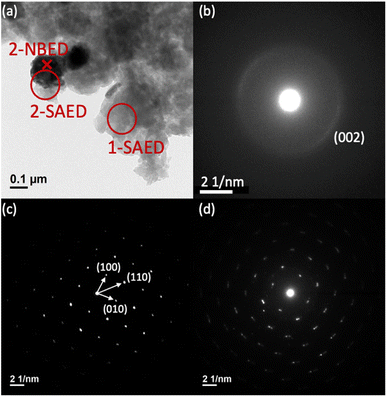
Fig. 3(a) shows a TEM bright-field image of the composite formed between BFMM (x = 6%) and GCN nanosheets (weight ratio 1![[thin space (1/6-em)]](https://www.rsc.org/images/entities/char_2009.gif) :
:![[thin space (1/6-em)]](https://www.rsc.org/images/entities/char_2009.gif) 3), in which the dark areas are BFMM while the light-gray areas are GCN, as identified by SAED or nano-beam electron diffraction (NBED). Fig. 3(b) is the SAED pattern taken at the area marked as 1-SAED (red circle) in Fig. 3(a), which resembles Fig. 2(e) and is therefore confirmed to be GCN nanosheets. Fig. 3(c) is the NBED pattern for the location marked as 2-NBED (red cross) in Fig. 3(a), which matches very well with the rhombohedral phase of BF (PDF#74-2016). The diffraction spots in Fig. 3(c) are well-defined with high brightness, signifying a high crystallinity of the small BFMM grains. Fig. 3(d) is the SAED pattern for the area marked as 2-SAED (red circle) in Fig. 3(a), which encompasses both the locations of BFMM and GCN nanosheets. As expected, the pattern can be recognized as the superposition of the patterns of BFMM and GCN, i.e., Fig. 3(c) and (b), respectively, indicating that BFMM is in direct contact with GCN and the secondary phase (Bi25FeO40) observed in XRD did not occur at the junction between BFMM and GCN.
3), in which the dark areas are BFMM while the light-gray areas are GCN, as identified by SAED or nano-beam electron diffraction (NBED). Fig. 3(b) is the SAED pattern taken at the area marked as 1-SAED (red circle) in Fig. 3(a), which resembles Fig. 2(e) and is therefore confirmed to be GCN nanosheets. Fig. 3(c) is the NBED pattern for the location marked as 2-NBED (red cross) in Fig. 3(a), which matches very well with the rhombohedral phase of BF (PDF#74-2016). The diffraction spots in Fig. 3(c) are well-defined with high brightness, signifying a high crystallinity of the small BFMM grains. Fig. 3(d) is the SAED pattern for the area marked as 2-SAED (red circle) in Fig. 3(a), which encompasses both the locations of BFMM and GCN nanosheets. As expected, the pattern can be recognized as the superposition of the patterns of BFMM and GCN, i.e., Fig. 3(c) and (b), respectively, indicating that BFMM is in direct contact with GCN and the secondary phase (Bi25FeO40) observed in XRD did not occur at the junction between BFMM and GCN.
3.2. Photocatalytic performances
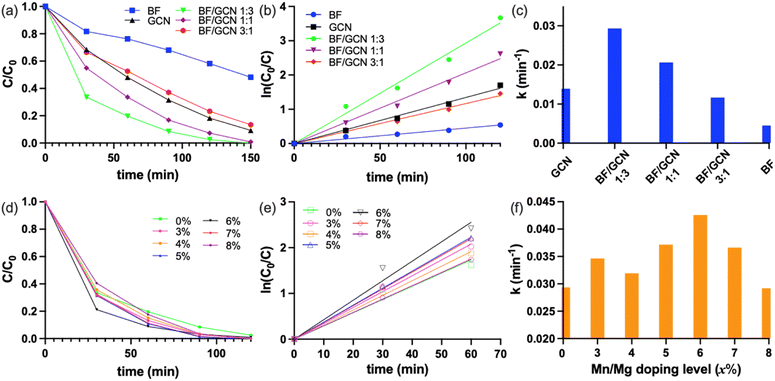
Methylene blue (MB) was chosen as the organic pollutant for testing the photocatalytic performances of the synthesized samples, including BFMM (x = 0–8%), GCN nanosheets and BFMM/GCN composites. The photodegradation efficiencies were measured under the illumination of 100 W Xenon lamp and the procedures were described in the experimental section. Fig. 4(a) compares the decay curves of MB concentration in the presence of each of the catalysts: BF (i.e., BFMM with x = 0), GCN and the BF/GCN composites with different weight ratios. The composites with the BF/GCN weight ratios of 1![[thin space (1/6-em)]](https://www.rsc.org/images/entities/char_2009.gif) :
:![[thin space (1/6-em)]](https://www.rsc.org/images/entities/char_2009.gif) 3 and 1
3 and 1![[thin space (1/6-em)]](https://www.rsc.org/images/entities/char_2009.gif) :
:![[thin space (1/6-em)]](https://www.rsc.org/images/entities/char_2009.gif) 1 give rise to a faster decay than either of the individual BF and GCN. In particular, the BF/GCN composite with the weight ratio of 1
1 give rise to a faster decay than either of the individual BF and GCN. In particular, the BF/GCN composite with the weight ratio of 1![[thin space (1/6-em)]](https://www.rsc.org/images/entities/char_2009.gif) :
:![[thin space (1/6-em)]](https://www.rsc.org/images/entities/char_2009.gif) 3 shows the most rapid decay in the MB concentration. So, this ratio was later used to make the BFMM/GCN composite catalysts for investigating the effect of Mn/Mg co-doping.
3 shows the most rapid decay in the MB concentration. So, this ratio was later used to make the BFMM/GCN composite catalysts for investigating the effect of Mn/Mg co-doping.
The degradation kinetics of MB is well known to have the type of pseudo-first-order reaction,18,19 i.e., ln(C0/C) = kt, where C0 and C are the MB concentrations at beginning (i.e., t = 0) and time t, respectively, and k is the degradation rate constant. Fig. 4(b) shows the plots of ln(C0/C) vs. t, which have a fairly good linearity for all the samples, indicating that they indeed follow the pseudo-first-order kinetics. The rate constants obtained from the slopes of the graphs in Fig. 4(b) are compared in Fig. 4(c), which shows that the degradation rate for BF/GCN = 1![[thin space (1/6-em)]](https://www.rsc.org/images/entities/char_2009.gif) :
:![[thin space (1/6-em)]](https://www.rsc.org/images/entities/char_2009.gif) 3 composite (k = 0.029 min−1) is 2.2 times higher than GCN (k = 0.013 min−1) and 6.4 times higher than BF (k = 0.0045 min−1). Fig. 4(d) shows the decay curves of MB concentration in the presence of BFMM/GCN (1
3 composite (k = 0.029 min−1) is 2.2 times higher than GCN (k = 0.013 min−1) and 6.4 times higher than BF (k = 0.0045 min−1). Fig. 4(d) shows the decay curves of MB concentration in the presence of BFMM/GCN (1![[thin space (1/6-em)]](https://www.rsc.org/images/entities/char_2009.gif) :
:![[thin space (1/6-em)]](https://www.rsc.org/images/entities/char_2009.gif) 3) composites of different Mn/Mg co-doping levels in BFMM (x = 0–8%). The ln(C0/C) vs. t plots of these samples are shown in Fig. 4(e), according to which the rate constants are calculated and plotted in Fig. 4(f). The k value increases generally with the increase in x until x = 6% and then decreases as x increases further. The numerical readings of k are 0.029, 0.035, 0.032, 0.037, 0.043, 0037 and 0.029 min−1 for x = 0%, 3%, 4%, 5%, 6%, 7% and 8%, respectively. The composite made with BFMM of x = 6% has its rate constant improved by more than 48% compared to the composite of BF/GCN (1
3) composites of different Mn/Mg co-doping levels in BFMM (x = 0–8%). The ln(C0/C) vs. t plots of these samples are shown in Fig. 4(e), according to which the rate constants are calculated and plotted in Fig. 4(f). The k value increases generally with the increase in x until x = 6% and then decreases as x increases further. The numerical readings of k are 0.029, 0.035, 0.032, 0.037, 0.043, 0037 and 0.029 min−1 for x = 0%, 3%, 4%, 5%, 6%, 7% and 8%, respectively. The composite made with BFMM of x = 6% has its rate constant improved by more than 48% compared to the composite of BF/GCN (1![[thin space (1/6-em)]](https://www.rsc.org/images/entities/char_2009.gif) :
:![[thin space (1/6-em)]](https://www.rsc.org/images/entities/char_2009.gif) 3).
3).
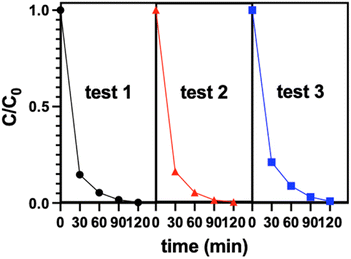
The reusability tests were carried out with the composite sample BFMM (x = 6%)/GCN (1![[thin space (1/6-em)]](https://www.rsc.org/images/entities/char_2009.gif) :
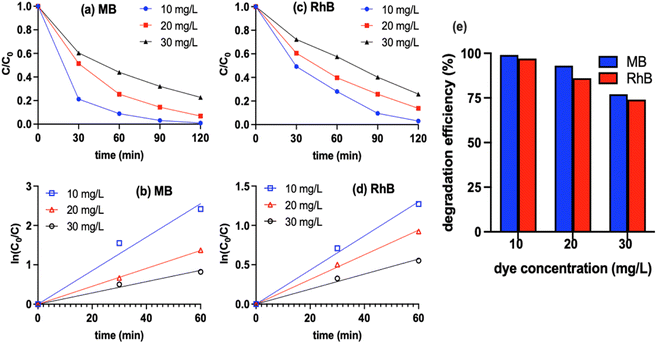
:![[thin space (1/6-em)]](https://www.rsc.org/images/entities/char_2009.gif) 3) and the results are shown in Fig. 5, which indicates that there was little change in the degradation curves after second and third reuses of the catalyst. Photodegradations for two higher MB concentrations, i.e., double and triple of the previous concentration, were also measured and the results are presented in Fig. 6. Similar to what was reported in many of the published works, higher concentration led to somewhat lower efficiency.20,21 This may be attributed to a higher light absorption of the solution with higher MB concentration, which results in a reduced light penetration through the solution to the catalysts.20,21 To confirm that the catalysts developed in this study also work for other organic pollutants, photodegradations of rhodamine B (RhB) were measured with the composite BFMM (x = 6%)/GCN (1
3) and the results are shown in Fig. 5, which indicates that there was little change in the degradation curves after second and third reuses of the catalyst. Photodegradations for two higher MB concentrations, i.e., double and triple of the previous concentration, were also measured and the results are presented in Fig. 6. Similar to what was reported in many of the published works, higher concentration led to somewhat lower efficiency.20,21 This may be attributed to a higher light absorption of the solution with higher MB concentration, which results in a reduced light penetration through the solution to the catalysts.20,21 To confirm that the catalysts developed in this study also work for other organic pollutants, photodegradations of rhodamine B (RhB) were measured with the composite BFMM (x = 6%)/GCN (1![[thin space (1/6-em)]](https://www.rsc.org/images/entities/char_2009.gif) :
:![[thin space (1/6-em)]](https://www.rsc.org/images/entities/char_2009.gif) 3) and the results are also shown in Fig. 6 to compare with MB, which indicates that, similar to MB, it follows the same pseudo-first-order reaction with a slightly lower degradation efficiency.
3) and the results are also shown in Fig. 6 to compare with MB, which indicates that, similar to MB, it follows the same pseudo-first-order reaction with a slightly lower degradation efficiency.
3.3. Photocurrent, band alignment and photocatalytic mechanism
It is well known that photocatalytic degradation of organic molecules/ions (e.g., MB) in a solution is associated with the photogenerated electrons in CB and holes in VB of the semiconductor photocatalyst. The electrons in CB will be captured by the adsorbed oxygen to form superoxide radicals (O2˙−), attacking MB.22,23 At the same time, the holes in VB will too oxidize MB either directly or via ˙OH, which is oxidized from OH− in water.22,23 So, the degradation performance of the photocatalysts is closely related to their capability to generate photocurrents. Fig. 7 shows the photocurrent density generated under the illumination of the same light source as that used for the above photodegradations. BFMM has a higher photocurrent than pristine BF, which may be attributed to a smaller band gap of the Mn/Mg co-doped samples and thus a more efficient absorption of sunlight. As shown in Fig. 8(a), the band gap of BFMM (x = 0–7%) decreases as the Mn/Mg doping level increases, varying from 2.24 eV for pristine BF to 1.75 eV for BFMM with x = 7%. Fig. 8(b) shows the band gaps measured for GCN bulk and nanosheets. Both have a similar value of about 2.85 eV. Fig. 8(c) shows the band gaps measured with the BF/GCN composite, which indicate that both the band gaps of BF and GCN remain almost unchanged. It is noted in Fig. 7 that despite of a wider band gap, GCN nanosheets show a higher photocurrent than BFMM. This may be resulted from a more efficient charge separation in GCN nanosheets than in BFMM. Nevertheless, the most notable increase in the photocurrent in Fig. 7 is observed with the composite samples, which is far higher than either of the individual BFMM or GCN, indicating that the heterojunction between BFMM and GCN has a profound effect on the generation of photocurrents.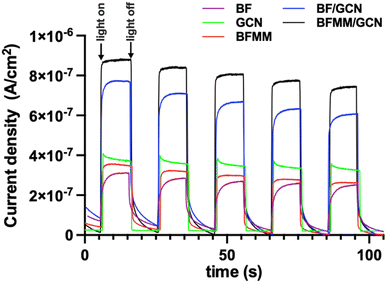 | ||
Fig. 7 Photocurrent densities for BF, GCN nanosheets, BFMM (x = 6%), BF/GCN (1![[thin space (1/6-em)]](https://www.rsc.org/images/entities/char_2009.gif) : :![[thin space (1/6-em)]](https://www.rsc.org/images/entities/char_2009.gif) 3) composite, and BFMM (x = 6%)/GCN (1 3) composite, and BFMM (x = 6%)/GCN (1![[thin space (1/6-em)]](https://www.rsc.org/images/entities/char_2009.gif) : :![[thin space (1/6-em)]](https://www.rsc.org/images/entities/char_2009.gif) 3) composite, which were measured under the same light source as that used for the measurements in Fig. 4. 3) composite, which were measured under the same light source as that used for the measurements in Fig. 4. | ||
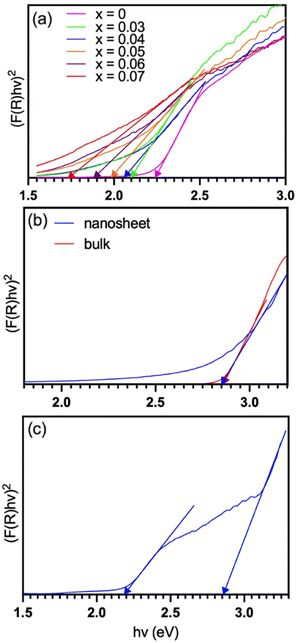 | ||
Fig. 8 Tauc plots for the measurement of band gaps: (a) BFMM with x = 0–7%, (b) GCN bulk and nanosheets, and (c) BF/GCN (1![[thin space (1/6-em)]](https://www.rsc.org/images/entities/char_2009.gif) : :![[thin space (1/6-em)]](https://www.rsc.org/images/entities/char_2009.gif) 3) composite. 3) composite. | ||
To reveal the electronic band alignment at BFMM/GCN junction, the flat-band potential (Vfb) was measured by means of the Mott–Schottky plot, i.e., C−2 vs. V (where C is the capacitance of space charge layer and V is the applied voltage). The intercept to the V axis of the plot gives the value of Vfb, while the positive or negative slope indicates whether the semiconductor is n-type or p-type, respectively.24 Fig. 9 shows that GCN, BF and BFMM (x = 6%) have the Vfb values of −1.4, −0.6 and −0.5 eV (vs. Ag/AgCl) or −0.79, +0.01, +0.11 (vs. NHE), respectively. They all have a positive slope and therefore belong to the n-type semiconductor. Vfb is the Fermi level of a semiconductor with reference to the redox potential of the electrolyte.24 For an n-type semiconductor, its Fermi level is very close to the CB minimum (CBM). So, if the small gap between Vfb and CBM is negligible, the measured Vfb and band-gap can be used to align the electronic bands of GCN and BFMM, as shown in Fig. 10(a). Because GCN has a higher Vfb (more negative) than BFMM, when the two are in contact, electrons will flow from GCN to BFMM, resulting in an upwards band bending of GCN and a downwards band bending of BFMM, as illustrated in Fig. 10(b).
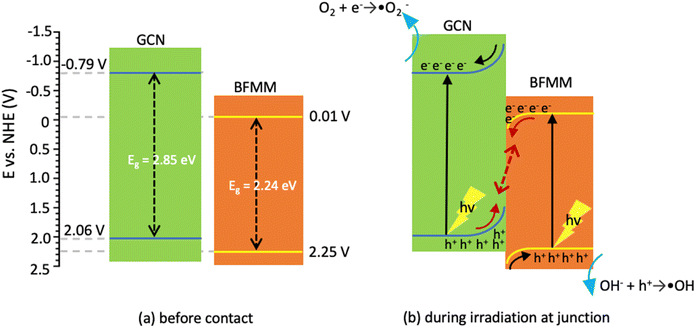 | ||
| Fig. 10 (a) Alignment of electronic bands for GCN and BFMM (x = 0) before contact. (b) Band bending after contact and the charge movements during light irradiation. | ||
The heterojunction at the BFMM/GCN interface (Fig. 10(b)) may lead to a more efficient separation of photogenerated charge carriers through the so-called S-scheme mechanism,14 as explained below. Upon light excitation, the electrons in GCN are promoted to CB, where the band bending drives them away from the junction towards the opposite surface of GCN, while the holes in the VB of GCN are driven by the band bending towards the junction, where they accumulate because there exists a potential barrier preventing them from entering BFMM. At the same time, an opposite process takes place in BFMM upon the light excitation, where photogenerated electrons in CB accumulate at the junction, while the holes in VB are pushed away from the junction by the band bending towards the other surface of BFMM. A cross-recombination process then takes place at the junction to drain the electrons and holes accumulated at the CB of BFMM and the VB of GCN, respectively. It is noted that the junction between BFMM/GCN is not in contact with the solution, so such a recombination process does not affect photodegradation efficiency but helps to retain the electrons at the CB of GCN and the holes at the VB of BFMM for photodegradation.
So, the greatly increased photocurrent and degradation efficiency for BF/GCN (1![[thin space (1/6-em)]](https://www.rsc.org/images/entities/char_2009.gif) :
:![[thin space (1/6-em)]](https://www.rsc.org/images/entities/char_2009.gif) 3) composite can be well explained by the mechanism illustrated in Fig. 10(b). On the other hand, the higher degradation rates for the composites made with the Mn/Mg co-doped BF, compared to the composite made with pristine BF (see Fig. 4(f)), are due to a better absorption of sunlight of BFMM because of their narrower band gaps, as discussed above. However, as shown in Fig. 8(a), the band gaps of BFMM decrease constantly as x in BFMM increases from 0 to 7%, but Fig. 4(f) shows that the degradation rates increase as x increases from 0 to 6% and then decrease as x increases further. The latter decrease in degradation rate may be explained as follows. As shown in Fig. 9(c), the Mn/Mg co-doping only results in a small change in Vfb. So, the reduction in band gap for BFMM results in an upshift of VB, which is too much for the BFMM with x > 6%, so that the position of VB is more negative than the •OH/OH− redox potential (1.99 eV). As the result, less amounts of •OH are produced for photodegradation of MB.
3) composite can be well explained by the mechanism illustrated in Fig. 10(b). On the other hand, the higher degradation rates for the composites made with the Mn/Mg co-doped BF, compared to the composite made with pristine BF (see Fig. 4(f)), are due to a better absorption of sunlight of BFMM because of their narrower band gaps, as discussed above. However, as shown in Fig. 8(a), the band gaps of BFMM decrease constantly as x in BFMM increases from 0 to 7%, but Fig. 4(f) shows that the degradation rates increase as x increases from 0 to 6% and then decrease as x increases further. The latter decrease in degradation rate may be explained as follows. As shown in Fig. 9(c), the Mn/Mg co-doping only results in a small change in Vfb. So, the reduction in band gap for BFMM results in an upshift of VB, which is too much for the BFMM with x > 6%, so that the position of VB is more negative than the •OH/OH− redox potential (1.99 eV). As the result, less amounts of •OH are produced for photodegradation of MB.
It is noted that BF/GCN composites have been reported in several previous studies as the catalysts for water splitting,25 or for photodegradation of organic pollutants.26–30 In most of these publications, the mechanism for the increased catalytic efficiency was discussed according to the band alignment under the flat-band condition without considering the band bending at the heterojunction, and therefore a different mechanism was proposed, in which the photogenerated electrons are assumed to flow directly from the CB of GCN to the CB of BF, while the holes flow from the VB of BF to the VB of GCN.27–30 If the band bending at the junction is taken into account, there are potential barriers at both sides of the junction, which will hinder the proposed charge flows. So, such a mechanism is less likely to happen compared to the S-scheme proposed in Fig. 10(b).
4. Conclusions
Mn/Mg co-doping in BF resulted in a reduced band-gap in the BFMM (x = 0.03–0.07) samples, leading to a more efficient absorption of sunlight and thus an increase in photocurrent. A S-scheme heterojunction was constructed between BFMM and GCN nanosheets for more efficient separation of photogenerated charge carriers that are indispensable in the photodegradation process. The Mott–Schottky plots showed that both BFMM and GCN belonged to n-type semiconductor, which had the flat-band potentials of −0.79 and +0.11 V (vs. NHE), respectively. So, the band alignment allowed the S-scheme to work, leading to a great increase in photocurrent and hence a great improvement in the photodegradation efficiency of MB. In particular, the composite with BFMM/GCN weight ratio of 1![[thin space (1/6-em)]](https://www.rsc.org/images/entities/char_2009.gif) :
:![[thin space (1/6-em)]](https://www.rsc.org/images/entities/char_2009.gif) 3 showed a MB degradation rate over 6 times faster than the pristine BF, and the Mn/Mg co-doping improved the efficiency by 48%.
3 showed a MB degradation rate over 6 times faster than the pristine BF, and the Mn/Mg co-doping improved the efficiency by 48%.
Author contributions
W.-C. C.: investigation, data curation, preparation of graphics. X. Q.: supervision, conceptualization, writing, funding acquisition.Conflicts of interest
The authors declare that they have no known competing financial interests or personal relationships that could have appeared to influence the work reported in this paper.Acknowledgements
This work was supported by the National Science and Technology Council (NSTC), Taiwan, under the grant numbers: MOST 111-2221-E-006-154 and NSTC 112-2221-E-006-074.Notes and references
- S.-Y. Lee and S.-J. Park, J. Ind. Eng. Chem., 2013, 19, 1761–1769 CrossRef CAS
.
- C. B. Ong, L. Y. Ng and A. W. Mohammad, Renew. Sust. Energ. Rev., 2018, 81, 536–551 CrossRef CAS
.
- Y. Liu, B. Yang, H. He, S. Yang, X. Duan and S. Wang, Sci. Total Environ., 2022, 804, 150215 CrossRef CAS PubMed
.
- X. Wu, C. Y. Toe, C. Su, Y. H. Ng, R. Amal and J. Scott, J. Mater. Chem. A, 2020, 8, 15302–15318 RSC
.
- K. Wang, C. Han, Z. Shao, J. Qiu, S. Wang and S. Liu, Adv. Funct. Mater., 2021, 31, 2102089 CrossRef CAS
.
- A. Haruna, I. Abdulkadir and S. Idris, Heliyon, 2020, 6, e03237 CrossRef CAS PubMed
.
- S. Man, X. Leng, J. Bai, S. Kan, Y. Cui, J. Wang and L. Xu, Ceram. Int., 2023, 49, 10255–10264 CrossRef CAS
.
- M. Sakar, S. Balakumar, P. Saravanan and S. Bharathkumar, Nanoscale, 2015, 7, 10667–10679 RSC
.
- F. Mushtaq, X. Chen, M. Hoop, H. Torlakcik, E. Pellicer, J. Sort, C. Gattinoni, B. J. Nelson and S. Pané, Iscience, 2018, 4, 236–246 CrossRef CAS
.
- B.-G. Park, Mater. Lett., 2021, 285, 129006 CrossRef CAS
.
- X. Wang, W. Mao, Q. Zhang, Q. Wang, Y. Zhu, J. Zhang, T. Yang, J. Yang, X. a. Li and W. Huang, J. Alloys Compd., 2016, 677, 288–293 CrossRef CAS
.
- M. A. Marwat, H. Ullah, M. Usman, M. A. Ehsan, H. Zhang, M. F. Khan, S. Ali and M. Yousaf, Ceram. Int., 2022, 48, 14789–14798 CrossRef CAS
.
- X.-L. Liang, J.-Q. Dai and G.-d. Zhang, Appl. Surf. Sci., 2022, 586, 152751 CrossRef CAS
.
- Q. Xu, L. Zhang, B. Cheng, J. Fan and J. Yu, Chem, 2020, 6, 1543–1559 CAS
.
- P. Qiu, H. Chen, C. Xu, N. Zhou, F. Jiang, X. Wang and Y. Fu, J. Mater. Chem. A, 2015, 3, 24237–24244 RSC
.
- J. Tian, Q. Liu, C. Ge, Z. Xing, A. M. Asiri, A. O. Al-Youbi and X. Sun, Nanoscale, 2013, 5, 8921–8924 RSC
.
- B. Li, J. He, D. G. Evans and X. Duan, J. Phys. Chem. Solids, 2006, 67, 1067–1070 CrossRef CAS
.
- H. Etay, A. Kumar and O. P. Yadav, J. Anal. Pharm. Res., 2023, 12(1), 32–37 Search PubMed
.
- I. Raheb and M. S. Manlla, Heliyon, 2021, 7, e07427 CrossRef CAS PubMed
.
- F. H. Mustapha, A. A. Jalil, M. Mohamed, S. Triwahyono, N. S. Hassan, N. F. Khusnun, C. N. C. Hitam, A. F. A. Rahman, L. Firmanshah and A. S. Zolkifli, J. Clean. Prod., 2017, 168, 1150–1162 CrossRef CAS
.
- K. A. Isai and V. S. Shrivastava, SN Appl. Sci., 2019, 1, 1247 CrossRef CAS
.
- A. A. Olajire and A. J. Olajide, J. Phys. Chem. Biophys., 2014, 4, 136 Search PubMed
.
- A. Houas, H. Lachheb, M. Ksibi, E. Elaloui, C. Guillard and J.-M. Herrmann, Appl. Catal., B, 2001, 31, 145–157 CrossRef CAS
.
- Z. Chen, T. G. Deutsch, H. N. Dinh, K. Domen, K. Emery, A. J. Forman, N. Gaillard, R. Garland, C. Heske, T. F. Jaramillo, A. Kleiman-Shwarsctein, E. Miller, K. Takanabe and J. Turner, Flat-Band Potential Techniques, in Photoelectrochemical Water Splitting: Standards, Experimental Methods, and Protocols, ed. Z. Chen, H. N. Dinh and E. Miller, Springer, New York ( 2013), pp. 63–85 Search PubMed
.
- H. Sepahvand and S. Sharifnia, Int. J. Hydrog. Energy., 2019, 44, 23658–23668 CrossRef CAS
.
- Y. Yang, J. Zhu, Y. He, M. Li, Y. Liu, M. Chen and D. Cao, J. Alloys Compd., 2022, 893, 162270 CrossRef CAS
.
- L. Mohanty, D. Sundar Pattanayak, R. Singhal, D. Pradhan and S. Kumar Dash, Inorg. Chem. Commun., 2022, 138, 109286 CrossRef CAS
.
- J. An, G. Zhang, R. Zheng and P. Wang, J. Environ. Sci., 2016, 48, 218–229 CrossRef CAS PubMed
.
- X. Wang, W. Mao, J. Zhang, Y. Han, C. Quan, Q. Zhang, T. Yang, J. Yang, X. Li and W. Huang, J. Colloid Interface Sci., 2015, 448, 17–23 CrossRef CAS PubMed
.
- T. Fan, C. Chen, Z. Tang, Y. Ni and C. Lu, Mater. Sci. Semicond. Process., 2015, 40, 439–445 CrossRef CAS
.
| This journal is © The Royal Society of Chemistry 2023 |


