 Open Access Article
A highly sensitive flexible humidity sensor based on conductive tape and a carboxymethyl cellulose@graphene composite†
Haoxiang Wanga,
Chengli Tang *bc and
Jun Xud
aFaculty of Mechanical Engineering, Zhejiang Sci-Tech University, Hangzhou, 310018, China
bCollege of Information Science and Engineering, Jiaxing University, Jiaxing, 314001, China. E-mail: tcl-lily@zjxu.edu.cn
cKey Laboratory of Medical Electronics and Digital Health of Zhejiang Province, Jiaxing University, Jiaxing, 314001, China
dFirst Affiliated Hospital of Jiaxing University, Jiaxing, 314000, China
First published on 18th September 2023
Abstract
Flexible humidity sensors have found new applications in diverse fields including human healthcare, the Internet of Things, and so on. In this paper, a highly sensitive humidity sensor based on carboxymethyl cellulose@graphene and conductive adhesive tape was developed. The sensor was constructed on conductive tape which acted as both of the flexible substrate and the electrode to transmit electronic signals. A carboxymethyl cellulose@graphene composite was assembled on the substrate as the sensing layer by a simple spreading method in a 3-D printed groove mold. The sensitive material was characterized for its morphology, composition, crystalline phase, and hydrophilicity by SEM, EDS, XRD, and contact angle measurements. The effect of graphene on the sensitivity was investigated in detail by adjusting the doping concentration. Humidity sensing performance was tested in different relative humidity levels. The rapid responses under different respiratory conditions demonstrated their practical usability in continuous respiration monitoring and recognition of respiratory status. The conductive mechanism of the sensing film was studied by complex impedance spectroscopy under different relative humidity levels. A rational sensing mechanism was proposed integrating ionic conduction, electron conduction and swelling behavior of the carboxymethyl cellulose@graphene composite.
1 Introduction
The last few decades have witnessed the rapid development of flexible electronics, especially those products with sensing functions.1 Consequently, different sensors have received extensive attention in the field of wearable electronics and intelligent robots. For example, flexible sensors have found applications in temperature sensing,2 specific gas sensing,3 pressure sensing,4 humidity sensing,5,6 and so on. Humidity (usually refers to relative humidity, RH) is an environmental parameter that needs to be monitored and controlled in industry, agriculture, and people's lives. With the development of flexible humidity sensors, the applications have expanded to new fields such as respiratory behavior monitoring,7 skin moisture detecting,5 non-contact switching,5 diaper monitoring,8 and so on.The flexible humidity sensor is generally composed of flexible substrate, electrode and humidity sensing material.9 Commonly used flexible substrates include polymer materials such as PDMS (polydimethylsiloxane), PI (polyimide), and PET (polyethylene terephthalate). Humidity sensors made of such materials do not perform well in comfort. Paper based humidity sensors have also been developed with good flexibility, porous structure, hydrophilicity and low cost. But the problems of friability and wrinkles of the paper substrate are inevitable. In some research, humidity sensing materials were integrated with the substrate to form a self-supporting structure, one only need to fabricate electrode on the material surface by printing, lithography, evaporation or magnetron sputtering method.10 Methods used to assemble humidity sensing materials on the substrate include drop coating,11,12 spin coating,13 layer-by-layer self-assembly,14 screen printing,15 gas spraying,16 vacuum filtration,5,17 soaking,18 painting,19 and Langmuir–Blodgett technique,20 most of which require specialized setups. Hence, further simplifying of the sensor structure is still in need to realize simple and fast preparation and to reduce the sensor cost.
Materials sensitive to moisture are essential for the fabrication of flexible humidity sensor. Up to now, many kinds of humidity sensing materials have been reported for humidity sensor, including carbon materials,10 polymers,12,16 oxides11,14 and their composites. In the last decade, environmental conscious has been paid increasing attention in science and technology. Polymers have attracted extensive research attentions to serve as building blocks for various sensors featured with biocompatible and environmental-friendly. As a typical polymer, cellulose is a promising candidate for flexible humidity sensor because of its biocompatibility, biodegradability, and affinity to water attribute to the large amount of hydroxyl groups. The unique property of biodegradability of the biomaterials-based humidity sensor ensures the safety upon wearing on human body. In the reported research, cellulose is generally further treated or modified for use as a moisture-sensitive material. By immersing cellulose in the CaCl2/sorbitol solution for solvent displacement, Yu et al.21 fabricated a cellulose nanofibril-reinforced and highly ion-conductive organogel featuring excellent anti-freezing and anti-dehydration performances. The prepared organogel exhibited high humidity sensitivity in a wide detection range (23–97% RH). Zhu et al.5 developed a flexible humidity sensor based on cellulose nanofiber/carbon nanotube via vacuum filtration. In another research work,22 the same group reported a paper-based humidity sensor with nanoporous cellulose nanofiber and carbon nanotube as the sensitive layer. Taking advantage of the hygroscopic properties of cellulose paper, some paper-based humidity sensors were also reported.23,24
An effective strategy to improve the moisture response relies on mixing polymer with inorganic material to form conductive composites.12,25 Among the variety of inorganic nanomaterials, graphene and its derivatives have been extensively investigated as humidity or gas sensors owing to their large surface area, mechanical compliance and good chemical stability.7,26 For example, Craciun et al.27 proposed a wafer-scale all-graphene-based humidity sensor on silicon and PET surfaces based on the techniques of pattern generation and material deposition. A laser fabrication method was applied to create the interdigital laser-induced graphene electrode by Lan et al.28 Then graphene oxide solution was drop-casted on the electrodes as the humidity sensing material to fabricate a capacitive humidity sensor.
In considering of the skin-friendly of the sensor, simplicity of the sensor structure and preparation process, a flexible humidity sensor based on carboxymethyl cellulose@graphene (CMC@graphene) composite and conductive tape was proposed in this research. CMC@graphene composite was assembled on conductive tape as the sensitive materials that can response to RH variations. Conductive tape was employed as both of the flexible substrate and electrode of the sensor, which has the advantage of resistant to deformation even after water absorption. The CMC@graphene composite material was prepared by a simple ultrasonic dispersion process and then spread on the conductive tape as the sensing layer. Characterizations of the composite and sensing layer were carried out. Response, flexibility, stability and repeatability, anti-interference property of the prepared sensor and its sensing mechanism were carried out to investigate its humidity sensing property and practicability.
2 Experimental section
2.1 Materials
Carboxymethyl cellulose with average molecular weight of 700![[thin space (1/6-em)]](https://www.rsc.org/images/entities/char_2009.gif) 000 (DS = 0.9) and viscosity of 2500–4500 mPa s was purchased from Shanghai Macklin Biochemical Technology Co., Ltd. The CMC was used as received without further purification or treatment. Single layed graphene powder was purchased from Kaisa New Materials Co. Ltd. Conductive tape with thickness of 1 mm and width of 5 mm was purchased from Shenzhen Changdasheng electronics Co., Ltd. The ultra-pure water used in this study was made by the ultrapure water machine (WP-RO-10B, Water Purifier).
000 (DS = 0.9) and viscosity of 2500–4500 mPa s was purchased from Shanghai Macklin Biochemical Technology Co., Ltd. The CMC was used as received without further purification or treatment. Single layed graphene powder was purchased from Kaisa New Materials Co. Ltd. Conductive tape with thickness of 1 mm and width of 5 mm was purchased from Shenzhen Changdasheng electronics Co., Ltd. The ultra-pure water used in this study was made by the ultrapure water machine (WP-RO-10B, Water Purifier).
2.2 Fabrication of the CMC@graphene composite and the flexible humidity sensor
Disperse the CMC powder in ultra-pure water to obtain CMC solution with weight percentage of 1%. Certain amount of graphene powder was added to the CMC solution to fabricate the CMC@graphene composite. Both of the preparation of the CMC solution and CMC@graphene composite was assisted by ultrasonic treatment to obtain uniform dispersion as quick.The assemble of sensitive material on the flexible conductive tape was achieved by a simple spreading method. To be specific, a groove mold with the width of 5.1 mm, length of 20 mm, and depth of 5 mm was manufactured by 3-D printing (fused deposition modeling mechanism). Put the conductive tape into the groove mold and press the surface to smooth it so that the composite solution can evenly distributed on the surface (seen Fig. S1†). Then 350 μl of the CMC@graphene composite solution was dropped onto the conductive tape surface. After spreading, dry it at 60 °C in the oven until the water in the solution was evaporated. The pure CMC solution was also dropped on the conductive tape according to the same procedures for comparison. The preparation process is illustrated in the schematic as shown in Fig. 1.
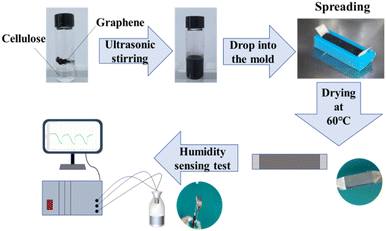 | ||
| Fig. 1 Schematic diagram of the preparation process of the flexible sensor and humidity sensing measurement. | ||
2.3 Material characterizations
The surface morphology and elemental information of the sensitive layer was observed and analyzed by scanning electron microscopy (SEM, Helios 5 CX, Thermoscientific) equipped with energy-dispersive X-ray spectroscopy (EDS). The phase composition of pure graphene, CMC, CMC@graphene, and conductive tape were characterized by X-ray diffraction meter (XRD, DX-2700 BH with Cu Kα radiation). Contact angle of the sensing surface with CMC and CMC@graphene was measured by Drop Shape Analyzer (KRUSS, DSA30S). A modified ASTM tape test (D 3359-08) was used to evaluate the adhesion strength between the sensitive layer and the conductive tape. The optical microscope was used for tape test (Leica DMI 3000 M).2.4 Humidity sensing measurements
Various constant RH conditions (static RH) were achieved by airtight bottles containing saturated solutions of different metal salts. Lithium chloride (LiCl), magnesium chloride (MgCl2), magnesium nitrate (Mg(NO3)2), sodium chloride (NaCl), potassium chloride (KCl) and potassium nitrate (KNO3) were sealed in bottles at 25 °C to obtain RH conditions of 11%, 33%, 54%, 75%, 85% and 95%, respectively. The circumstance temperature and RH in the lab room can be regulated by air conditioner and were measured by hygrothermograph. Sudden changes in the environmental RH were achieved by transferring the sensor between those bottles with particular constant RH. The impedance change of the sensor in different RHs was recorded by the electrochemical workstation (SA5101, Sino Aggtech) at an applied voltage of 0.2 V and a frequency of 10 Hz, 100 Hz, or 1000 Hz. The sensor was operated under different RHs in frequency range from 10 Hz to 100 kHz to obtain the complex impedance spectra. The response (S) of the flexible humidity sensor was evaluated by the impedance change rate (ΔZ/Z) of the sample in RH of 11% and specific RH. For the flexibility test, the sensor was necked-out on the 3D printed semi-cylindrical plastic mold (Fig. S2a†) with diameter of 10 mm and 20 mm. Impedance change was recorded when the sensor was moved from RH 11% to 95% according to the same procedures mentioned above. A simple simulation experiment was implemented to check the anti-interference of pressure and temperature property. Household hair dryer was applied to generate pressure and temperature variations by turning on the cold air gear and hot air gear. In the respiration monitoring performance test, the flexible humidity sensor was placed 3 cm in front of the mouth or nose. Impedance variations were recorded by SA5101 as the volunteers simulated different breathing states.3 Results and discussion
3.1 Morphology and composition
As is shown in Fig. 2a and S3a,† typical woven fabric morphology for the conductive tape surface was observed by SEM and optical microscope. After the CMC@graphene composite was spread on the conductive tape surface, the fibrous surface of the fabric becomes indistinct (Fig. S3b†). Elemental mapping results in Fig. S4† show that the conductive tape contains three elements of carbon, oxygen and nickel. The SEM image of the graphene in Fig. 2b shows a characteristic lamellar structure, while the lamellar structure was not seen in the CMC@graphene composite (Fig. 2c). As is shown in the SEM image with 500× magnification (Fig. S5†), the side in contact with the conductive tape displays woven pattern similar to that of the conductive tape surface. This rough surface helps to increase the adhesion strength between the sensitive layer and the substrate of conductive tape. The EDS results in Fig. S6† reveal that the CMC@graphene sensitive material composed of carbon, oxygen and sodium elements. The CMC@graphene composite with other amount of graphene show the similar morphology to 0.16 wt% graphene (Fig. S7†). The crystallinity and phase composition of the CMC, graphene, CMC@graphene, as well as the flexible conductive tape were all characterized by XRD as shown in Fig. 2d. Strong graphitic peak C (002) at 2θ angle of 26.4° was observed in the XRD pattern of graphene.29 It should state that the CMC and CMC@graphene samples were measured in the form of layer on the conductive tape. The diffraction peaks at 2θ angle of 43.3°, 50.5° and 74.2° was attributed to the (111), (200) and (220) plane of nickel (PDF 04-0850), which was the conductive components in the conductive tape. The obvious peak at 29.5° was assigned to the tape fabric composition of copper. As is seen, there is no obvious difference between these two samples. This was resulted from the amorphous properties and small amount of CMC as compared to the conductive tape. The graphene kept its own crystal phase in the composite with much weaker diffraction intensity, probably because of the very low content of 0.16 wt% in the composite.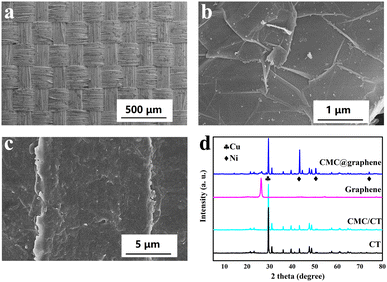 | ||
| Fig. 2 SEM image of the conductive tape (a), graphene (b), CMC@graphene (c), XRD patterns of the conductive tape, graphene, CMC and CMC@graphene composite (d). | ||
3.2 Hydrophilicity of the sensitive layer
As the signal intensity of a humidity sensor reflects the number of water molecules on the sensing materials surface, the hydrophilic property of sensing layer plays a vital role regarding the sensing performance. The sample used for contact angle measurement was the same as that used for the humidity sensing tests, which were not very smooth because of the flexible conductive tape. The contact angle of the CMC spread sample measured immediately after the contact with water droplets was 94° (Fig. 3a), which decreased to 72° (Fig. 3b) after 3 minutes. The CMC@graphene composite spread sample showed the same trend with the contact angle decreased from 44° (Fig. 3c) to 36° (Fig. 3d) within 3 minutes. These results demonstrated that graphene added in the CMC@graphene composite increases the hydrophilicity compared to CMC because of the intrinsic wettability of graphene.30 Moisture can be easily captured by hydrophilic materials, thus the CMC@graphene with enhanced hydrophilicity provided numerous moisture acceptors as humidity sensing layer. The absorbing of water molecules leads to change in impedance of the sensor film, which was recognized by the conductive tape as transduction layer.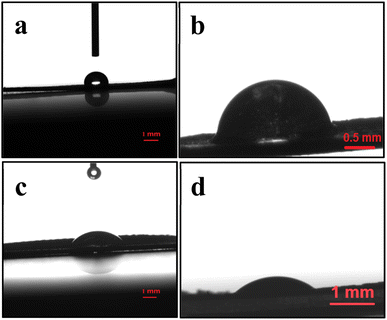 | ||
| Fig. 3 Contact angle of the CMC membrane at 0 min (a) and 3 min (b), CMC@graphene membrane at 0 min (c) and 3 min (d). | ||
3.3 Frequency selection
For the impedance-type flexible humidity sensor, the impedance output is highly related to the RH and frequency.24,25 Considering of the properties of sensitivity and response/recovery time, RH depending on frequency was investigated at 10 Hz, 100 Hz, and 1000 Hz. The sensor was brought from RH 11% to 95% bottle. The response–recovery curves plotted by log![[thin space (1/6-em)]](https://www.rsc.org/images/entities/char_2009.gif) Z and the corresponding response curves (ΔZ/Z0) are shown in Fig. 4. It can be seen that the sensor response fast at all of the three frequencies with the peak be reached within 300 s. From the point view of response vale and recovery time, the frequency of 1000 Hz is far inferior to that of 10 Hz and 100 Hz (Fig. 4d). This is due to that the polarization of water molecules is hard to catch up with the rapid variation of electric fields at high frequency of 1000 Hz. When use another calculation of ΔZ/Z (see Fig. S8†), it can be seen that response in 100 Hz outperforms 10 Hz clearly. Accordingly, frequency of 100 Hz was employed for the following measurements.
Z and the corresponding response curves (ΔZ/Z0) are shown in Fig. 4. It can be seen that the sensor response fast at all of the three frequencies with the peak be reached within 300 s. From the point view of response vale and recovery time, the frequency of 1000 Hz is far inferior to that of 10 Hz and 100 Hz (Fig. 4d). This is due to that the polarization of water molecules is hard to catch up with the rapid variation of electric fields at high frequency of 1000 Hz. When use another calculation of ΔZ/Z (see Fig. S8†), it can be seen that response in 100 Hz outperforms 10 Hz clearly. Accordingly, frequency of 100 Hz was employed for the following measurements.
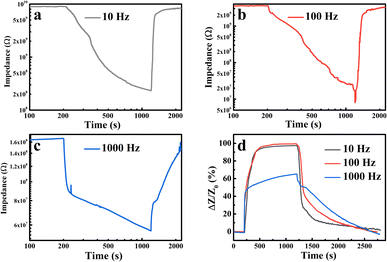 | ||
| Fig. 4 Response–recovery curves measured at frequency of 10 Hz (a), 100 Hz (b), 1000 Hz (c), and their sensitivity curves (d) (RH from 11% to 95%, voltage: 0.2 V). | ||
3.4 Composition optimization
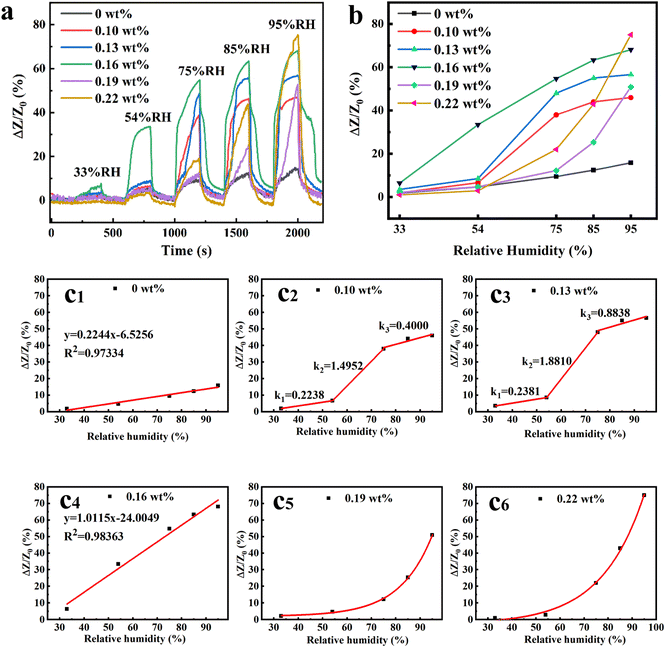
As can be seen in Fig. 5a, all of the prepared sensors can response to the change of RH, and the highest response value is achieved at 95% RH. CMC and CMC@graphene composite is capable of adsorbing more water molecules at high RH, resulting in greater impedance change. The pure CMC based sensor showed moisture sensitivity with the lowest response for all the RHs from 33% to 95%. Addition of graphene in the CMC@graphene improved the sensor response. As is shown in Fig. 5a, the addition of graphene increased the impedance change rate when the sensor moved from RH 11% to higher RHs. For the adding weight of 0.10 wt%, 0.13 wt%, and 0.16 wt% the sensor responses were obvious at RH higher than 54%. Graphene adding ratio of 0.16 wt% show the best response of 97% (ΔZ/Z0) from RH 11% to RH 95%, which is higher than previous reported graphene-contained humidity sensor.22,31 When further improved the adding ratio to 0.19 wt% and 0.22 wt%, the response decreased except for the 0.22 wt% sample at RH 95%.Fig. 5b shows the linearity of the response to different RHs. It is obvious that the 0.16 wt% mass ratio sensor shows the best sensitivity to all the RHs tested except for the RH 95%. When analyzing the responses of different sensors to humidity in detail, it is interesting to find that they presented three different characteristics. The response values and corresponding fitting curves (red line) are seen in Fig. 5c1 to c6. For pure CMC and CMC@graphene with 0.16 wt% addition of graphene, the response increases linearly with increasing RH from 33% to 95%. The slope factor for CMC is 0.2244, while for CMC@graphene it is 1.0115. The higher slope factor indicates that the response value increases more significantly with increasing humidity. In addition, the response values for CMC@graphene composite are much higher than that of CMC in spite of the similar trend to RH variation. The fitting curve exhibits segmented linearity with RH for 0.10 wt% and 0.13 wt% sensors (Fig. 5c2 and c3). The response grows fasted in the RH range of 54% to 75% and slowest in RH range of 33% to 54%. The fitting curves for the CMC@graphene with graphene of 0.19 wt% and 0.22 wt% filed the exponential function (Fig. 5c5 and c6). That is, the response value shows an exponential increase with increasing RH in the range of 33% to 95%. The sensitivity value of 0.22 wt% sensor to RH of 95% even exceeds that of the 0.16 wt%.
3.5 Sensing mechanism
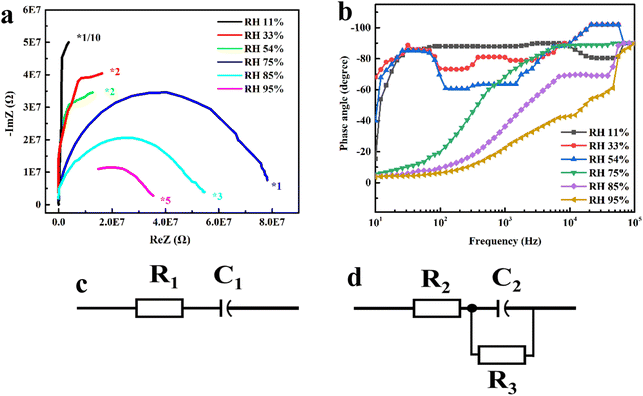
To further investigate the insight conduction mechanism of the CMC@graphene composite during the sensing process, complex impedance spectra were measured at different RH levels (RH of 11%, 33%, 54%, 75%, 85% and 95%) in the frequency range from 10 Hz to 100 kHz. The impedance in the form of real (ImZ) and imaginary parts (ReZ) is depicted in Fig. 6a. In low humidity environment (RH 11% to 54%), the impedance plot exhibits a circular arc with large radius, revealing that the sensor is a capacitance-type device as the equivalent circuit shown in Fig. 6c. This behaviour is in good agreement with previous results.32When the RH reaches 75%, a complete semicircle presents in the complex impedance spectrum. The equivalent circuit of the sensing material is a parallel circuit of resistor and capacitor as is shown in Fig. 6d. The ReZ–ImZ curve also verified that the impedance of the sensing layer decreases with the increase of the RH. The semicircular curve in the whole RH range demonstrates that the charge transfer is dominant over the electrical response of the sensing material towards humidity. Fig. 6b depicts the variation of phase angle with the frequency under different RHs. The phase angle of the sensor under 11% RH is always around −88° when the frequency exceeds 1000 Hz, indicating that the capacitor branch in the equivalent circuit (C1 in Fig. 6c) of the sensor is the main current path. There is hardly any conductive channel in it at this situation. For high RH of 75% to 95%, as the frequency increased, the phase angle of the sensor increased from −4° to −90°, indicating that the sensing layer tends to a resistive device at low frequency and a capacitive device at high frequency. The frequency-phase angle curve characteristics of the sensing film are in accordance with the resistor–capacitor parallel circuit shown in Fig. 6d.
The schematic diagram of the humidity sensitive mechanism was proposed based on the above measurements and analysis, which integrating ionic conduction, electron conduction and swelling phenomenon and illustrated in Fig. 7. Response in a wide humidity range is the basic requirement of humidity sensors. Considering of the response value, response range and output linearity with humidity, mass ratio of 0.16 wt% was selected as the optimal loading amount for the humidity sensing material. Last but not least, the linearity characteristic of the response to RH in wide range facilitated the sensor to be directly utilized in those read-out devices.
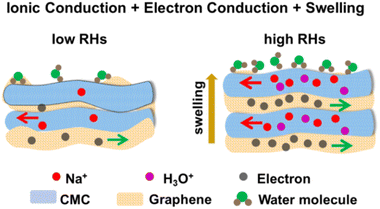 | ||
| Fig. 7 Schematic diagram of the humidity sensitive mechanism based on three factors of ionic conduction, electron conduction and swelling phenomenon. | ||
3.6 Stability and repeatability
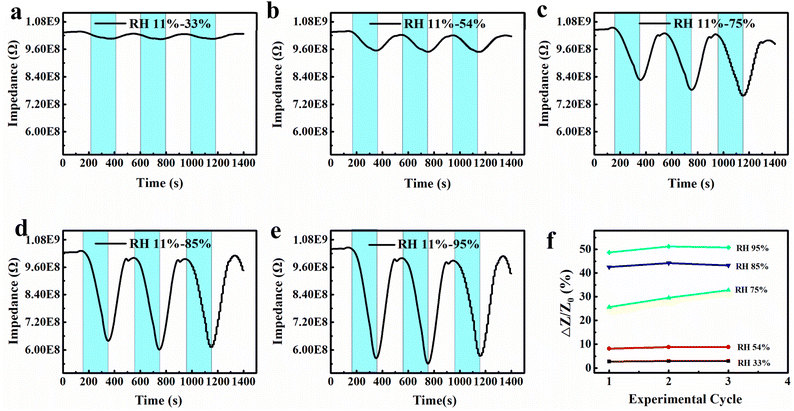
The repeatability and stability are vital properties of humidity sensors in practical applications. The sensor with 0.16 wt% graphene addition was evaluated for its stability 16 days after fabrication. The time-dependant response of the sensor to different RH levels of 33%, 54%, 75%, 85%, and 95% were monitored in consecutive 3 sensing cycles as shown in Fig. 8a–e. The sensitivity curves can be seen in Fig. S9.† The sensor displayed stable responses with the standard deviation values of 0.13, 0.31, 2.94, 0.69 and 1.09 for RH of 33%, 54%, 75%, 85% and 95%, respectively. The response curves to the same RH in different cycles are highly similar as is seen in Fig. 8f, demonstrating the good cycling behavior. It is noticed that there is a certain degree of reduction in the response value as compared with that in Fig. 4 and 5. There may need improvement in sample storage method (it is stored in air condition in the presented research) to further improve the stability of the sensor. In spite of some reduction in response, the sensor can still be applied for respiratory monitoring.3.7 Flexibility test of the humidity sensor
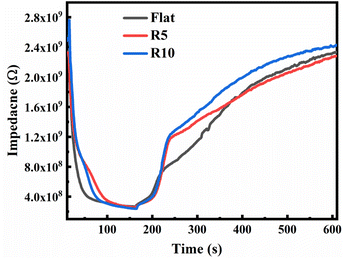
Profiting from the flexibility of the flexible sensors, they have found increasing applications in wearable devices. Accordingly, the performance stability under mechanical deformation is another basic requirement in case of deformation use. The flexibility of the sensor was tested in three different deformation state, i.e., flat, bending outward with radius curvatures of 5 mm and 10 mm. As the digital photo in Fig. S2b† shows, the sensor can be pasted directly to the 3-D printed mold. The sensor was also attached on rigid and flat substrate to ensure the flat state in other experiments. In experimental process, the sensor was transferred from RH 11% to RH 95% condition, and then returned to RH 11% bottle to realize the sudden change of RH. Fig. 9 shows that the there is no significant difference in the response speed and response value peak under different bending degrees, demonstrating the good flexibility performance of the sensor. The response curves can be seen in Fig. S10.† The experimental procedure revealed another advantage of using conductive tape as the flexible substrate: the sensor can be attached to the desired substrate for practical application.3.8 Adhesion test
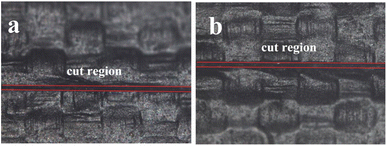
The adhesion strength of the sensitive layer on the conductive tape was evaluated using the modified ASTM tape test (D 3359-08).33 Since the size of the tape is only 5 mm in width, cuts was made in only one direction instead of X-cut or cross-cut tape test. The surface morphology of the sensitive layer before and after tape pull off were recorded by optical microscope. There is no evident detachment near the cut region before (Fig. 10a) and after tape pull off (Fig. 10b), indicating that the sensitive layer was spread on the conductive tape surface with robust adhesion strength. The rough fabric surface of the conductive tape (Fig. 1a) is beneficial to improve the adhesion strength between the sensitive layer and the substrate.343.9 Anti interference of the temperature and pressure
The air flow meter and spirometer are the main techniques for respiration monitor in hospital. Researches have proved that pressure sensor can also be used for breath monitoring.7 Since there are indeed pressure and temperature changes whether breathing with mouth or nose. Herein, a simple hair dryer blowing experiment was adopted to eliminate the possible influence of pressure and temperature on the humidity sensor. The sensor was placed in air condition for 40 s to achieve its steady state. Open the cold air gear of the hair dryer to simulate the pressure at 40 s. In the 20 s period of blowing cold air, the impedance fluctuated in the same range as the foregoing 40 s, indicating that there is no response to pressure generated by breath with mouth or nose. Convert the hair dryer to the hot air gear from 60 s to evaluate the influence of the temperature. As can be seen in Fig. 11a, there is an increase in impedance within 40 s of turning on the hot wind. Then the impedance kept stable within the same degree of fluctuation for the next 60 s. The RH around the sensor decreased under hot wind blowing, leading to the increase in impedance in the initially 40 s. Continuing to blow hot air will increase the temperature, but will not change the RH around the sensor. The stable impedance recorded within the next 60 s demonstrated that the humidity sensor is insensitive to temperature. At time of 160 s and 264 s, the sensor was moved to 95% RH and air condition. The sensor response rapidly to humidity change as Fig. 11a shows. The simple simulation experiment demonstrated that the sensor will not be disturbed by temperature or pressure when used for humidity testing. It is worth mentioning that the curves in Fig. 11a are not as smooth as the previous ones. Because no shielding cover is used during the test to unsure that the cold wind or hot wind can blow sufficiently to the sensor surface. The signals recorded fluctuate slightly within a certain range. The experimental results were sufficient to rule out the effects of pressure and temperature on the sensor performance. The operational process can be found in the video filed “Anti-interference Test” in the ESI.†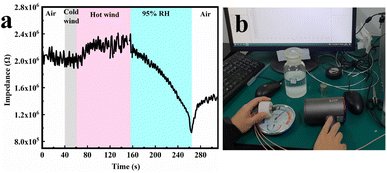 | ||
| Fig. 11 Response–recovery curve of the sensor when the hair dryer blows cold air, hot air, moved to RH of 95% and 11% (a), digital photograph of the test process (b). | ||
3.10 Application of the sensor for respiratory monitoring
To evaluate the respiration monitoring practicability, the flexible humidity sensor was placed 3 cm in front of the mouth or nose. Impedance variation was recorded at simulated respiratory states of random breath, normal breath, and deep breath. It should be pointed out that the sensor only needs to respond instantly to the change in RH rather than achieve maximum response. The impedance and responses shown in Fig. 12 and S11† reveal that the response signals can be captured whether one breathe through mouth or nose. Since the humidity of the exhaled gas through oral breathing is greater than that of nasal breathing, the response values of the oral breathing are more obvious than the latter. The human body states and different health conditions will lead to change in breath frequency and depth. Regardless of the signal strength, the human breathing frequency in different status can be obtained by calculating the number of peaks per minute from the recorded response–time curves. The oral breathing and nasal breath can be distinguished from the strength of the signal recorded. Besides, the impedance variations only attribute to high humidity of exhale air and low humidity of inhale air respectively, the inhale time and exhale time can be calculated based on the impedance signal. Dividing a breath cycle into a period of exhale and inhale would be beneficial to study the breathing rhythm block during sleep.35 The results demonstrate that the flexible humidity sensor fabricated has potential applications in personal state monitoring and diagnostic breath analysis.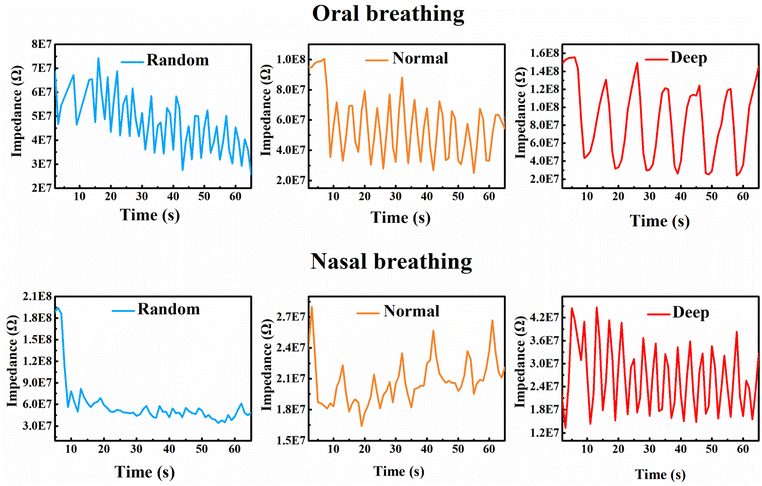 | ||
| Fig. 12 The response–recovery curves to nasal breathing and oral breathing at different respiratory conditions of random (hurried), normal and deep breath. | ||
4 Conclusions
In summary, a flexible humidity sensor with simple structure was fabricated by a facile spreading strategy using a 3-D printed groove mold. Conductive tape was applied as both of the flexible substrate and the electrode of the sensor. Carbon-based material of CMC@graphene composite was prepared by ultrasonic dispersion and assembled on the conductive tape as the sensitive layer. The sensor with 0.16 wt% addition of graphene showed the best response of 97% (ΔZ/Z0) from RH 11% to RH 95% at frequency of 100 Hz. The prepared humidity senor exhibited good long-term stability, repeatability, and flexibility. A simply-conceived hair dryer experiment eliminated the interference of pressure and temperature to humidity sensing process. The rough surface of the conductive tape endows the sensor with strong adhesion strength between the sensitive layer and the substrate. Another advantage of using conductive tape as substrate is that the sensor can be easily adhered to specific surface as needed. A rational mechanism integrating the ionic conduction, electron conduction and swelling behavior was proposed based on the response curve and the complex impedance spectra analysis. Human respiration states can be monitored by the sensor either in nasal or oral breath. Respiratory rate and breathing rhythm block can be obtained from the impedance signals recorded. The favorable combination of easy preparation, stability, flexibility, and high response performed great potential of the CMC@graphene conductive tape sensor for various humidity measurement applications, even as promising modular components in integrated intelligent wearable equipment.Author contributions
Haoxiang Wang: investigation, formal analysis, writing-original draft; Chengli Tang: methodology, project administration, writing-review & editing; Jun Xu: formal analysis.Conflicts of interest
There are no conflicts to declare.Acknowledgements
This reported work was supported by National Natural Science Foundation of China (grant number: 61704067); The Top-level Talent Project of Zhejiang Province; Public Welfare Project of Jiaxing Science and Technology Bureau (grant number: 2021AY10066).References
- Y. Lu, G. Yang, Y. Shen, H. Yang and K. Xu, Nano-Micro Lett., 2022, 14, 150 CrossRef CAS PubMed.
- D. Li and A. L. Elias, Adv. Healthcare Mater., 2020, 9, 2000380 CrossRef PubMed.
- G. Dubourg and M. Radovic, ACS Appl. Mater. Interfaces, 2019, 11, 6257–6266 CrossRef CAS PubMed.
- Z. Duan, Y. Jiang, Q. Huang, Z. Yuan, Q. Zhao and S. Wang, J. Mater. Chem. C, 2021, 9, 13659–13667 RSC.
- P. Zhu, Y. Liu, Z. Fang, Y. Kuan and Y. Zhang, Langmuir, 2019, 35, 4834–4842 CrossRef CAS PubMed.
- S. Li, Y. Zhang, X. Liang, H. Wang, H. Lu and M. Zhu, Nat. Commun., 2022, 13, 5416 CrossRef CAS PubMed.
- Y. Pang, J. Jian, T. Tu, Z. Yang, J. Lin and X. Wang, Biosens. Bioelectron., 2018, 116, 123–129 CrossRef CAS PubMed.
- L. Xu, H. Zhai, X. Chen, Y. Liu, M. Wang and Z. Liu, Chem. Eng. J., 2021, 412, 128639 CrossRef CAS.
- Z. Duan, Y. Jiang and H. Tai, J. Mater. Chem. C, 2021, 9, 14963–14980 RSC.
- Q. Zhao, Z. Yuan, Z. Duan, Y. Jiang, X. Li and Z. Li, Sens. Actuators, B, 2019, 289, 182–185 CrossRef CAS.
- A. Kumar, A. Kumar and G. D. Varma, J. Mater. Chem. C, 2021, 9, 8002–8010 RSC.
- X. Li, Z. Zhuang, D. Qi and C. Zhao, Sens. Actuators, B, 2021, 330, 129239 CrossRef CAS.
- L. Zhou, M. Wang, Z. Liu, J. Guan, T. Li and D. Zhang, Sens. Actuators, B, 2021, 344, 130219 CrossRef CAS.
- D. Zhang, Y. Cao, P. Li, J. Wu and X. Zong, Sens. Actuators, B, 2018, 365, 529–538 CrossRef.
- R. A. Shaukat, M. U. Khan, Q. M. Saqib, M. Y. Chougale, J. Kim and J. Bae, Sens. Actuators, B, 2021, 345, 130371 CrossRef CAS.
- X. Liu, D. Zhang, D. Wang, T. Li, X. Song and Z. Kang, J. Mater. Chem. A, 2021, 9, 14524–14533 RSC.
- C. Chen, X. Wang, M. Li, Y. Fan and R. Sun, Sens. Actuators, B, 2018, 255, 1569–1576 CrossRef CAS.
- Y. Kan, J. Meng, Y. Guo, X. Li and D. Gao, J. Electroanal. Chem., 2021, 895, 115423 CrossRef CAS.
- S. Kano and M. Fujii, ACS Sustainable Chem. Eng., 2018, 6, 12217–12223 CrossRef CAS.
- S. Rauf, M. T. Vijjapu, M. A. Andres, I. Gascon, O. Roubeau and M. Eddaoudi, ACS Appl. Mater. Interfaces, 2020, 12, 29999–30006 CrossRef CAS PubMed.
- J. Yu, Y. Feng, D. Sun, W. Ren, C. Shao and R. Sun, ACS Appl. Mater. Interfaces, 2022, 14, 10886–10897 CrossRef CAS PubMed.
- P. Zhu, H. Ou, Y. Kuang, L. Hao, J. Diao and G. Chen, ACS Appl. Mater. Interfaces, 2020, 12, 33229–33238 CrossRef CAS PubMed.
- Z. Duan, Y. Jiang, Q. Huang, S. Wang, Y. Wang and H. Pan, Smart Mater. Struct., 2021, 30, 055012 CrossRef CAS.
- L. Zhu, X. Li, T. Kasuga, K. Uetani and M. Nogi, J. Mater. Chem. C, 2022, 10, 3712–3719 RSC.
- S. Kundu, R. Majumder, R. Ghosh, M. Pradhan and S. Roy, J. Mater. Sci., 2019, 55, 3884–3901 CrossRef.
- D. Lei, Q. Zhang, N. Liu, T. Su, L. Wang and Z. Ren, Adv. Funct. Mater., 2021, 32, 2107330 CrossRef.
- E. T. Alonso, D. W. Shin, G. Rajan, A. I. S. Neves, S. Russo and M. F. Craciun, Adv. Sci., 2019, 6, 1802318 CrossRef PubMed.
- L. Lan, X. Le, H. Dong, J. Xie, Y. Ying and J. Ping, Biosens. Bioelectron., 2020, 165, 112360 CrossRef CAS PubMed.
- S. Mehmood, X. Zhao, M. F. Bhopal, F. U. Khan, Y. Yang and G. Wang, Appl. Surf. Sci., 2021, 554, 149595 CrossRef CAS.
- J. Zhang, K. Jia, Y. Huang, X. Liu, Q. Xua and W. Wang, Adv. Mater., 2022, 34, 2103620 CrossRef CAS PubMed.
- P. Zhu, Y. Kuang, Y. Wei, F. Li, H. Ou, F. Jiang and G. Chen, Chem. Eng. J., 2021, 404, 127105 CrossRef CAS PubMed.
- E. Jimenez-Marin, J. Moreno-Valenzuela, M. Trejo-Valdez, A. Martnez-Rivas, J. R. Vargas-Garcia and C. Torres-Torres, Opt. Express, 2019, 27, 7330–7343 CrossRef CAS PubMed.
- ASTM International, D01 Committee test methods for rating adhesion by tape test, ASTM International, West Conshohocken, PA, USA, 2017 Search PubMed.
- S. Joo and D. F. Baldwin, Nanotechnology, 2010, 21, 055204 CrossRef PubMed.
- J. Jin and E. S. Sinencio, IEEE Trans. Biomed. Circuits Syst., 2015, 9, 96–104 Search PubMed.
Footnote |
| † Electronic supplementary information (ESI) available. See DOI: https://doi.org/10.1039/d3ra05232j |
| This journal is © The Royal Society of Chemistry 2023 |

