 Open Access Article
Gadolinium doped zinc ferrite nanoarchitecture reinforced with a carbonaceous matrix: a novel hybrid material for next-generation flexible capacitors
Muhammad Aadil *a,
Anmar Ghanim Takib,
Sonia Zulfiqar
 cd,
Abdur Rahmane,
Muhammad Shahidf,
Muhammad Farooq Warsif,
Zubair Ahmad*g,
Asma A. Alothmanh and
Saikh Mohammadh
aDepartment of Chemistry, Rahim Yar Khan Campus, The Islamia University of Bahawalpur, Rahim Yar Khan, 64200, Pakistan. E-mail: Muhammad.aadil@iub.edu.pk
bDepartment of Radiology & Sonar Techniques, Al-Noor University College, Nineveh, Iraq
cDepartment of Chemistry, Faculty of Science, University of Ostrava, 30. Dubna 22, Ostrava 701 03, Czech Republic
dDepartment of Chemical and Biological Engineering, Iowa State University, Sweeney Hall, 618 Bissell Road, Ames, Iowa 50011, USA
eHefei National Laboratory for Physical Sciences and Microscale, Department of Chemistry, University of Science and Technology of China, Hefei, Anhui 230026, China
fInstitute of Chemistry, Baghdad-ul-Jadeed Campus, The Islamia University of Bahawalpur, Bahawalpur 63100, Pakistan
gSchool of Chemical Engineering, Yeungnam University, 280 Daehak-ro, Gyeongsan 38541, Republic of Korea. E-mail: zubair7157@yu.ac.kr
hDepartment of Chemistry, College of Science, King Saud University, Riyadh 11451, Saudi Arabia
First published on 21st September 2023
Abstract
Herein, nanostructured Gd-doped ZnFe2O4 (GZFO) has been synthesized via the sol–gel route and its CNT-reinforced nanohybrid was formed via an advanced ultrasonication method. The as-synthesized, hybrid electroactive materials have been supported on aluminum foil (AF) to design a flexible electrode for hybrid capacitor (HC) applications. Nanostructured material synthesis, Gd-doping, and CNT reinforcement approaches have been adopted to develop a rationally designed electrode with a high surface area, boosted electrical conductivity, and enhanced specific capacitance. Electrochemical impedance spectroscopy, galvanostatic charge/discharge, and cyclic voltammetry processes have been used to measure the electrochemical performance of the prepared ferrite material-based working electrodes in a 3M KOH solution. A nanohybrid-based working electrode (GZFO/C@AF) shows superior rate capacitive and electrochemical aptitude (specific capacitance, rate performance, and cyclic activity) than its counterpart working electrodes (ZFO@AF and GZFO@AF). The hybrid working electrode (GZFO/C@AF electrode) shows a high specific capacitance of 887 F g−1 and good retention of 94.5% for 7000 cycles (at 15 Ag−1). The maximum energy density and power density values for the GZFO/C@AF electrode are 40.025 Wh Kg−1 and 279.78 W Kg−1, respectively. Based on the findings of the electrochemical experiments, GZFO/C@AF shows promise as an electrode material for hybrid capacitors that provide energy to wearable electronic devices.
1. Introduction
In the contemporary world, population growth and pollution are both accelerating and putting more pressure on energy reserves. Human living standards are rising in the modern world, which increases energy consumption and eventually leads to a catastrophic energy crisis. Batteries, fuel cells, supercapacitors, and other energy storage technologies are employed to address the current energy dilemma. Due to their higher energy density, batteries are the most widely used energy storage technology among them, but their uses are restricted owing to their lower power density and limited cycle life. Scientists are interested in supercapacitors (SCs) because of their superior cycle life, high-rate performance, and higher power density. They are more competent than batteries, thanks to their distinctive qualities.1,2Still, there are also a few concerns with the SCs because they cannot practically replace batteries. The key issue with the SCs is their limited energy density. According to the energy density relation (E= 1/2 CV2), the energy density of a given energy storage device (ESD) depends on two factors.3 This first factor is the potential operational window (V) of the ESD, while the second factor is the specific capacitance (C) of that device.4 The potential operational window merely depends upon the nature of the electrolyte used, and it is found to be the maximum for the organic electrolytes.5 The kinetics of the electrochemical process is hindered by the organic electrolyte's high viscosity and poorer conductivity. For this reason, SC applications benefit from highly conductive inorganic electrolytes of varying concentrations (often 2–6 M).6 The second factor, specific capacitance, is determined by the working electrodes' chemical makeup, structure, particular surface, and design. The ESD's rate performance, cyclic activity, power density, and electrochemical stability are all features that improve with proper electrode selection.7 Therefore, in order to produce an ESD with integrated characteristics, there is a significant requirement to sort out a new electrode with a unique design.
Supercapacitors are further categorized as EDLCs (Electrical Double Layer Capacitors), PsCs (Pseudocapacitors), and HCs (Hybrid Capacitors) based on the electrode composition and charge storage method used.8 Although EDLCs offer several benefits, including increased power density and excellent reusability, lower energy density is one of their drawbacks. Redox-active materials (such as TMOs, TMSs, TMOHs, polymers, etc.) are often used to form the electrodes of PsCs, making them a second subclass of SCs. PsCs outperformed other SCs in terms of energy density, but they lagged in cycle reusability.9,10 If the ESD electrode is hybrid, composed of both redox-active and purely capacitive materials, then such devices are referred to as HCs. In electrochemical performance, especially in energy and power density, the HCs are superior to EDLC and PsCs. This is because both capacitive and redox-active constituents of the working electrode synergistically act to boost the overall performance of HCs.11,12
Scientists are increasingly interested in using ferrites like MFe2O4 (M may be Cu, Co, Zn, Ni, and Mn) as electrodes in pseudocapacitors owing to their large availability, cheap cost, increased chemical resistance, and temperature stability.13,14 In most cases, the charge–discharge process that lasted for an extended period of time pulverized the active material, which caused the capacitance of the ESD to minimize over time.15 Due to the ferrite material's very high thermal stability, it may be a more suitable option for use in ESD's practical applications.
The lower conductivity of the working electrode induces poor rate performance. Doping is a constructive approach that could boost the intrinsic electrical conductivity of ferrite materials. Blending the doped ferrite material with the highly conductive carbonaceous substrates not only improves the extrinsic conductivity of the resulting composite but also tunes its charge storage capacity due to the involvement of both capacitive and redox-active processes. Carbon nanotubes (CNTs) are preferable to other carbon-based materials due to their high chemical stability, mechanical strength, aspect ratio, and surface area.16 In addition, the exceptional conductivity of CNTs and their hollow shape make them well-suited for the easy transportation of both charge and mass. High stability, cheap, and facile production of nanostructured zinc ferrites encourage their use as an electrode material, yet their poor electrical conductivity restricts their use in electrochemical research. Rare earth doping in zinc ferrites and creating their nanohybrid with carbon nanotubes (CNTs) to improve electrical conductivity and supercapacitive aptitude is a positive way out of this predicament. It is possible to adjust the band gap by adding Gd as a dopant, which also has the potential to boost electrical conductivity. This allows for a quick procedure for transporting charges. The material's total capacitance and conductivity would benefit from the CNT reinforcement, although the latter would benefit more than the former.
The merits of CNTs and ferrite materials led us to choose these two components for composite formation. Doping and composite fabrication techniques have improved ferritic materials' low conductivities. Nanotechnology enhanced the active material's capacitive aptitude and surface-to-volume ratio. X-ray diffraction, scanning electron microscopy, energy dispersive X-ray spectroscopy, thermogravimetric analysis, Raman spectroscopy and Brunauer–Emmett–Teller surface area analysis were used to investigate three electroactive materials: zinc ferrite (ZFO); Gd-doped zinc ferrite (GZFO); and GZFO reinforced with CNTs (GZFO/C). The functional electrodes were produced by depositing the prepared active materials on aluminum foil (AF). Electrochemical impedance spectroscopy (EIS), cyclic voltammetry (CV), and galvanostatic charge–discharge (GCD) were used to evaluate and compare the super-capacitive activities of these three operational electrodes. All electrochemical experiments were conducted in an alkaline electrolyte (aqueous KOH) on a Gamry 5000 electrochemical workstation in half-cell configuration.
2. Experimental
2.1 Synthesis of Gd-ZnFe2O4
Gd-doped zinc ferrite NPs were successfully prepared via the sol–gel auto-combustion technique. 2.97 g of zinc nitrate (99%, Sigma Aldrich) was dissolved in an appropriate volume of pure water to prepare a 100 mL solution having a 0.1 M concentration. In parallel, iron nitrate nonahydrate (99%, Sigma Aldrich) and gadolinium(III) nitrate (99%, Sigma Aldrich) were also dissolved in water in separate beakers to form their 0.1 M solutions. Almost 95 mL of the iron nitrate solution, 50 mL of the zinc nitrate solution, and 5 mL of the gadolinium nitrate solution were taken and mixed via continuous stirring. As a chelating agent, the appropriate concentration of citric acid (C6H10O8) was added to the abovementioned solution to trigger the gel formation process. The cloudy reaction mixture was magnetically stirred and slowly heated to 85 °C. As the citric acid addition turned the solution medium acidic, an appropriate volume of ammonia solution was added to keep the pH of the solution around 7. The heating and ammonia addition processes convert the solution mixture into a more viscous gel. The obtained viscous gel was heated at about 100–110 °C, which yielded gray ash. The ashes were ground and then sintered at 800 °C in the muffle furnace for 6 h at 5 °C min−1 to afford Gd-doped zinc ferrite (GZFO). A similar methodology was adopted for synthesizing undoped zinc ferrite except for the use of gadolinium nitrate. For simplicity, the zinc nitrate material is abbreviated as ZFO.2.2 Synthesis of Gd-ZnFe2O4/CNTs nanocomposite
The GZFO nanopowder and CNTs were mixed in 8![[thin space (1/6-em)]](https://www.rsc.org/images/entities/char_2009.gif) :
:![[thin space (1/6-em)]](https://www.rsc.org/images/entities/char_2009.gif) 2 ratio in sterile water in order to create a composite. To facilitate interaction between GZFO nanopowder and CNTs, the dispersion was sonicated for 4 h to exfoliate the CNTs. CNT-reinforced Gd-doped zinc ferrite nanocomposite was obtained by gently evaporating the mixture at 90 °C to afford the GZFO/C material.
2 ratio in sterile water in order to create a composite. To facilitate interaction between GZFO nanopowder and CNTs, the dispersion was sonicated for 4 h to exfoliate the CNTs. CNT-reinforced Gd-doped zinc ferrite nanocomposite was obtained by gently evaporating the mixture at 90 °C to afford the GZFO/C material.
2.3 Electrochemical tests
A similar procedure was used for fabricating three working electrodes for ZFO, GZFO, and GZFO/C. In particular, an Al foil (2 cm × 1 cm) as a current collector and a Nafion slurry with active material were employed as an active depositing material. The active substance was delivered in a thin layer over the aluminum foil via a glass rod and the electrochemical performance of all electrodes was investigated. In the 3M KOH electrolyte solution, three-electrode systems were deployed:• A working electrode (ZFO@AF, GZFO@AF, and GZFO/C@AF)
• An auxiliary electrode (Pt wire)
• A reference electrode (Hg/HgO)
To explore the electrochemical characteristics of all the electrodes and estimate the specific capacitance, cyclic voltammetry (CV) and galvanostatic charge–discharge (GCD) experiments were performed at various scan rates and current densities. Electrochemical impedance spectroscopy (EIS) was used in the frequency range of 5 MHz to 10 mHz at open circuit voltage with a sinusoidal signal of 10 mV to evaluate the samples' electrochemical conductivity.
2.4 Characterization
X-ray diffraction (PXRD) was used to investigate the structural characteristics of the as-synthesized bare, doped, and hybrid materials using a monochromatic Cu-Kα source (Rigaku MiniFlex 300). The chemical bonds and structures of the produced materials were investigated using Raman spectroscopy (Renishaw inVia). The surface morphology of the electrode materials was analyzed using a JOEL-JSM-6490LA scanning electron microscope (SEM). A thermal gravimetric analysis (TGA) was performed on SDT 650 to investigate the hybrid sample's thermal characteristics. The produced samples were analyzed using Micrometrics ASAP 2020 Physisorption Analyzer and I–V (6487 picoammeter) testing to determine their surface area and conductivity.3. Results and discussion
3.1 Structural analysis
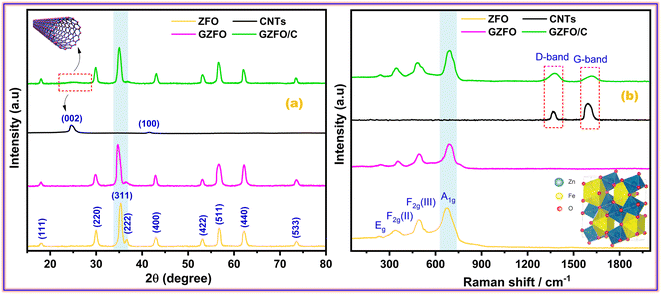
Fig. 1a presents the powder X-ray diffraction (PXRD) profiles of nanomaterials ZFO, GZFO, and GZFO/C, displaying a distinct nine-Bragg reflections. Using Xpert High Score Plus software, the ZFO nanomaterial was indexed, and the results were in full accord with JCPDS-82-1042, indicating the presence of simple spinel ferrite.17Index (311) was assigned to the most robust Bragg reflection, corresponding to the Fd3m space group.18 Even a single irrelevant Bragg reflection was not observed, confirming the formation of a single-phase nanoferrite sample.19 The broadening of the most intense peak was observed for GZFO nanomaterials. The β (FWHM) for ZFO and GZFO nanomaterials was computed by analyzing the most intense peak, which was found to be 0.64 and 0.75, respectively. Based on peak position and associated broadening, the grain size was also computed using the Scherrer relation  20–22 The grain size of the ZFO nanomaterial dropped from 13.6 nm to 11.6 nm after Gd doping. The surface area of ZFO and GZFO nanomaterials was determined using eqn (1) and the findings are shown in Table 1.
 | (1) |
| Sample | 2θ/β | d-spacing/lattice constant (Å) | Volume (Å3) | Grain size (nm) | Surface area (m2 g−1) |
|---|---|---|---|---|---|
| ZFO | 35.3°/0.64 | 2.54/8.46 | 605.6 | 13.6 | 76.3 |
| GZFO | 34.8°/0.75 | 2.57/8.48 | 609.8 | 11.6 | 94.5 |
The surface area is impacted by the degree to which grain boundaries are broken down. A surface area of 76.3 m2 g−1 was calculated for ZFO nanomaterials with a grain size of 13.6 nm, whereas a surface area of 94.5 m2 g−1 was calculated for GZFO nanomaterials with a grain size of 11.6 nm. After Gd doping, XRD of GZFO showed not only peak widening but also a small peak displacement toward a lower angle. According to Bragg's law,23 the shifting of peak is indicative of a modification to the d-spacing. The reflection position and relevant indexing data were used (Cell software) to compute the lattice constant (a), d-spacing, and volume for the ZFO and GZFO nanocatalysts' unit cells (Table 1).
Since the ionic radius of Gd (0.938 Å) is much greater than that of iron (0.645 Å), Fe substitution with Gd at octahedral sites may account for the observed rise in lattice constant from 8.46 to 8.48 for the GZFO nanomaterial.24 The presence of these strong diffraction peaks in the PXRD pattern is indicative of the crystalline nature of the ZFO and GZFO nanomaterials. Additionally, the lack of any additional peaks belonging to any impurity phase, even after Gd doping, further demonstrates the phase purity of the nanomaterials that were produced.25 The X-ray diffraction pattern of carbon nanotubes (CNTs) displays two distinct peaks at 2θ values of 25.4° and 42.2°.
These peaks may be attributed to the diffraction occurring from the (002) and (100) planes of the CNTs, respectively, as reported in the scientific literature.26 The GZFO/C nanomaterial's Bragg reflection is almost similar to that of the GZFO nanomaterial except for an additional weakly intense hump around 2θ = 25°, which could be attributed to the CNT's existence in the composite sample.27,28 Eqn (2) and (3) were used to determine the % crystallinity and % porosity of the ZFO and GZFO nanomaterials.29,30
 | (2) |
 | (3) |
Raman spectroscopy is the most suitable technique to determine the phonon modes of spinel ferrites and to explore the structure of carbonaceous materials such as activated carbon, graphene, CNT, etc. Space group theory (SGT) proposed 39 modes of vibration for spinel ferrite that are A1g, Eg, and 3 F2g, all of which are Raman active.31 The symbols A, E, and T represent the one, two, and three-dimensional modes of vibration for phonons, respectively. The letter 'g' indicates the presence of a center of inversion symmetry.32 A1g is a high-frequency mode (above 600 cm−1) and is related to the symmetric bending of the M–O bond in the tetrahedral MO4 group. Eg and 3 F2g [F2g (I), F2g (II), and F2g (III)] are lower or moderate frequency modes that are attributed to the different types of M–O bond movements at octahedral MO6 sites. The Eg mode (278–293 cm−1) is allocated to the symmetric bending of the M–O bond. F2g (II) mode (449–471 cm−1) ascribes to the asymmetric stretching and F2g (III) mode (539–565 cm−1) to the asymmetric bending, while these two modes also ascribe to the M–O vibration at MO6 sites. The F2g (I) mode is rarely seen and has the lowest frequency (165–177 cm−1). As shown in Fig. 1b, the Raman spectra of ZFO, GZFO, and GZFO/C samples possess the major phonon modes of spinel ferrite.33 The M–O motion of oxygen atoms in tetrahedral MO4 sites is believed to induce phonon modes with frequencies of over 600 cm−1, while the M–O motion of oxygen atoms in octahedral MO6 sites is believed to induce phonon modes with frequencies below 600 cm−1. For GZFO, all expected spinel-ferrite phonon modes show a shift toward the higher frequency. This shifting ascribes to the induction of the micro-strain in the ZFO crystal after the Gd3+ substitution that is larger than that of the two host metal (Fe/Zn) cations. The Raman spectra of carbon nanotubes (CNTs) exhibit two discernible peaks at 1361 cm−1 and 1592 cm−1, denoted as the D-band and G-band, respectively, as reported in the scientific literature.34 The GZFO/C sample spectra, apart from the characteristic spinel ferrite phonon modes, also possess two additional, weaker but broader bands in the higher frequency region. The first band at 1376 cm−1 is indexed as D-band as it refers to the degree of deformation, while the second band at 1610 cm−1 is indexed as G-band as it indicates the existence of graphitic structure. Both of these bands were observed due to CNTs. The presence of the spinel ferrites phonon along with the D-band and G-band indicates the successful formation of the GZFO composite with CNTs.
3.2 SEM and EDX analysis
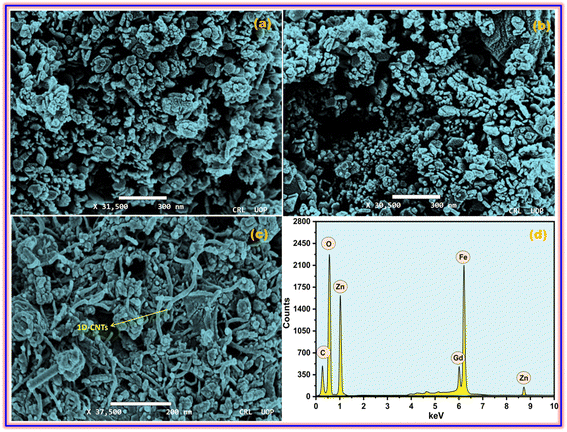
The microscopic architectures of the synthesized ZFO, GZFO, and GZFO/C materials were also investigated using SEM. The ZFO sample electronic image at 31![[thin space (1/6-em)]](https://www.rsc.org/images/entities/char_2009.gif) 500 magnification, presented in Fig. 2a, shows that sample particle size and morphology are not uniform. The average particle size is 45.7 nm, but most of the particles are in non-dispersed form, so the actual morphology is unclear. However, a few isolated particles with irregular outer boundaries could also be observed in the ZFO nanomaterial. The doped ferrite (GZFO) electronic image at 30
500 magnification, presented in Fig. 2a, shows that sample particle size and morphology are not uniform. The average particle size is 45.7 nm, but most of the particles are in non-dispersed form, so the actual morphology is unclear. However, a few isolated particles with irregular outer boundaries could also be observed in the ZFO nanomaterial. The doped ferrite (GZFO) electronic image at 30![[thin space (1/6-em)]](https://www.rsc.org/images/entities/char_2009.gif) 500 magnification (Fig. 2b) reveals that its particle morphology is almost similar to that of ZFO nanomaterial; however, its particles are more dispersed and relatively smaller in size (36.4 nm). Such features are favorable for energy storage applications, as the greater the exposed surface area, the greater the electroactive sites for charge storage.
500 magnification (Fig. 2b) reveals that its particle morphology is almost similar to that of ZFO nanomaterial; however, its particles are more dispersed and relatively smaller in size (36.4 nm). Such features are favorable for energy storage applications, as the greater the exposed surface area, the greater the electroactive sites for charge storage.
The GZFO/C nanomaterial electronic image at 37![[thin space (1/6-em)]](https://www.rsc.org/images/entities/char_2009.gif) 500 magnification (Fig. 2c) gives a more precise idea regarding the morphology of the GZFO sample particles. Moreover, the GZFO nanoparticles get exfoliated during the composite formation. Hence, no cluster of nanoparticles was found to be visible. The 1D CNTs can be seen in the GZFO/C electronic image; therefore, composite formation is verified. The CNTs are evenly dispersed among the GZFO nanoparticles; such association will boost the extrinsic conductivity of the resultant composites.
500 magnification (Fig. 2c) gives a more precise idea regarding the morphology of the GZFO sample particles. Moreover, the GZFO nanoparticles get exfoliated during the composite formation. Hence, no cluster of nanoparticles was found to be visible. The 1D CNTs can be seen in the GZFO/C electronic image; therefore, composite formation is verified. The CNTs are evenly dispersed among the GZFO nanoparticles; such association will boost the extrinsic conductivity of the resultant composites.
The EDX of the GZFO/C nanocomposite, given in Fig. 2d is composed of six elemental peaks that emerged due to the de-excitation of electrons in different elements. The peaks at 1.1 keV, 8.8 keV, 0.52 keV,35 and 6.4 keV ascribe to the electronic de-excitation in Zn (Lα), Zn (Kα), oxygen, and iron elements, respectively. Relatively, a weak peak at 6.0 keV is attributed to the electronic de-excitation in the Gd dopant. As CNTs are chiefly composed of carbon peaks, the peak at 0.28 keV is for the carbon content in the nanocomposite sample. EDX confirms the existence of the expected elements and does not show any peaks associated with undesired elements, confirming the formation of a highly pure nanocomposite with the desired composition.
3.3 TGA and I–V analysis
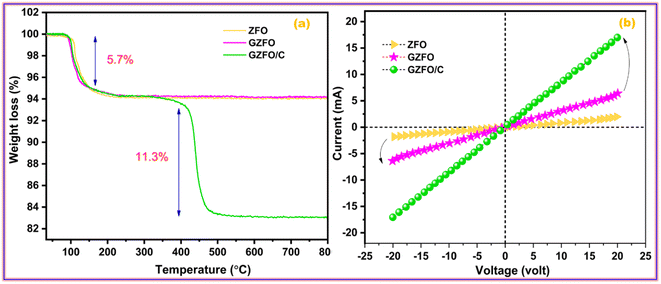
The thermogravimetric measurement also revealed the nanomaterial's' thermal stability, water moieties fraction, and additive matrix fraction as synthesized from ferrite. Fig. 3a presents the TGA profile of ZFO, GZFO, and GZFO/C nanomaterials. Around 100 °C, a weight loss of almost 5.7% was observed for all three ferrite-based nanomaterials. This weight loss refers to the removal of water moiety from the powdered samples. After this, the weight loss curve for ZFO and GZFO nanomaterials becomes almost parallel to the x-axis, showing no further loss up to 800 °C. This behavior shows the excellent thermal stability of ZFO and GZFO nanomaterials. However, the GZFO/C nanocomposite TGA curve shows an additional weight loss of almost 11.3% around 400 °C. According to the literature, this weight loss could be attributed to burning carbonaceous contents (CNTs) in the nanocomposite sample. The weight loss in this region also gives direct information regarding the percentage of the carbonaceous additive present in the nanocomposite sample.Evidence of the anticipated conductivity enhancement was gathered via current–voltage measurements as we employed the Gd-doping and CNTs addition techniques to improve the intrinsic and extrinsic conductivity of the ZFO nanomaterial. The I–V graphs in Fig. 3b illustrate the current response of ZFO, GZFO, and GZFO/C nanomaterials between −20 and +20 V. The qualitative information regarding the conductance of ZFO, GZFO, and GZFO/C nanomaterials is indicated by the slope value of the I–V plot.36 Slope value increase in case of GZFO/C nanomaterial after CNTs addition is greater than for the Gd-doped sample, indicating that extrinsic conductivity contributes more than intrinsic conductivity toward the overall conductivity enhancement. For comparison purposes, the conductance (C) of ZFO, GZFO, and GZFO/C nanomaterials is converted to their specific conductivity (σ) using the eqn (4).37
 | (4) |
The terms “w” and “A” in this context relate, respectively, to the thickness and area of the ferrite sample pellet being discussed. When compared to ZFO nanomaterial (6.8 × 10⁻⁶ Sm−1) and GZFO nanomaterial (3.6 × 10⁻⁵ Sm−1), it was found that CZFO/C nanocomposite had the highest specific conductivity (5.6 × 10⁻³ Sm−1). The I–V analysis indicated that the GZFO/C nanocomposite material is the most conductive and suitable for electrochemical applications.
3.4 BET analysis
Electroactive materials with a large surface area provide more potential sites for physical or redox-based charge storage. Fig. 4a presents the nitrogen adsorption–desorption isotherms for GZFO/C nanocomposite.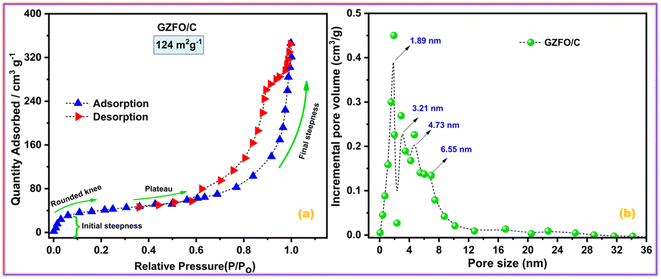 | ||
| Fig. 4 (a) Nitrogen adsorption–desorption isotherms and (b) pore size distribution of GZFO/C nanomaterials. | ||
The adsorption isotherm is divided into four distinct parts. Micropore filling is attributed to the initial steepness in the adsorption curve at low relative pressure, whereas the rounded knee at 0.1 P/Po represents monolayer creation. The plateau region (0.4–0.6 P/Po) and almost vertical curve (at higher partial pressure) show multilayer formation and capillary condensation processes, respectively. Type II adsorption isotherm with H3 hysteresis indicates the presence of micro-sized pores with a slit-like shape in the GZFO/C material. The nanohybrid composite has a high BET surface area (124 m2 g−1), indicating that it has great potential to store higher charges at the surface. In the GZFO/C material's pore size distribution plot, given in Fig. 4b, pore sizes of variable size ranging from 1.89 nm to 6.55 nm are present in the sample. The pores in the GZFO/C fall into the microporous and mesoporous categories, as defined by the International Union of Pure and Applied Chemistry (IUPAC).
3.5 Electrochemical tests
The electrochemical nature of the prepared material, including the potential working window, electrical conductivity, electrochemical reversibility, nature of the dominant charge storage mechanism, and contribution of each involved charge storage mechanism, can be assessed through cyclic voltammetry (CV).38 All prepared ferrite-based electroactive materials were deposited onto the aluminum foil (AF), a current collector, to develop the working electrodes. The CV profiles of pristine aluminum foil (AF) ZFO@AF, GZFO@AF, and GZFO/C@AF working electrodes have been recorded at 10 mV s−1 within the potential range (0.0 V to 0.6 V) vs. Hg/HgO, as given in Fig. 5a. The more flattened CV profile of pure aluminum foil (AF) demonstrates the negligible role of AF in the total specific capacitance of working electrodes (where the area under the CV loop is proportional to the specific capacitance of the particular working electrode).28 The ZFO@AF electrode's CV profiles were recorded at six increasing scan rates (between 1 and 100 mV s−1) and shown in Fig. 5b. The CV profiles enclosed a minor area at 1 mV s−1, which gradually increased with increasing the scan rate to 100 mV s−1. All of the ZFO@AF electrode CV profiles are non-rectangular, with a redox peak suggesting the dominance of the faradaic charge storage mechanism, which could be explained via the eqn (5) and (6).| ZnFe2O4 + H2O + OH− ↔ 2FeOOH + e− + ZnOOH | (5) |
| FeOOH + OH− ↔ FeO2 + e− + H2O | (6) |
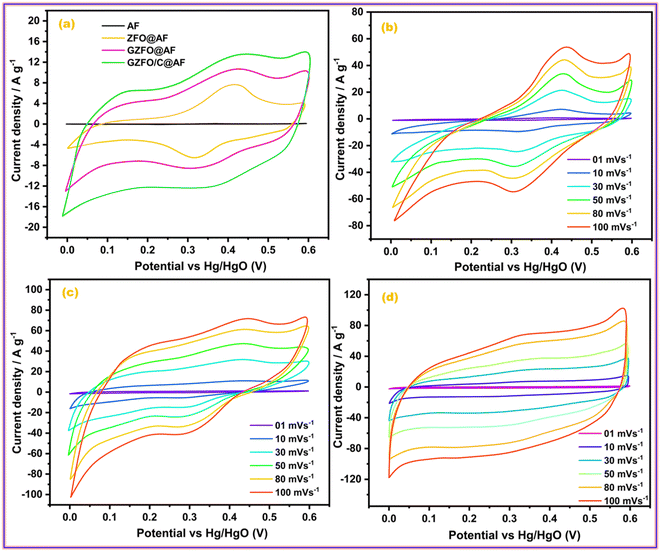 | ||
| Fig. 5 (a) Comparative CV profiles of all working electrode; CV profiles of (b) ZFO@AF, (c) GZFO@AF, and (d) GZFO/C@AF electrodes. | ||
In addition, the inferior electrochemical aptitude of the ZFO@AF electrode is reflected in its CV profile, which exhibits non-vertical behavior at the edging potential (0 V and 0.6 V) and lacks mirror symmetry along the zero current density line.36 When comparing CV profiles obtained at the same scan rate, the GZFO@AF electrode CV profiles (Fig. 5c) are wider and have greater current density values along the Y-axis than the ZFO@AF electrode CV profiles. Even in their diffused form, the redox peaks persist, demonstrating that the faradaic redox mechanism remains dominant in the GZFO@AF electrode. In fact, Gd doping increases electrical conductivity and surface area, both of which contribute to enhanced electrochemical performance.
The CV profiles of the GZFO/C@AF electrode (Fig. 5d) are even more wider than those of the other two electrodes; they are rectangular with diffused redox peaks, symmetrical at zero current density, and almost vertical at the edging potential. The GZFO/C@AF electrode has these characteristics due to its high specific capacitance, hybrid makeup, favorable electrochemical reversibility, and exceptional electrical conductivity. The overall charge storage is supported by both the faradaic redox process (doped ferrite) and the electric double-layer mechanism (CNTs), as seen by the rectangular CV profiles with faint and dispersed redox peaks. The synergistic impact of Gd doping and CNT reinforcement in the zinc ferrite made GZFO/C@AF stand out among the other working electrodes produced with extraordinary potential for supercapacitor application. The modified power law relation (eqn (7)) could determine whether the GZFO/C@AF electrode relies on a surface-controlled process, like that of conventional capacitors, or a diffusion-controlled process, like that of batteries.39
log![[thin space (1/6-em)]](https://www.rsc.org/images/entities/char_2009.gif) i = log i = log![[thin space (1/6-em)]](https://www.rsc.org/images/entities/char_2009.gif) a + b a + b![[thin space (1/6-em)]](https://www.rsc.org/images/entities/char_2009.gif) log log![[thin space (1/6-em)]](https://www.rsc.org/images/entities/char_2009.gif) v v
| (7) |
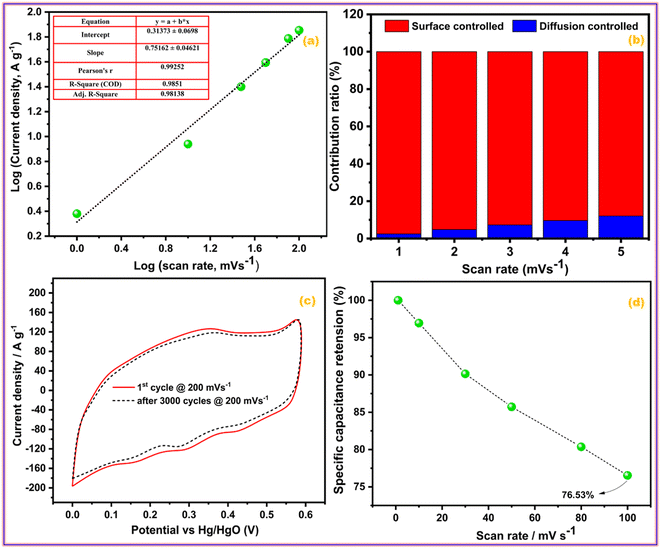 | ||
| Fig. 6 (a) Power law, (b) percentage contribution, (c) cyclic activity, and (d) rate activity of GZFO/C@AF electrode. | ||
Additionally, the percentage contribution of each charge storage mechanism to the overall specific capacitance of the GZFO/C@AF electrode was calculated using the well-known relationship (eqn (8)) for scan rates of 1, 2, 3, 4, and 5 mV s−1.
 | (8) |
Eqn (8) is also a linear equation; therefore, the graph between x and y is fitted to determine the slope (k1) and intercept (k2). At a certain scan rate, the percentage contribution of the surface-controlled process can be calculated by multiplying k1 with the scan rate (v), while the percentage contribution of the diffusion-controlled process can be calculated by multiplying k2 with the square root of the scan rate (v1/2). These calculations have been performed, and the findings are summarized in Fig. 6b. The percentage contribution of the surface-controlled charge storage process is significantly greater than that of the diffusion-controlled process at all scan rates. Since the electroactive sample is deposited as a thin layer on the AF, the likelihood of bulk phenomena (diffusion-controlled processes) is minimal.
Cyclic stability is one of the most important characteristics of energy storage devices; thus, the influence of cyclic experiments on the area of the CV profiles of the GZFO/C@AF electrode was investigated. Fig. 6c depicts the GZFO/C@AF electrode CV profiles recorded at 200 mV s−1 for the 1st and 3000 cycles. A very small decrease in the CV area after 3000 cyclic experiments indicates the maximal retention of charge storage properties, which suggests an unusual cyclic activity of the GZFO/C@AF electrode.
The rate performance of an energy storage device demonstrates its robustness by measuring and comparing charge storage activities at lower and higher scan rates. As the scan rate increases, less specific capacitance is achieved since the bulk of the electrode is no longer involved in the charge storage process, and the capacitance decreases. The same trend is seen with the GZFO/C@AF electrode (Fig. 6d). When we increase the applied scan rate from 1 mV s−1 to 100 mV s−1, however, the capacitance drop is just 23.47%, demonstrating the outstanding rate performance of our GZFO/C@AF electrode.
The galvanostatic charge–discharge (GCD) test is preferred over cyclic voltammetry for determining the working electrode's specific capacitance, cyclic activity, and rate performance. Fig. 7a shows the galvanostatic charge–discharge (GCD) profiles of ZFO@AF, GZFO@AF, and GZFO/C@AF working electrodes at 1 Ag−1 in the stable potential window (0.0 to 0.57 V). Nonlinear charge–discharge behavior for ZFO@AF and GZFO@AF electrodes is attributed to redox reaction contributions consistent with the CV data.
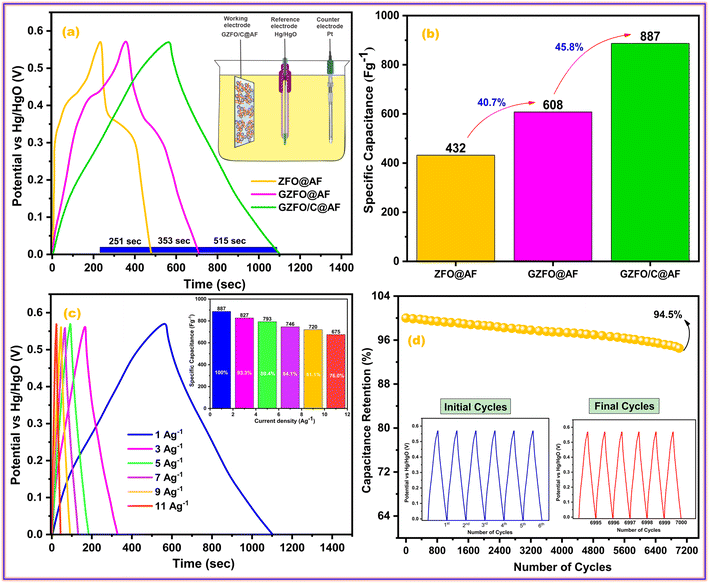 | ||
| Fig. 7 (a) Comparative GCD profiles of all working electrodes and (b) their specific capacitance; (c) GCD profiles of GZFO/C@AF electrode at different current densities and its (d) cyclic activity. | ||
The IR drop at the very start of the discharge cycle indicates the material's inherent or extrinsic resistivity. Gd doping and CNT reinforcement increase the specific conductivity of the GZFO@AF and GZFO/C@AF electrodes, as shown by a reduction in the IR drop.41 The GZFO/C@AF GCD profile is almost linear, with practically no IR drop, implying improved capacitive behavior and electrical conductivity owing to Gd doping and CNT reinforcement. According to the GCD results, the discharge time for the doped sample is higher than that of the undoped sample, and the discharge time for the electrode based on the composite sample is the highest. This means the doped sample possesses a higher specific capacitance than the undoped sample, while the composite sample possesses an even higher specific capacitance than that of both doped and undoped counterparts. The specific capacitance for ZFO@AF, GZFO@AF, and GZFO/C@AF electrodes at 1 Ag−1 were computed using their discharge time values (eqn (9)).42
| Csp = IΔt/m | (9) |
At 1 Ag−1, the GZFO/C@AF electrode's capacitance value is up to 887, which is much better than ZFO@AF (432 F g−1) and GZFO@AF (608 F g−1). The statistical relationship among the individual capacitances of the three active electrodes is shown in Fig. 7b. The specific capacitance is nearly 40.7% greater for the doped sample than the undoped, and it is 45.8% greater for the composite sample than the doped. The GCD profiles at 1, 3, 5, 7, 9, and 11 Ag−1 (Fig. 7c) have been acquired to test the rate performance of the GZFO/C@AF electrode. The specific capacitance values at various current densities have been calculated and are shown as a column graph in the inset of Fig. 7c. For an 11% increase in applied current density, the GZFO/C@AF electrode maintained 76% of its original capacitance while losing just 24% of its specific capacitance. This demonstrates the working electrode's high-rate capacity thanks to Gd doping and CNT reinforcement.
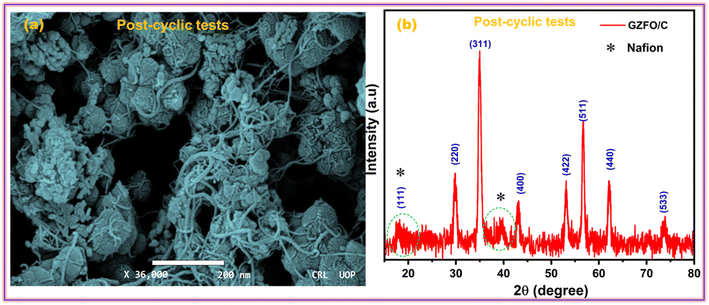
The ability of a supercapacitor to retain its initial charge after being repeatedly discharged and recharged is referred to as its “cyclic stability.” The GZFO/C@AF electrode's long-term cycling stability was studied by passing it through 7000 GCD cycles at 15 Ag−1 (Fig. 7d). Our hybrid material-based electrode has a remarkable cyclic stability of 94.5% even after 7000 GCD cycles observed at 15 Ag−1, thanks to its porous structure and decreased bulk contribution. The morphological and structural stability of the GZFO/C after cyclic tests were examined, respectively, through SEM and PXRD analysis. The SEM micrograph of GZFO/C after cyclic tests (Fig. 8a) shows that GZFO/C NPs are entangled with CNTs.
A slight increase in the particle volume is observed, possibly due to the repeated percolation of electrolyte ions in the bulk of GZFO NPs. The PXRD of the GZFO/C after cyclic tests (Fig. 8b) shows that the main diffraction peaks of the GZFO/C material are present, reflecting the composite material's exceptional structure stability during the cyclic tests. Two peaks were additionally observed: one at 2θ = 18.4, which diffused with the GZFO peaks, and the second relatively broader at 2θ = 39.5°. These peaks may be observed due to the Nafion binder blended with the electroactive material during the electrode preparation.43
The energy density (E) and power density (P) for the GZFO/C@AF electrode have been computed using eqn (10) and (11).
 | (10) |
 | (11) |
The calculated energy density for the GZFO/C@AF electrode is 40.025 Wh Kg−1, and the power density is 279.78 W kg−1. Our newly designed working electrode exhibits capacitive behavior, as shown by its greater power density than energy density.
Impedance spectroscopy is a very robust technique that deals with different types of impediments (resistances, inductance, and capacitance) offered by the working electrode to the applied alternating current. A Nyquist plot of ZFO@AF, GZFO@AF, and GZFO/C@AF electrodes is obtained by plotting the sum of inductance and capacitance (imaginary components) vs. resistance (real components). A simple Nyquist plot comprise of three subsections that specify different resistances; the details are as follows:44,45
1. The position of the X-intercept at the higher frequency gives the value of the equivalent series resistance (Res), which is the sum of (i) solution resistance, (ii) intrinsic resistance of the electrode material, and (iii) contact resistance at the active material and current collector. The Res value increases with the distance of the intercept.
2. The height and width of the semi-circular curve give the value of charge transport resistance (Rct), that is, the resistance charges phased during their transport from the liquid phase (electrolyte) to the solid phase (electrode material). The larger the semicircle (height and width), the greater the Rct value.
3. The angle, a straight line at the lower frequency form with the real axis, gives the mass transport resistance and capacitance values. As the angle increases, mass transport decreases and capacitance increases.
Fig. 9a demonstrates that the GZFO/C@AF electrode has a lower Res than the ZFO@AF and GZFO@AF electrodes due to the Nyquist curve's intercept being closer to the origin. Since the charge transport process is facilitated at the electrode–electrolyte interface of GZFO@AF and GZFO/C@AF electrodes, the breadth and height of the Nyquist semicircle are both considerably lowered with Gd doping and subsequent CNT reinforcement. For ZFO@AF, GZFO@AF, and GZFO/C@AF electrodes, the straight line angle with the real axis is 43°, 57.8°, and 76.3°, respectively. Here, our GZFO/C@AF electrode gives 76.3, which shows that it has much better capacitance than the ZFO@AF and GZFO@AF electrodes since the ideal capacitance angle is 90. Through circuit fitting, qualitative data on the impedance values of ZFO@AF, GZFO/C@AF, and GZFO/C@AF electrodes were converted into quantitative data. Fig. 9b is a bar chart displaying the results of the circuit fitting, which was performed with the help of the EC-lab software. The synergistic effect of Gd doping and CNT reinforcement reduced the Res resistance value from 23.4 ohms to 11 ohms and the Rct value from 101 ohms to 40 ohms. Impedance research, following in the footsteps of CV and GCD, suggests that the GZFO/C@AF electrode is the best-synthesized electrode for supercapacitor applications. The capacitive aptitude of our newly designed working electrode has been compared with that of closely related working electrodes in Table 2. The exceptional electrochemical performance of the hybrid material may be attributed to the combined impact of the two strategies used:
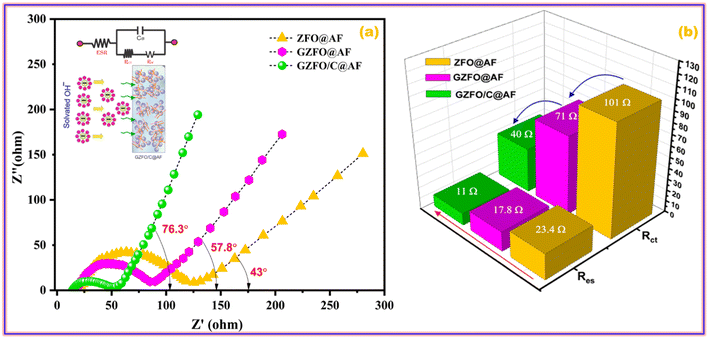 | ||
| Fig. 9 (a) EIS curves of ZFO@AF, GZFO@AF, and GZFO/C@AF electrodes and (b) column graph showing their resistances values. | ||
| Supercapacitive electrode | Current density (Ag−1)/Capacitance (Fg−1) | Rate activity (%) | Cyclic activity (%)/cycles | Ref. |
|---|---|---|---|---|
| ZnFe2O4/rGO | 1/1419 | 93 (5 Ag−1) | 93/5000 | 46 |
| ZnFe2O4/NRG | 5/244 | 53 (10 Ag−1) | 83.8/5000 | 47 |
| ZnFe2O4@PPy | 1/1598 | 69(20 Ag−1) | 90.3/5000 | 48 |
| ZnFe2O4@MWCNT | 1/609 | 33(5 Ag−1) | 91/10![[thin space (1/6-em)]](https://www.rsc.org/images/entities/char_2009.gif) 000 000 |
49 |
| ZnFe2O4@rGO | 1/628 | 24(10 Ag−1) | 89/2500 | 50 |
| ZnFe2O4/Gr | 5/270 | 20(20 Ag−1) | 98/5000 | 51 |
| ZnFe2O4/NiCo | 2/1162 | 91(10 Ag−1) | 88/5000 | 52 |
| Gd-ZnFe2O4/C | 1/887 | 76(11 Ag−1) | 94.5/7000 | Current work |
1. Electrode material has been synthesized at the nanoscale to improve the surface area, as materials with a larger surface area possess a greater number of electroactive sites, resulting in enhanced electrochemical activities.
2. Doped ferrite has been reinforced with CNTs, a conductive and capacitive matrix, to form the nanohybrid. CNTs, being a capacitive and conductive carbonaceous matrix, boost the extrinsic conductivity as well as the specific capacitance of the nanohybrid.
4. Conclusions
In brief, three materials, namely zinc ferrite (ZFO), Gd-doped zinc ferrite (GZFO), and CNT-reinforced Gd-doped zinc ferrite (GZFO/C) with nanostructured morphologies, have been synthesized via sol–gel and advanced ultrasonication processes. All synthesized materials were characterized through PXRD and Raman techniques to confirm the formation of single-phase spinel ferrite, Gd-doping, and CNT reinforcement. The nanostructured morphology and exact chemical composition were determined via SEM and EDX analysis. The percentage of CNTs in the nanohybrid sample was determined through TGA analysis. The effect of Gd-doping in zinc ferrite and the addition of CNT matrix on the enhancement of electrical conductivity were tested through I–V tests. All synthesized ferrite-based materials were decorated on aluminum foil (AF) to get the working electrode, and then their supercapacitive aptitude was tested and compared using well-known electrochemical techniques (EIS, GCD, and CV). The nanohybrid-based working electrode showed superior supercapacitive aptitude (cyclic performance, rate activity, and specific capacitance) than its counterpart electrode. The hybrid working electrode (GZFO/C@AF electrode) shows a high specific capacitance of 887 Fg−1 (at 1 Ag−1) and good retention of 94.5% for 7000 cycles (at 15 Ag−1). The maximum energy density and power density values for the GZFO/C@AF electrode are 40.025 Wh Kg−1 and 279.78 W Kg−1, respectively. The findings of the electrochemical investigations point to the possibility that GZFO/C@AF might be an effective electrode material for hybrid capacitors, a power source for the future generation's wearable electronics.Conflicts of interest
There are no conflicts to declare.Acknowledgements
This work was funded by the Researchers Supporting Project Number (RSP2023R243) King Saud University, Riyadh, Saudi Arabia. The authors from the Department of Chemistry, Rahim Yar Khan Campus, and Institute of Chemistry, BJ Campus, of the Islamia University of Bahawalpur are thankful for their respective universities and the Higher Education Commission, Islamabad, Pakistan. Prof. Dr Sonia Zulfiqar is highly thankful for the support provided by the Statutory City of Ostrava, Czechia through Research Grant “Global Experts”.References
- P. S. Kumar, P. Prakash, A. Srinivasan and C. Karuppiah, J. Power Sources, 2021, 482, 228892 CrossRef.
- Y. Wen, X. Liu, X. Wen, X. Chen, K. Szymańska, R. Dobrzyńska and E. Mijowska, Composites, Part B, 2020, 199, 108256 CrossRef CAS.
- Z. Pan, J. Yang, Q. Zhang, M. Liu, Y. Hu, Z. Kou, N. Liu, X. Yang, X. Ding and H. Chen, Adv. Energy Mater., 2019, 9, 1802753 CrossRef.
- T. Kshetri, D. D. Khumujam, T. I. Singh, Y. S. Lee, N. H. Kim and J. H. Lee, Chem. Eng. J., 2022, 437, 135338 CrossRef CAS.
- T. Bhat, P. Patil and R. Rakhi, J. Energy Storage, 2022, 50, 104222 CrossRef.
- M. Z. Iqbal, S. Zakar and S. S. Haider, J. Electroanal. Chem., 2020, 858, 113793 CrossRef CAS.
- M. Aadil, S. Zulfiqar, M. F. Warsi, P. O. Agboola and I. Shakir, J. Mater. Res. Technol., 2020, 9, 12697–12706 CrossRef CAS.
- Y. Ma, C. Hou, H. Kimura, X. Xie, H. Jiang, X. Sun, X. Yang, Y. Zhang and W. Du, Adv. Compos. Hybrid Mater., 2023, 6, 59 CrossRef.
- D. Sui, M. Wu, Y. Liu, Y. Yang, H. Zhang, Y. Ma, L. Zhang and Y. Chen, Nanotechnology, 2020, 32, 015403 CrossRef PubMed.
- M. Wu, X. Hu, W. Zheng, L. Chen and Q. Zhang, Chem. Eng. J., 2023, 466, 143077 CrossRef CAS.
- S. S. Shah, M. A. Aziz and Z. H. Yamani, Chem. Rec., 2022, 22, e202200018 CrossRef CAS PubMed.
- Y.-Y. Lin, T.-L. Wang, D.-H. Li and C.-H. Yang, J. Energy Storage, 2022, 55, 105693 CrossRef.
- J. M. Gonçalves, L. V. de Faria, A. B. Nascimento, R. L. Germscheidt, S. Patra, L. P. Hernández-Saravia, J. A. Bonacin, R. A. Munoz and L. Angnes, Anal. Chim. Acta, 2022, 1233, 340362 CrossRef PubMed.
- R. Kumar, R. Kumar, P. K. Sahoo, M. Singh and A. Soam, Mater. Today: Proc., 2022, 67, 1001–1004 CrossRef CAS.
- H. Li, T. Liu, Y. He, J. Song, A. Meng, C. Sun, M. Hu, L. Wang, G. Li and Z. Zhang, ACS Appl. Mater. Interfaces, 2022, 14, 3363–3373 CrossRef CAS PubMed.
- S. Zhu, J. Ni and Y. Li, Nano Res., 2020, 13, 1825–1841 CrossRef CAS.
- E. Sarala, M. Madhukara Naik, M. Vinuth, Y. Rami Reddy and H. Sujatha, J. Mater. Sci.: Mater. Electron., 2020, 31, 8589–8596 CrossRef CAS.
- M. Junaid, M. A. Khan, S. A. Abubshait, M. N. Akhtar, N. A. Kattan, A. Laref and H. M. Asif Javed, Ceram. Int., 2020, 46, 27410–27418 CrossRef CAS.
- M. Junaid, M. A. Khan, M. N. Akhtar, A. Hussain and M. F. Warsi, Ceram. Int., 2019, 45, 13431–13437 CrossRef CAS.
- Z. Huang, J. Deng, H. Wang, Y. Zhang, J. Duan, Z. Tang, Z. Cao, J. Qi, D. He and T. Lu, J. Alloys Compd., 2020, 830, 154617 CrossRef CAS.
- H. A. Kareem, M. Zaidi, A. Ameen Baqer, S. K Hachim, T. Ghazuan, K. Kadhim Alasedi, N. M Hameed, A. Kareem Obaid Aldulaim, M. Kadhem Abid and M. J Hussein, J. Nanostruct., 2022, 12, 521–528 CAS.
- M. Aadil, T. Kousar, M. Hussain, H. H. Somaily, A. K. Abdulla, E. R. Muhammad, E. A. Al-Abbad, M. A. Salam, S. M. Albukhari, D. F. Baamer and M. Z. Ansari, Ceram. Int., 2023, 49, 4846–4854 CrossRef CAS.
- C. Ouyang, Y. Zhang, D. Yang, D. Ma and S. Huang, J. Mater. Chem. C, 2021, 9, 4466–4473 RSC.
- Shubhra, R. K. Singh, N. Kumar, V. Kumar, S. B. Das and M. M. H. Siddiqui, Appl. Phys. A, 2021, 127, 861 CrossRef CAS.
- S. Debnath and R. Das, J. Alloys Compd., 2021, 852, 156884 CrossRef CAS.
- M. M. Ngoma, M. Mathaba and K. Moothi, Sci. Rep., 2021, 11, 23805 CrossRef CAS PubMed.
- M. Aadil, S. Zulfiqar, M. Shahid, P. O. Agboola, N. F. Al-Khalli, M. F. Warsi and I. Shakir, Electrochim. Acta, 2021, 383, 138332 CrossRef CAS.
- H. Sabeeh, M. Aadil, S. Zulfiqar, I. Ayeman, I. Shakir, P. O. Agboola, S. Haider and M. F. Warsi, J. Cluster Sci., 2022, 33, 2113–2121 CrossRef CAS.
- M. Aamir, I. Bibi, S. Ata, K. Jilani, F. Majid, S. Kamal, N. Alwadai, M. A. S. Raza, M. Bashir, S. Iqbal, M. Aadil and M. Iqbal, Ceram. Int., 2021, 47, 16696–16707 CrossRef CAS.
- M. Aadil, W. Hassan, H. H. Somaily, S. R. Ejaz, R. R. Abass, H. Jasem, S. K. Hachim, A. H. Adhab, E. S. Abood and I. A. Alsafari, J. Alloys Compd., 2022, 920, 165876 CrossRef CAS.
- C. Murugesan and G. Chandrasekaran, RSC Adv., 2015, 5, 73714–73725 RSC.
- R. Tiwari, M. De, H. S. Tewari and S. K. Ghoshal, Results Phys., 2020, 16, 102916 CrossRef.
- P. Galinetto, B. Albini, M. Bini and M. C. Mozzati, Raman Spectroscopy, 2018, vol. 223, DOI:10.5772/intechopen.72864.
- Y. Park, K. P. S. S. Hembram, R. Yoo, B. Jang, W. Lee, S.-G. Lee, J.-G. Kim, Y.-I. Kim, D. J. Moon, J.-K. Lee and J.-K. Lee, J. Phys. Chem. C, 2019, 123, 14003–14009 CrossRef CAS.
- H. T Mohammed, K. Kadhim Alasedi, R. Ruyid, S. Abed Hussein, A. Latif Jarallah, S. MA Dahesh, M. Q. Sultan, Z. N. Salman, B. S. Bashar and A. Kareem Obaid Aldulaimi, J. Nanostruct., 2022, 12, 503–509 Search PubMed.
- N. Ashraf, M. Aadil, S. Zulfiqar, H. Sabeeh, M. A. Khan, I. Shakir, P. O. Agboola and M. F. Warsi, ChemistrySelect, 2020, 5, 8129–8136 CrossRef CAS.
- R. Fatima, M. F. Warsi, S. Zulfiqar, S. A. Ragab, I. Shakir and M. I. Sarwar, Ceram. Int., 2020, 46, 16480–16492 CrossRef CAS.
- M. Aadil, S. Zulfiqar, M. Shahid, P. O. Agboola, S. Haider, M. F. Warsi and I. Shakir, J. Electroanal. Chem., 2021, 884, 115070 CrossRef CAS.
- S. Satpathy, M. Dhar and B. K. Bhattacharyya, J. Energy Storage, 2020, 31, 101606 CrossRef.
- M. U. Khalid, K. M. Katubi, S. Zulfiqar, Z. A. Alrowaili, M. Aadil, M. S. Al-Buriahi, M. Shahid and M. F. Warsi, Fuel, 2023, 343, 127946 CrossRef CAS.
- S. Dalvand, Z. Khoushab, S. M. Mousavi-Khoshdel, H. Ghafuri, H. R. Esmaili Zand and M. Omidvar, Int. J. Hydrogen Energy, 2022, 48(27), 10098–10107 CrossRef.
- M. W. Iqbal, M. M. Faisal, H. u. Hassan, A. M. Afzal, S. Aftab, T. Zahid and A. u. Rehman, J. Energy Storage, 2022, 52, 104847 CrossRef.
- R. Sigwadi, M. S. Dhlamini, T. Mokrani, F. Nemavhola, P. F. Nonjola and P. F. Msomi, Heliyon, 2019, 5, e02240 CrossRef CAS PubMed.
- S. R. Ali, M. M. Faisal, S. Pushpan, N. P. Aguilar, K. K. Singh, A. Cerdán, Pasarán, M. M. A. Rodríguez, E. M. Sánchez, A. T. Castro and S. L. Loredo, Int. J. Energy Res., 2022, 46, 23757–23774 CrossRef CAS.
- M. Atta, H. M. Zakaly, N. Almousa, A. Abdel Reheem, M. Madani, U. F. Kandil, A. Henaish and E. O. Taha, Carbon Lett., 2023, 1–10 Search PubMed.
- M. B. Askari, P. Salarizadeh, M. Seifi, M. H. Ramezan zadeh and A. Di Bartolomeo, J. Alloys Compd., 2021, 860, 158497 CrossRef CAS.
- L. Li, H. Bi, S. Gai, F. He, P. Gao, Y. Dai, X. Zhang, D. Yang, M. Zhang and P. Yang, Sci. Rep., 2017, 7, 43116 CrossRef CAS PubMed.
- R. Devi, J. Patra, K. Tapadia, J.-K. Chang and T. Maharana, J. Taiwan Inst. Chem. Eng., 2022, 138, 104474 CrossRef CAS.
- M. Mandal, S. Subudhi, I. Alam, B. Subramanyam, S. Patra, J. Raiguru, S. Das and P. Mahanandia, Inorg. Chem. Commun., 2021, 123, 108332 CrossRef CAS.
- X. Mo, G. Xu, X. Kang, H. Yin, X. Cui, Y. Zhao, J. Zhang, J. Tang and F. Wang, Nanomaterials, 2023, 13, 1034 CrossRef CAS PubMed.
- R. Lakra, C. Mahender, B. K. Singh, R. Kumar, S. Kumar, P. K. Sahoo, D. Thatoi and A. Soam, J. Electron. Mater., 2023, 52, 2676–2684 CrossRef CAS.
- J.-G. Seong, T. H. Ko, D. Lei, W.-K. Choi, Y.-S. Kuk, M.-K. Seo and B.-S. Kim, Green Energy Environ., 2022, 7, 1228–1240 CrossRef CAS.
| This journal is © The Royal Society of Chemistry 2023 |

