 Open Access Article
Elucidating anticancer drugs release from UiO-66 as a carrier through the computational approaches†
Tahereh Boroushakia,
Mokhtar Ganjali Kolib,
Rahime Eshaghi Malekshahc and
Mohammad G. Dekamin *a
*a
aPharmaceutical and Heterocyclic Compounds Research Laboratory, Department of Chemistry, Iran University of Science and Technology, Tehran, 16846-13114, Iran. E-mail: mdekamin@iust.ac.ir
bDepartment of Chemistry, University of Kurdistan, Sanandaj, Iran
cDepartment of Chemistry, Faculty of Science, Semnan University, Semnan, Iran
First published on 1st November 2023
Abstract
The computational analysis of drug release from metal–organic frameworks (MOFs), specifically UiO-66, is the primary focus of this research. MOFs are recognized as nanocarriers due to their crystalline structure, porosity, and potential for added functionalities. The research examines the release patterns of three drugs: temozolomide, alendronate, and 5-fluorouracil, assessing various factors such as the drugs' distance from the UiO-66 centers, the interaction of drug functional groups with Zr metal ions, and the drug density throughout the nanocarrier. Findings reveal that 5-fluorouracil is located furthest from the UiO-66 center and exhibits the highest positive energy compared to the other drugs. Alendronate's density is observed to shift to the carrier surface, while 5-fluorouracil's density significantly decreases within the system. The drug density diminishes as the distance from the UiO-66 center of mass increases, suggesting a stronger positive interaction between the drugs and the nanocarrier. Moreover, Monte Carlo calculations were employed to load drugs onto the UiO-66 surface, leading to a substantial release of 5-fluorouracil from UiO-66. Quantum and Monte Carlo adsorption localization calculations were also conducted to gather data on the compounds' energy and geometry. This research underscores the potential of MOFs as nanocarriers for drug delivery and highlights the crucial role of temperature in regulating drug release from UiO-66. It provides insights into the complex dynamics of drug release and the factors influencing it, thereby emphasizing the promise of UiO-66 as a viable candidate for drug delivery. This work contributes to our understanding of UiO-66's role and sets the stage for improved performance optimization in the cancer treatment.
1. Introduction
Metal–Organic Frameworks (MOFs) represent an innovative class of porous nanoparticles, combining organic bonds with inorganic metal nodes through coordinated bonds. This fusion has captured significant attention in recent years due to its unique properties.1–6 MOFs are versatile, typically synthesized at ambient temperatures up to 220 °C, under pressures ranging from 0 to 20 atmospheres, and within pH levels from 1 to 10.7The primary application of MOFs lies in drug delivery systems, particularly in cancer treatment, where they excel at encapsulating anticancer drugs within their structures as well as their modifying by post-synthesis to enhance drug absorption and chemotherapy outcomes.8–10 MOFs offer advantages such as ease of synthesis, highly porous and flexible structures11 and the ability to design biocompatible and biodegradable systems for drug delivery.12–14
Conventional drug delivery systems, while are highly biocompatible, often have limited drug-loading capacities. On the other hand, metal nanoparticles such as gold, iron, zinc, and chromium can significantly increase drug payloads but tend to be less biodegradable and may accumulate in vital organs, leading to adverse effects. To address this, various MOF classes have been developed, utilizing less defective and more biocompatible metals to maximize drug loading while maintaining safety.15–17 Zr-MOFs involve zirconium cornerstone units linked with at least bidentate organic linker compounds, forming intricate coordinated networks.18
Zr-MOFs are sought-after for targeted drug delivery due to their superior chemical stability compared to iron-based MOFs.19 In vitro and in vivo studies confirm their safe use, with minimal cytotoxicity and efficient anticancer drug delivery.20–29 Furthermore, the low Zr content (300 mg) in the body, daily requirement (0.5 mg), and high lethal dose 50% (LD50) in in vivo tests (4.15 g kg−1) make zirconium a safer choice compared to other metals.30–36 Zirconium terephthalate MOF UiO-66 stands out for its exceptional biocompatibility,23 well-characterized structure, membrane-crossing ability,20,22 and pH-sensitive drug release characteristics, making it an ideal candidate for delivering nanoparticle-bound anticancer drugs.24
MOFs can be synthesized through various methods, including solvothermal synthesis, making them sensitive to factors such as reaction time, concentration, pH, temperature, and stoichiometric values.35,37–40 Temperature-responsive MOFs, sensitive to changes around the physiological temperature of 310 K, have gained particular interest in controlled drug release for biological applications. Pioneering research, like Sada et al.'s work, demonstrates the controlled release of various compounds from UiO-66-PNIPAM nanoparticles through temperature modulation.41
So far, despite many efforts and advances in the synthesis and application of biocompatible MOFs for drug delivery, there is only a limited understanding of drug uptake and its release mechanism at the molecular level. In the meantime, molecular simulation can provide a unique insight into the molecular structure of drug molecules within the material cavities, which plays a major role in drug loading and release.34,42–46 The combination of empirical evidence and MD simulations underscores that zeolitic imidazolate frameworks (ZIFs), particularly ZIF-8, show promise as carriers for anti-epileptic drugs. ZIF-8 demonstrated the highest drug loading values and a slow-release rate, making it suitable for various anti-epileptic drugs. Furthermore, gabapentin-ZIF-8 showed decreased metabolic activity in liver cancer cells, suggesting potential therapeutic applications.47 Drug release from nanoparticle pores is investigated by various factors such as the distance of the drug from the nanomaterials, the adsorption centers in the nanoparticle, and its interactions with the drugs. These physical properties can be studied by computational methods. Specially, molecular dynamics (MD) simulations are used to study the release of drugs into the pores and show that such simulations can be useful and suggested for screening goals before experimental research.43,44 By simulating the motions and interactions of individual molecules, MD simulations can provide insights into the dynamic behavior of biological molecules and their interactions with other molecules. MD simulations can be used to study protein folding, ligand binding, enzyme catalysis, and many other biological processes.48–50 MD simulations are particularly useful for understanding the structure–function relationship of biomolecules and for drug discovery.51–58 This study aimed to computationally investigate the effect of temperature increase on the release of anticancer drugs temozolomide (TMZ), alendronate (Ald), and 5-fluorouracil (5-FU)24,59,60 that have already loaded into the UiO-66 cavities.61 These drugs share a common characteristic, they all interfere with cellular processes (DNA synthesis in cancer cells) to achieve their therapeutic effects.
2. Methodology
2.1 Molecular structures
UiO-66 was constructed with Zr6O4(OH)4 clusters and terephthalate (1,4-benzene dicarboxylate, BDC) linkers which exhibits a with large porosity (SBET = 1200 m2 g−1) and a pore volume (Vp = 0.5 mL g−1).28 The octahedral cluster in UiO-66 consists of six-centered Zr cations, along with eight μ 3-O bridges, with four of them being protonated. Additionally, each cluster unit is connected to 12 neighboring clusters through BDC linkers, forming an expanded face-centered-cubic (fcu) arrangement, as depicted in Fig. 1. UiO-66 possesses two distinct cavities, measuring approximately 0.8 nm and 1.1 nm, corresponding to tetrahedral and octahedral pores, respectively. The pore windows' sizes are 0.3 nm and 0.5 nm, respectively.17,35,61–63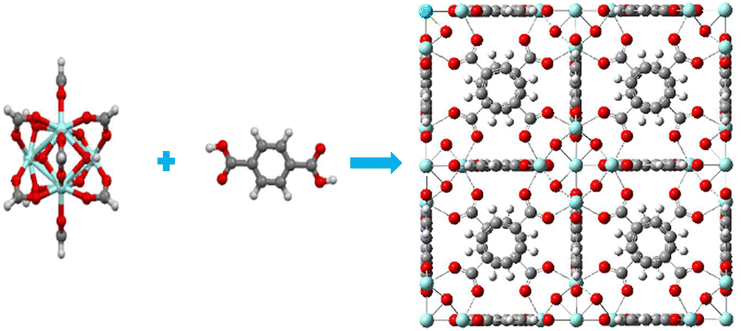 | ||
| Fig. 1 (a) Six-centered octahedral zirconium oxide cluster, (b) BDC linker (c) fcu unit cell of UiO-66; blue atom – Zr, red atom – O, dark gray atom – C, light gray atom – H. | ||
2.2 Simulation details
![[thin space (1/6-em)]](https://www.rsc.org/images/entities/char_2009.gif) 000 cycles, and the group-based option at a cutoff of 18.5 Å, respectively. The temperature was done automated temperature control. Set maximum adsorption distance was set 10 Å.72,73
000 cycles, and the group-based option at a cutoff of 18.5 Å, respectively. The temperature was done automated temperature control. Set maximum adsorption distance was set 10 Å.72,733. Results and discussion
The following section involved an assessment of drug release, where various parameters were considered. These parameters included the distance of the drugs from the center of UiO-66, a two-dimensional density map (2D) of the systems, interaction energies, and drug mobility within the systems. Fig. 3 illustrates the schematic of a representative simulated system.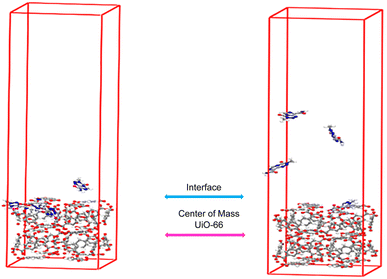 | ||
| Fig. 3 Snapshots of (a) the loading phase (b) releasing configurations of the TMZ as a typical drug and UiO-66. | ||
3.1 Distance
In the previous study,61 by examining the distance between the center of mass (COM) drug molecules and the center of UiO-66, it was determined that all drugs had completely entered and loaded into the cavities. Hence, for the release calculations, the same parameter was utilized. The distance from the center of mass of UiO-66 to its surface measures 1.1 nm (refer to Fig. 3). At 313 K, the distances between the COM of TMZ, Ald, and 5-FU from the center of UiO-66 were found to be 0.57, 0.71, and 2.23 nm, respectively (taken from the last 10 ns of each simulation). These values indicate that the releasing order is as follows: TMZ < Ald < 5-FU.3.2 Interaction energies
In order to thermodynamically evaluate the release of drug molecules from the cavities of UiO-66, we investigated their interactions with various components of the simulated system and computed the interaction energies, as summarized in Table 1.| Systems | Interaction energy (kJ mol−1) | ||||
|---|---|---|---|---|---|
| Between drug and UiO-66 | Between drug and water | Between drug and drug | Between UiO-66 and water | ||
| a The interaction energy refers to the interactions between all four drugs and various other components.b All data for T = 300 K were obtained from ref. 61. | |||||
| (T = 313 K) | TMZ/UiO-66/water | −59.84 (±17.00) | −269.79 (±8.20) | −11.00 (±1.60) | −1356.08 (±9.80) |
| Ald/UiO-66/water | −22.69 (±4.00) | −321.28 (±2.80) | −7.47 (±0.86) | −1357.54 (±2.70) | |
| 5-FU/UiO-66/water | −4.47 (±1.80) | −186.63 (±0.95) | −7.62 (±0.13) | −1334.27 (±1.30) | |
| UiO-66/water | — | — | — | −1383.80 (±0.23) | |
| (T = 300 K)b | TMZ/UiO-66/water | −68.94 (±8.90) | −259.94 (±5.00) | −15.69 (±4.00) | −1360.94 (±5.30) |
| Ald/UiO-66/water | −30.03 (±4.70) | −322.34 (±3.20) | −6.66 (±0.79) | −1367.03 (±3.00) | |
| 5-FU/UiO-66/water | −9.87 (±3.50) | −186.75 (±2.20) | −7.88 (±0.35) | −1345.54 (±2.90) | |
| UiO-66/water | — | — | — | −1396.51 (±0.34) | |
The interaction energies values between TMZ/UiO-66, Ald/UiO-66, and 5-FU/UiO-66 were −59.84, −22.69, and −4.47 kJ mole−1, respectively. By comparing these values with their corresponding values at 300 K, it can be observed that they experienced an increase in interaction energies by 14.5%, 24%, and 55%, respectively (i.e., their energy became more positive). This thermodynamic evidence indicates a tendency not to bond or remain trapped in the cavity of UiO-66 at this temperature. This observation of a thermodynamic preference for release at 313 K is consistent with the results obtained regarding distances (as discussed in the previous section). By reducing the intermolecular energies between the drug and UiO-66 and consequently increasing the distance between the drug molecule and UiO-66, it can be observed that the complete release of drug molecules from the nanocarrier takes place. At 313 K, 5-FU exhibited the highest and farthest distance from the center of UiO-66, leading to its superior release in comparison to the other two drugs. The interaction energies between drugs and UiO-66 in various simulated systems can be found in the ESI (Fig. S1†). Furthermore, all three drugs exhibit a very high thermodynamic tendency to interact with water. Ald molecules showed the highest affinity, while those of 5-FU displayed the least. Although thermodynamically, all drug/drug interaction energies are favorable, it appears that only the possibility of interactions among 5-FU molecules is greater (more negative) than the interaction energy with UiO-66. Analyzing the interaction energy of water molecules with the carriers also revealed that the increase in interaction energy of the drugs/UiO-66 (becoming more positive) was more significant in the 5-FU-containing system than in the other two systems.
3.3 Density profile in UiO-66
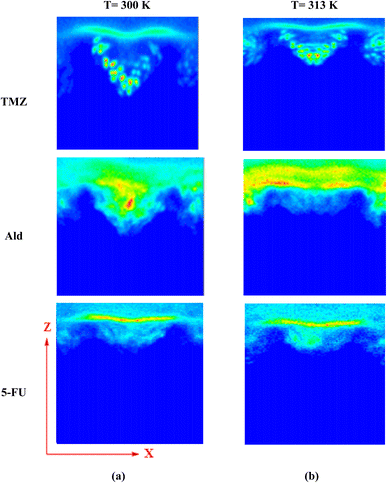
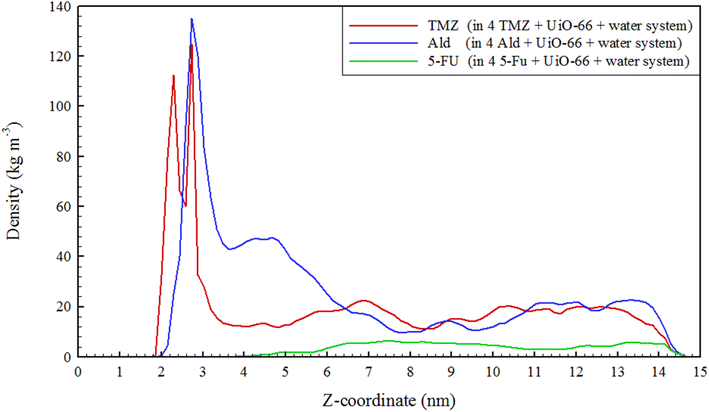
The release of TMZ, Ald, and 5-FU molecules from UiO-66 cavities was evaluated using a two-dimensional density map (2D). By analyzing 2D density maps, regions of interest with higher or lower particle densities could be identified. This can be crucial for pinpointing areas where specific interactions or phenomena are occurring, such as binding sites, solvent-accessible regions, or phase boundaries.74,75 Considering the 2D density of drug-containing systems at 313 K and comparing it with 300 K in the XZ plane, the change in drug density was clearly observed. TMZ had the shortest distance of 0.57 nm from the center of UiO-66 and the most negative energy at 313 K (−59.84 kJ mol−1), resulting in the highest accumulation of this drug occurring in the corners of UiO-66. In this system, the density of TMZ near the metal centers reduced to 0.32 nm and transferred to another area of 0.57 nm with a lower density. In the Ald-containing system, the density of Ald was transferred to the carrier surface within an area of 0.71 nm. In the 5-FU containing system, the density of the 5-FU drug moved to 2.23 nm, and its amount was greatly reduced. Finally, the drug density within the systems was decreased due to the increased distance from the center of UiO-66 and the weaker interaction between the drugs and the nanocarrier (Fig. 4).Density profile of drugs in UiO-66 cavities was evaluated. Density profiles provide information about how the density of particles varies with respect to a specific coordinate or dimension within the simulation system. This is essential for understanding the arrangement and organization of molecules in a specific region.76,77 As can be seen in Fig. 5, the density of drugs, especially TMZ and 5-FU along the z-axis, was reduced. This reduction can confirm the release of drugs through nanocarrier cavities at 313 K. Also, to confirm the release process, the number of water molecules that contacts the metal centers Zr4 and Zr5 (Fig. S3†), which are active sites for the reception of guest molecules (drugs) in simulated systems, was examined. It was observed that with increasing temperature, the number of contacts decreased significantly. Since the drug/water interaction energies were more negative, it is inferred that the drugs moved water molecules with them when they were released and transferred them from the UiO-66 cavities. This result is consistent and provable using a water density diagram that did not increase with the release of drugs (Fig. S2 and Table S1†).
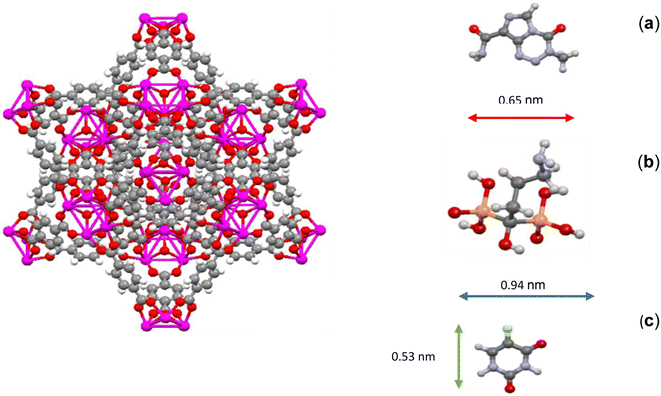
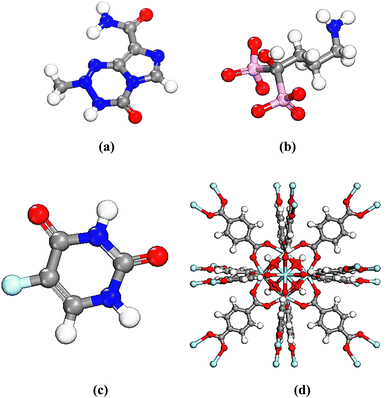
In addition to increasing the distance of TMZ and 5-FU drugs from the center of UiO-66 and making the energy between them and UiO-66 more than Ald, the reason for the sharp decrease in the density of TMZ and 5-FU could be attributed to their molecular structure and chemical nature. The molecular structure of TMZ, Ald, and 5-FU was examined, and it was observed that the sizes of TMZ and 5-FU molecules were smaller than both the cavity size and the window size of UiO-66 (0.65 and 0.53 nm, respectively). Therefore, it is expected for the mentioned drugs to exit the UiO-66 cavities, which have sizes of about 0.8 and 1.1 nm, and also the triangular windows with a diameter of about 0.6 nm. This is especially true in the case of 5-FU, which is smaller in size than the other two drugs (Fig. 2). In terms of chemical nature, 5-FU had more polarization than the other two drugs and has more effective van der Waals interactions with the UiO-66 structure.
3.4 Mean square displacement
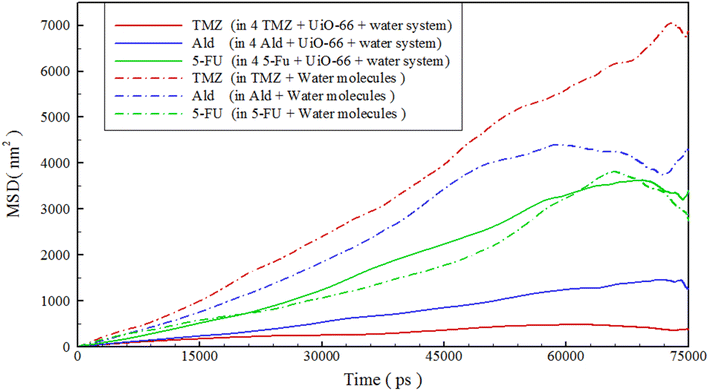
In order to study how drugs behave over time, we analyzed the mean square displacement (MSD) of drugs within various drug-containing systems. For calculating the drug diffusion coefficient (D), the time interval of 5–40 ns was selected, where the MSD curves have the least fluctuations. The diffusion coefficient can be obtained from the Einstein formula61,78 in two dimensions, as follows:
 | (1) |
| Property | Systems | |||||
|---|---|---|---|---|---|---|
| TMZ/water | Ald/water | 5-FU/water | TMZ/water/UiO-66 | Ald/water/UiO-66 | 5-FU/water/UiO-66 | |
| Diffusion coefficient (×10−5 cm2 s−1) | 17.07 (±2.77) | 13.22 (±2.14) | 9.66 (±9.38) | 1.10 (±0.21) | 3.66 (±0.79) | 10.23 (±2.51) |
| Properties | Drug or carrier | |||
|---|---|---|---|---|
| TMZ | Ald | 5-FU | UiO-66 | |
| Kinetic | −8.913 | −9.557 | −5.163 | −27.589 |
| Electrostatic | 1.767 | 2.572 | 1.049 | −61.019 |
| Exchange-correlation | 1.680 | 1.574 | 0.961 | 18.260 |
| Spin polarization | 1.426 | 1.278 | 0.697 | 12.933 |
| DFT-D correction | −0.015 | −0.025 | −0.006 | −0.401 |
| Total energy | −711.520 | −1421.588 | −513.865 | −9317.538 |
3.5 Quantum calculations
At first, TMZ, Ald, 5-FU and UiO-66 structures were optimized to obtain energy values including sum of atomic energies, kinetic, electrostatic, exchange-correlation, spin polarization and total energy and the results are exhibited Fig. 7 and Table 3. The total energy of TMZ, Ald, 5-FU and UiO-66 was taken −711.520, −1421.588, −513.865 and −9317.538 Ha, respectively.3.6 Monte Carlo calculations for drug adsorption on UiO-66
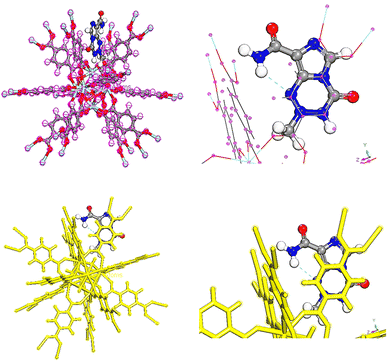
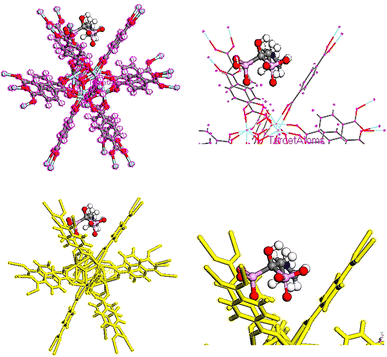
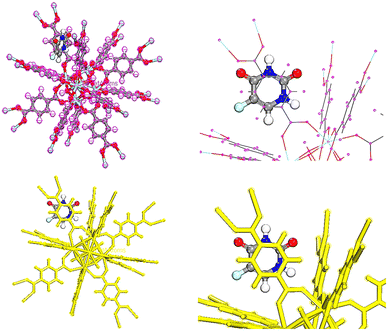
In order to adsorb drugs on UiO-66, locator module along with computational force field; universal was used and displayed in Fig. 8–10.82–85 The adsorption energy values (Ead) of TMZ, Ald and 5-FU on UiO-66 in gaseous state were about −84.587, −70.408 and −29.476 kcal mol−1, respectively. All drugs were interacted on UiO-66 by forming hydrogen bond including –NH2 and –NH. Additionally, the van der Waals force is normally additional attractive force between drugs and UiO-66. Furthermore, TMZ and 5-FU molecules had π–π stacking interactions (π-donor–acceptor) on UiO-66. According to adsorption energy values obtained from theoretical calculations, the adsorption of TMZ and Ald on the UiO-66 surface was more compared with 5-FU. As a result, 5-FU can be released the easiest compared with TMZ and Ald. According to adsorption energy values, the release of drugs is given as follow 5-FU > Ald > TMZ.3.7 Quantum calculations of TMZ, Ald and 5-FU adsorption on UiO-66
To obtain the energy of drugs on UiO-66, compounds were optimized using Dmol3 module as represented in Fig. 11.86 The total energies of the system TMZ, Ald and 5-FU adsorption on UiO-66 were estimated at −114838.209, −115548.144, and −114640.406 Ha, respectively, Table 4.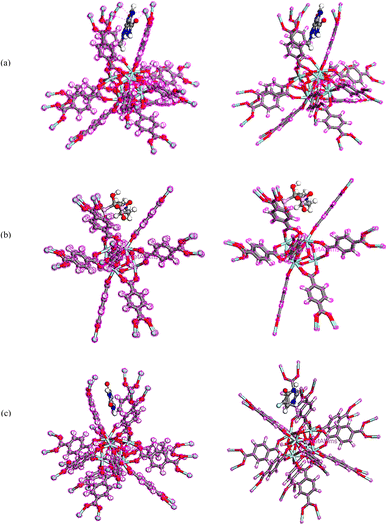 | ||
| Fig. 11 Equilibrium geometries of (a) TMZ, (b) Ald, (c) 5-FU adsorption on UiO-66 by DMol3 module in Materials Studio 2017. | ||
| Properties | Drugs | ||
|---|---|---|---|
| TMZ | Ald | 5-FU | |
| Kinetic | −0.725 | 8.254 | 7.456 |
| Electrostatic | −94.192 | −102.831 | −99.158 |
| Exchange-correlation | 20.819 | 20.606 | 19.965 |
| Spin polarization | 12.345 | 12.183 | 11.641 |
| DFT-D correction | −0.524 | −0.454 | −0.442 |
| Total energy | −114838.209 | −115548.144 | −114640.406 |
3.8 Frontier molecular orbital analysis of compounds
DMol3 module was used to obtain energies of HOMO (as nucleophilic sites) and LUMO (electrophilic sites) using Materials Studio software 2017. As shown in Fig. 12a–d, the HOMOs of TMZ were principally localized on N atoms as well as amide atoms. The LUMOs of TMZ were located on N atoms and O linking to ring. The HOMOs of Ald were generally distributed on nitrogen element and C linking to N atom, while the LUMOs of this structure were mostly situated on rings linking to P atoms, C atoms linking to P and O atom linking to C atom. In addition, the HOMOs of 5-FU were distributed on F and C atoms closed to F atom while, LUMOs were placed on atoms of ring of 5-FU. The HOMOs of UiO-66 are mainly centered on Zr elements. The LUMOs of UiO-66 are mostly centralized on whole structure.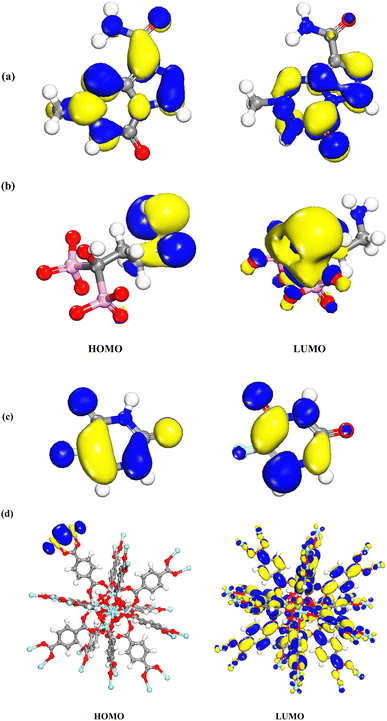 | ||
| Fig. 12 Charge distributions of HOMO and LUMO orbitals for (a) TMZ, (b) Ald, (c) 5-FU, and (d) UiO-66 by DMol3 module in Materials Studio 2017. | ||
The HOMO density of TMZ/UiO-66, Ald/UiO-66 and 5-FU/UiO-66 adsorption was located at the Zr close to drugs, whereas LUMO maps with charge distribution were largely located on the oxygen atoms and aromatic rings (Fig. 13a–c).
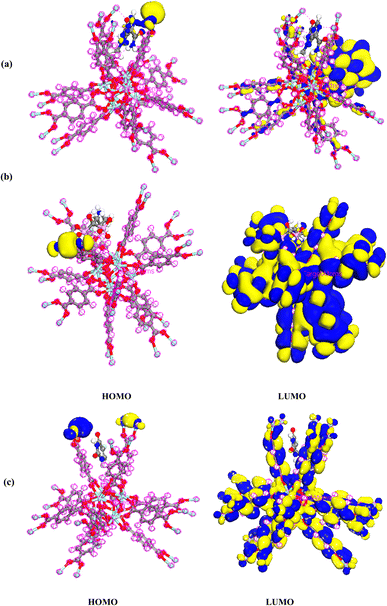 | ||
| Fig. 13 Charge distributions of HOMO and LUMO orbitals for (a) TMZ, (b) Ald, (c) 5-FU adsorption on UiO-66 by DMol3 module in Materials Studio 2017. | ||
4. Conclusion
This study utilized molecular dynamics simulations to investigate the release of three different anticancer drugs, TMZ, Ald, and 5-FU, from UiO-66 cavities at 313 K. Two systems were simulated, a high concentration system containing UiO-66, drug, and water as well as a reference system containing only drug and water. The distance between the drug centers and UiO-66 was calculated, revealing that the distance between drug-UiO-66 at 313 K was greater than at 300 K. The interaction energy between different components of the system and drugs was also examined and found to be more positive at 313 K than at 300 K, with 5-FU having the greatest distance (2.23 nm) and the most positive interaction energy with UiO-66 (−4.47 kJ mol−1). The drug densities within UiO-66 cavities were analyzed using a 2D density map and drug profiles, revealing drug transfer to higher locations and a decrease in density, particularly for 5-FU. In such a way that, for TMZ and Ald, peaks are observed around 2.1 nm and 2.8 nm (which are outside of the UiO-66 cavities), while for 5-FU, no significant density is observed up to about 4 nm. The mobility of all drugs was examined using mean squared displacement, and it was found that increasing the temperature increased the mobility of all drugs, with 5-FU having the greatest mobility difference at 313 K. The study concluded that increasing the temperature from 300 K to 313 K facilitated the drug release process, with 5-FU having the most significant release. Additionally, quantum and Monte Carlo adsorption locator calculations were used to obtain information about the energy and geometry of the compounds, which showed that the release of 5-FU was the highest due to differences in π–π stacking interactions, hydrogen bonds, and van der Waals forces. In our current study, we focused on the interaction of UiO-66 with specific anticancer drugs. However, the principles and methodologies used in this research could certainly be extended to other drug systems. For instance, the same simulation approach could be used to study the interaction of UiO-66 with other therapeutic agents, such as antibiotics or antiviral drugs.Conflicts of interest
There are no conflicts to declare.References
- W. H. De Jong and P. J. A. Borm, Int. J. Nanomed., 2008, 3, 133–149 CrossRef CAS PubMed.
- B. Roszek, W. H. De Jong and R. E. Geertsma, in Nanotechnology in medical applications: state-of-the-art in materials and devices, Rijksinstituut voor Volksgezondheid en Milieu, RIVM, 2005 Search PubMed.
- M. Ferrari, Nat. Rev. Cancer, 2005, 5, 161–171 CrossRef CAS PubMed.
- F. X. Gu, R. Karnik, A. Z. Wang, F. Alexis, E. Levy-Nissenbaum, S. Hong, R. S. Langer and O. C. Farokhzad, Nano Today, 2007, 2, 14–21 CrossRef.
- S. Xiang, Y. He, Z. Zhang, H. Wu, W. Zhou, R. Krishna and B. Chen, Nat. Commun., 2012, 3, 954 CrossRef PubMed.
- H.-C. Zhou, J. R. Long and O. M. Yaghi, Chem. Rev., 2012, 112, 673–674 CrossRef CAS PubMed.
- R. Zou, A. I. Abdel-Fattah, H. Xu, Y. Zhao and D. D. Hickmott, CrystEngComm, 2010, 12, 1337–1353 RSC.
- X. Liu, Front. Chem. Sci. Eng., 2020, 14, 216–232 CrossRef CAS.
- W. Cho, H. J. Lee, G. Choi, S. Choi and M. Oh, J. Am. Chem. Soc., 2014, 136, 12201–12204 CrossRef CAS PubMed.
- M. H. Teplensky, M. Fantham, P. Li, T. C. Wang, J. P. Mehta, L. J. Young, P. Z. Moghadam, J. T. Hupp, O. K. Farha and C. F. Kaminski, J. Am. Chem. Soc., 2017, 139, 7522–7532 CrossRef CAS PubMed.
- H. Furukawa, K. E. Cordova, M. O'Keeffe and O. M. Yaghi, Science, 2013, 341, 1230444 CrossRef PubMed.
- M. C. Bernini, D. Fairen-Jimenez, M. Pasinetti, A. J. Ramirez-Pastor and R. Q. Snurr, J. Mater. Chem. B, 2014, 2, 766–774 RSC.
- P. Horcajada, R. Gref, T. Baati, P. K. Allan, G. Maurin, P. Couvreur, G. Férey, R. E. Morris and C. Serre, Chem. Rev., 2012, 112, 1232–1268 CrossRef CAS PubMed.
- J. Lu, M. Liong, Z. Li, J. I. Zink and F. Tamanoi, Small, 2010, 6, 1794–1805 CrossRef CAS PubMed.
- G. Jarockyte, E. Daugelaite, M. Stasys, U. Statkute, V. Poderys, T.-C. Tseng, S.-H. Hsu, V. Karabanovas and R. Rotomskis, Int. J. Mol. Sci., 2016, 17, 1193 CrossRef PubMed.
- S. E. Bambalaza, H. W. Langmi, R. Mokaya, N. M. Musyoka, J. Ren and L. E. Khotseng, J. Mater. Chem. A, 2018, 6, 23569–23577 RSC.
- J. H. Cavka, S. Jakobsen, U. Olsbye, N. Guillou, C. Lamberti, S. Bordiga and K. P. Lillerud, J. Am. Chem. Soc., 2008, 130, 13850–13851 CrossRef PubMed.
- H. Reinsch, K. P. Lillerud, S. Chavan, U. Olsbye, D. De Vos and N. Stock, Process for preparing a zirconium-based metal organic framework, US Pat., 10,450,330, 22 Oct. 2019 Search PubMed.
- C. Wang, X. Liu, J. P. Chen and K. Li, Sci. Rep., 2015, 5, 16613 CrossRef CAS PubMed.
- C. Orellana-Tavra, E. F. Baxter, T. Tian, T. D. Bennett, N. K. H. Slater, A. K. Cheetham and D. Fairen-Jimenez, Chem. Commun., 2015, 51, 13878–13881 RSC.
- C. Orellana-Tavra, R. J. Marshall, E. F. Baxter, I. A. Lázaro, A. Tao, A. K. Cheetham, R. S. Forgan and D. Fairen-Jimenez, J. Mater. Chem. B, 2016, 4, 7697–7707 RSC.
- C. Orellana-Tavra, S. A. Mercado and D. Fairen-Jimenez, Adv. Healthcare Mater., 2016, 5, 2261–2270 CrossRef CAS PubMed.
- D. Chen, D. Yang, C. A. Dougherty, W. Lu, H. Wu, X. He, T. Cai, M. E. Van Dort, B. D. Ross and H. Hong, ACS Nano, 2017, 11, 4315–4327 CrossRef CAS PubMed.
- X. Zhu, J. Gu, Y. Wang, B. Li, Y. Li, W. Zhao and J. Shi, Chem. Commun., 2014, 50, 8779–8782 RSC.
- P. Horcajada, C. Serre, M. Vallet-Regí, M. Sebban, F. Taulelle and G. Férey, Angew. Chem., 2006, 118, 6120–6124 CrossRef.
- C. He, K. Lu, D. Liu and W. Lin, J. Am. Chem. Soc., 2014, 136, 5181–5184 CrossRef CAS PubMed.
- I. A. Lazaro, S. Haddad, S. Sacca, C. Orellana-Tavra, D. Fairen-Jimenez and R. S. Forgan, Chem, 2017, 2, 561–578 Search PubMed.
- C. Orellana-Tavra, S. Haddad, R. J. Marshall, I. Abánades Lázaro, G. Boix, I. Imaz, D. Maspoch, R. S. Forgan and D. Fairen-Jimenez, ACS Appl. Mater. Interfaces, 2017, 9, 35516–35525 CrossRef CAS PubMed.
- L. Tan, H. Li, Y. Zhou, Y. Zhang, X. Feng, B. Wang and Y. Yang, Small, 2015, 11, 3807–3813 CrossRef CAS PubMed.
- S. Rojas, T. Devic and P. Horcajada, J. Mater. Chem. B, 2017, 5, 2560–2573 RSC.
- S. Sene, M. T. Marcos-Almaraz, N. Menguy, J. Scola, J. Volatron, R. Rouland, J.-M. Greneche, S. Miraux, C. Menet and N. Guillou, Chem, 2017, 3, 303–322 CAS.
- M. Bosch, M. Zhang and H.-C. Zhou, Adv. Chem., 2014, 2014, 1155 Search PubMed.
- P. Horcajada, H. Chevreau, D. Heurtaux, F. Benyettou, F. Salles, T. Devic, A. Garcia-Marquez, C. Yu, H. Lavrard and C. L. Dutson, Chem. Commun., 2014, 50, 6872–6874 RSC.
- A. C. McKinlay, R. E. Morris, P. Horcajada, G. Férey, R. Gref, P. Couvreur and C. Serre, Angew. Chem., Int. Ed., 2010, 49, 6260–6266 CrossRef CAS PubMed.
- I. A. Lazaro and R. S. Forgan, Coord. Chem. Rev., 2019, 380, 230–259 CrossRef.
- P. Horcajada, T. Chalati, C. Serre, B. Gillet, C. Sebrie, T. Baati, J. F. Eubank, D. Heurtaux, P. Clayette and C. Kreuz, Nat. Mater., 2010, 9, 172–178 CrossRef CAS PubMed.
- A. Schaate, P. Roy, A. Godt, J. Lippke, F. Waltz, M. Wiebcke and P. Behrens, Chem.–Eur. J., 2011, 17, 6643–6651 CrossRef CAS PubMed.
- F. Vermoortele, B. Bueken, G. Le Bars, B. Van de Voorde, M. Vandichel, K. Houthoofd, A. Vimont, M. Daturi, M. Waroquier and V. Van Speybroeck, J. Am. Chem. Soc., 2013, 135, 11465–11468 CrossRef CAS PubMed.
- R. J. Marshall, C. L. Hobday, C. F. Murphie, S. L. Griffin, C. A. Morrison, S. A. Moggach and R. S. Forgan, J. Mater. Chem. A, 2016, 4, 6955–6963 RSC.
- M. R. DeStefano, T. Islamoglu, S. J. Garibay, J. T. Hupp and O. K. Farha, Chem. Mater., 2017, 29, 1357–1361 CrossRef CAS.
- S. Nagata, K. Kokado and K. Sada, Chem. Commun., 2015, 51, 8614–8617 RSC.
- I. Erucar and S. Keskin, Ind. Eng. Chem. Res., 2016, 55, 1929–1939 CrossRef CAS.
- M. Kotzabasaki and G. E. Froudakis, Inorg. Chem. Front., 2018, 5, 1255–1272 RSC.
- M. Lemaalem, N. Hadrioui, A. Derouiche and H. Ridouane, RSC Adv., 2020, 10, 3745–3755 RSC.
- A. Supakijsilp, J. He, X. Lin and J. Ye, RSC Adv., 2022, 12, 24222–24231 RSC.
- Z. M. Essam, G. E. Ozmen, D. Setiawan, R. R. Hamid, R. M. Abd El-Aal, R. Aneja, D. Hamelberg and M. Henary, Org. Biomol. Chem., 2021, 19, 1835–1846 RSC.
- X. Sun, M. Keywanlu and R. Tayebee, Appl. Organomet. Chem., 2021, 35, e6377 CrossRef CAS.
- M. G. Koli and K. Azizi, J. Mol. Graphics Modell., 2019, 90, 171–179 CrossRef PubMed.
- H. Aghazadeh, M. Ganjali Koli, R. Ranjbar and K. Pooshang Bagheri, J. Comput.-Aided Mol. Des., 2020, 34, 1261–1273 CrossRef CAS PubMed.
- M. Ganjali Koli, R. Eshaghi Malekshah and H. Hajiabadi, Sci. Rep., 2023, 13, 9866 CrossRef CAS PubMed.
- J. Yang, H. Wang, J. Liu, M. Ding, X. Xie, X. Yang, Y. Peng, S. Zhou, R. Ouyang and Y. Miao, RSC Adv., 2021, 11, 3241–3263 RSC.
- K. A. Bardazard, N. Shahrestani, A. Zamani, M. Eskandari, K. Jadidi, M. Hamzehloueian and B. Notash, Org. Biomol. Chem., 2023, 21, 2143–2161 RSC.
- K. Spiegel and A. Magistrato, Org. Biomol. Chem., 2006, 4, 2507–2517 RSC.
- A. M. Genaev, G. E. Salnikov and K. Y. Koltunov, Org. Biomol. Chem., 2022, 20, 6799–6808 RSC.
- D. G. Fatouros, D. Douroumis, V. Nikolakis, S. Ntais, A. M. Moschovi, V. Trivedi, B. Khima, M. Roldo, H. Nazar and P. A. Cox, J. Mater. Chem., 2011, 21, 7789–7794 RSC.
- M. F. P. Mojdehi, M. G. Koli, M. D. O. Bolagh, M. G. Gardeh and S. M. Hashemianzadeh, Mol. Syst. Des. Eng., 2021, 6, 80–92 RSC.
- B. L. Ndjopme Wandji, A. D. Tamafo Fouegue, N. K. Nkungli, R. A. Ntieche and A. Wahabou, R. Soc. Open Sci., 2022, 9, 211650 CrossRef PubMed.
- S. Roosta, S. Majid Hashemianzadeh and M. Ganjali Koli, J. Mol. Liq., 2021, 117960 CrossRef CAS.
- G. L. Borosky and A. B. Pierini, Org. Biomol. Chem., 2005, 3, 649–653 RSC.
- A. Bazzazzadeh, B. F. Dizaji, N. Kianinejad, A. Nouri and M. Irani, Int. J. Pharm., 2020, 587, 119674 CrossRef CAS PubMed.
- T. Boroushaki, M. G. Dekamin, S. M. Hashemianzadeh, M. R. Naimi-Jamal and M. Ganjali Koli, J. Mol. Graphics Modell., 2022, 108147 CrossRef CAS PubMed.
- D. Cunha, C. Gaudin, I. Colinet, P. Horcajada, G. Maurin and C. Serre, J. Mater. Chem. B, 2013, 1, 1101–1108 RSC.
- M. J. Katz, Z. J. Brown, Y. J. Colón, P. W. Siu, K. A. Scheidt, R. Q. Snurr, J. T. Hupp and O. K. Farha, Chem. Commun., 2013, 49, 9449–9451 RSC.
- M. J. Abraham, T. Murtola, R. Schulz, S. Páll, J. C. Smith, B. Hess and E. Lindahl, SoftwareX, 2015, 1, 19–25 CrossRef.
- A. K. Rappé, C. J. Casewit, K. S. Colwell, W. A. Goddard III and W. M. Skiff, J. Am. Chem. Soc., 1992, 114, 10024–10035 CrossRef.
- Q. Yang, V. Guillerm, F. Ragon, A. D. Wiersum, P. L. Llewellyn, C. Zhong, T. Devic, C. Serre and G. Maurin, Chem. Commun., 2012, 48, 9831–9833 RSC.
- J. Snyman, Practical mathematical optimization: an introduction to basic optimization theory and classical and new gradient-based algorithms, Springer Science & Business Media, 2005, vol. 97 Search PubMed.
- A. Baumketner, J. Chem. Phys., 2009, 130, 104106 CrossRef PubMed.
- G. Bussi, D. Donadio and M. Parrinello, J. Chem. Phys., 2007, 126, 14101 CrossRef PubMed.
- B. Hess, H. Bekker, H. J. C. Berendsen and J. G. E. M. Fraaije, J. Comput. Chem., 1997, 18, 1463–1472 CrossRef CAS.
- R. W. Hockney, S. P. Goel and J. W. Eastwood, J. Comput. Phys., 1974, 14, 148–158 CrossRef.
- R. Nematollahi, B. Fahimirad, R. E. Malekshah, A. Elhampour, M. Piri and M. M. Heravi, J. Mol. Liq., 2023, 369, 120387 CrossRef CAS.
- M. Iraji, M. Salehi, R. E. Malekshah, A. Khaleghian and F. Shamsi, J. Drug Delivery Sci. Technol., 2022, 75, 103600 CrossRef CAS.
- R. Briones, C. Blau, C. Kutzner, B. L. de Groot and C. Aponte-Santamaría, Biophys. J., 2019, 116, 4–11 CrossRef CAS PubMed.
- J. Shearer and S. Khalid, Sci. Rep., 2018, 8, 1805 CrossRef PubMed.
- M. G. K. K. Azizi, J. Mol. Graphics Modell., 2016, 64, 153–164 CrossRef PubMed.
- M. G. Koli and K. Azizi, Mol. Membr. Biol., 2016, 33, 64–75 CrossRef PubMed.
- K. Azizi and M. Ganjali Koli, J. Mol. Graph. Model., 2016, 64, 153–164 CrossRef CAS PubMed.
- J. Kong, Z. Bo, H. Yang, J. Yang, X. Shuai, J. Yan and K. Cen, Phys. Chem. Chem. Phys., 2017, 19, 7678–7688 RSC.
- J. T. Bullerjahn, S. von Bülow and G. Hummer, J. Chem. Phys., 2020, 153, 024116 CrossRef CAS PubMed.
- M. K. Riahi, I. A. Qattan, J. Hassan and D. Homouz, AIP Adv., 2019, 9, 055112 CrossRef.
- M. Haghbin, R. E. Malekshah, M. Sobhani, Z. Izadi, B. Haghshenas, M. Ghasemi, B. S. Kalani and H. Samadian, Int. J. Biol. Macromol., 2023, 235, 123766 CrossRef CAS PubMed.
- K. Gholivand, M. Faraghi, M. Pooyan, L. S. Babaee, R. E. Malekshah, F. Pirastehfar and M. Vahabirad, Curr. Med. Chem., 2023, 30, 3486–3503 CrossRef CAS PubMed.
- P. Roozbahani, M. Salehi, R. E. Malekshah and M. Kubicki, Inorg. Chim. Acta, 2019, 496, 119022 CrossRef CAS.
- K. Gholivand, M. Sabaghian and R. E. Malekshah, Bioorg. Chem., 2021, 115, 105193 CrossRef CAS PubMed.
- L. Feng, J. Liu, N. H. Abu-Hamdeh, S. Bezzina and R. E. Malekshah, J. Mol. Liq., 2022, 349, 118085 CrossRef CAS.
Footnote |
| † Electronic supplementary information (ESI) available. See DOI: https://doi.org/10.1039/d3ra05587f |
| This journal is © The Royal Society of Chemistry 2023 |

