 Open Access Article
An effective purification of double-effect distillation for bio-based pentamethylene diisocyanate
Feng He†
ab,
Yibo Tang†a,
Zhufeng Luc,
Qixu Hua,
Yue Yanga,
Ganlu Lia,
Hui Li *a and
Kequan Chen
 a
a
aCollege of Biotechnology and Pharmaceutical Engineering, State Key Laboratory of Materials–Oriented Chemical Engineering, Nanjing Tech University, Nanjing, 211816, China. E-mail: lihui11@njtech.edu.cn
bJiangsu Jicui Industrial Biotechnology Research Institute Co., Ltd, Nanjing, 211816, China
cGansu Yinguang Juyin Chemical Industry Co., Ltd, Yinguang, 730999, China
First published on 27th October 2023
Abstract
Bio-based pentamethylene diisocyanate (PDI) is a new type of sustainable isocyanate, which has important applications in coatings, foams, and adhesives. Technical-economic analysis of the PDI distillation process can promote the industrialization of PDI. The thermal analysis of PDI facilitates the smooth running of the simulation process. A new PDI heat capacity prediction method was established. The distillation processes of a crude PDI solution by conventional distillation and double-effect distillation were studied. Countercurrent double-effect distillation showed the best energy-saving effects in all double-effect distillation. However, combined with total annual charge (TAC), parallel double-effect distillation was the optimal method for PDI purification. Parallel double-effect distillation can significantly reduce the TAC of production PDI, which is 33.39% lower than that of the conventional distillation. The study demonstrates a clear economic incentive for reducing the cost of PDI purification by parallel double-effect distillation.
1. Introduction
Polyurethane, one of the most important industrial polymers, has excellent physicochemical properties such as flexibility and adhesion, and appropriate mechanical strength and curing rate;1–3 polyurethane has been widely used in coatings, foams, adhesives, medical products, and biomaterials.4 The main raw material for traditional polyurethane is derived from petrochemical sources.5,6 However, the exhaustion of petroleum raw materials and increased environmental pollution are restricting the development of petrochemical-based polyurethane.At present, the main aliphatic polyurethane coating hardener precursor is the traditional petrochemical hexamethylene diisocyanate (HDI), which does not contain benzene groups that can be easily oxidized. Polyurethane coatings produced by HDI demonstrate unique saturation performance, which is superior to polyurethane coatings produced by aromatic polyisocyanates in color and light preservation, oil and wear resistance, powder resistance, and yellowing resistance.7,8 However, the supply of raw materials and environmental considerations of traditional petrochemical products are becoming increasingly serious.9 A general trend toward the sustainable development of new “green coatings” has emerged that utilizes bio-based materials instead of petrochemical-based materials and biological processes instead of traditional petrochemical processes.10–13 Using biomass as raw material, lysine can be converted into pentadiamine using a biological method, and then pentadiamine is used to synthesize bio-based pentamethylene diisocyanate (PDI),14,15 which has a straight-chain aliphatic structure similar to HDI and has the potential to replace HDI and maintain excellent performance.16,17
At present, the phosgenation of organic amines in the liquid phase is the main method to prepare isocyanates in industry. It has advantages such as mature technology, stability, high yield and easy operation and other advantages. For example, a two-step phosgenation process for producing PDI in a stirred tank reactor was also introduced in a patent.18 Another gas-phase phosgenation of 1,5-pentanediamine (PDA) to produce PDI was, implemented by Covestro.19 Phosgene and PDA were vaporized by heating to 230–320 °C, respectively, then the two gas flows were mixed with the inert gas flow into a static mixer to produce PDI.15 In addition, 1,5-pentanediamine hydrochloride by Li Wei15 was also used to prepare PDI in STR. PDI is provided by Gansu Yinguang Juyin Chemical Industry Co., Ltd, and in its two-step phosgene process, PDA reacts with phosgene in o-dichlorobenzene at 60 °C to give 1,5-pentadicarbamoyl chloride and PDA hydrochloride. Then heated to 120 °C, PDA hydrochloride continues to undergo a substitution reaction with phosgene, and 1,5-pentadicarbamoyl chloride is dechlorinated to obtain PDI, and the reaction process is shown in Fig. 1.
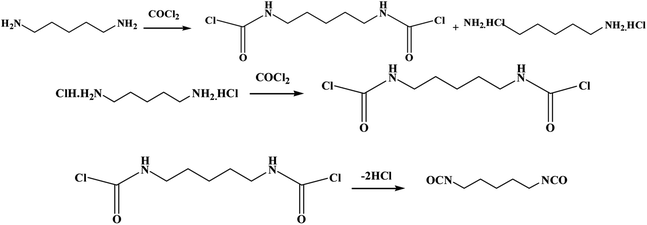 | ||
| Fig. 1 Reaction equation for the synthesis of pentamethylene diisocyanate groups by bio-based pentanediamine. | ||
After the phosgene gasification reaction of PDA, the by-products in the phosgene reaction solution include a large amount of dissolved phosgene and hydrogen chloride, compounds containing alkene bond chlorine, ureas and char residue.15 The phosgene and hydrogen chloride dissolved in the actinic reaction solution are highly corrosive to the equipment, and it is necessary to remove them by introducing nitrogen. After the removal of phosgene and hydrogen chloride, the system pressure is reduced to 300 Pa (absolute pressure), and the liquid phase temperature is increased to 120 °C to obtain the crude fraction PDI.7,20 This process is separated from the heavy phase impurities urea and char residue of the photochemical liquid. The crude PDI product is refined by distillation technology to obtain qualified products. The unsatisfactory distillation yield is not achieved because the isocyanate group is a group with active chemical properties and side reactions occur during the distillation process. T. Nakagawa, H. Takeuchi, K. et al. reported that the yield of single-effect vacuum distillation purification PDI can reach 76%.20 During the distillation process, PDI purity decreases over time or as the temperature increases, as color substances such as char residue are generated. The color of the PDI obtained by vacuum distillation is acceptable because a higher distillation temperature is not required to separate dichlorobenzene from PDI. At present, the impurities of bio-based PDI are relatively complex and the cost of separation and purification is high, which limits the industrialization process and downstream applications of PDI.
Physical properties and properties method are fundamental, critical, and necessary for separation schemes and separation process simulations. However, the physical properties of PDI are poorly reported, and there is no data on it in the Aspen database. In the process of PDI synthesis, these substances involved (hydrogen chloride, phosgene, o-dichlorobenzene, PDI, recombinant fractions) have large differences in boiling points, so in the distillation process, the separation difficulty is light, and the vapor–liquid phase is flat. The scale model has less influence on the results. We use the model PENG-ROB, which refers to Li14 and W. Lian-ying21 to apply the PENG-ROB in the TDI synthesis process and has good experimental results. Currently, the differential scanning calorimetry (DSC) curves were used to determine the melting points and characterize the thermal properties of the specimens.22–24 Kim used DSC analysis confirmed bonds had formed between the HDI and the other polymers and that the chemical bonding had influenced the thermal behavior.25 Lenzi discussed the state of their modeling, from first-principle studies to atomistic molecular dynamics, simulations, and coarse-grained approaches, highlighting the recent advances in atomistic modeling about NCO.24 Chen studied the first high-temperature endotherm (T1) behavior in relation to the amorphous hard-segment Tg (Tgh) high-temperature endotherm (T1) of polyurethane, that, based on 4,4-diphenylmethane diisocyanate (MDI) and 1,4-butanediol (BD).25,26
Distillation is one of the key technologies to separate mixtures.27,28 However, the high boiling point of PDI requires high energy consumption for distillation. At present, with the sharp increase of global energy consumption and the rapid growth of energy costs, it is urgent to find green technologies that can significantly save energy.29 Therefore, many studies have focused on low-energy distillation purification technology.30,31 In order to reduce the energy consumption and improve the thermal efficiency of distillation, many improved technologies were proposed, such as partition tower technology, heat pump distillation technology, and multi-effect distillation technology. Pandit and Jana used a dividing wall column to simulate the distillation purification process of a benzene–toluene–xylene system and a benzene–toluene–ethylbenzene system, and found that 23% of the capital cost and 45% of the operation cost could be saved.31 Yang et al. used the Aspen Plus heat pump distillation to simulate the distillation process of trichlorobenzene, and reduce energy consumption by 32.70% and 83.50%, save the total annual cost (TAC) by 12.40% and 22.90%.14 Multi-effect distillation has been used industrially in part because of its low energy cost, and has made significant breakthroughs in seawater desalination33–36 and separation of mixtures. In a multi-effect distillation system, the top steam of the former distillation tower is used as the heating medium of the reboiler for the latter distillation tower.37–41 Except for the distillation towers at both ends of the process, the intermediate distillation units do not require additional heating or cooling, which has obvious energy-saving effects on the whole distillation process. In a multi-effect distillation system, the total temperature difference between the reboiler of the first column and the reboiler of the last column is distributed in each column; this implies that the temperature difference for each column decreases as the column number increases. To meet the specified evaporation rate of rebuilders, heat transfer areas have to be increased.
In this study, physical properties were measured by means of DSC, and simple equations were developed that calculate the heat capacity (cp). The technical-economic effects of the PDI crude solution distillation purification process were studied by using the conventional single-effect distillation and double-effect distillation. Using PDI crude solution (PDI concentration of 31.50 wt%, o-dichlorobenzene of 68.40 wt%, benzoyl chloride of 0.10 wt%) as raw material, different distillation processes were established, and Aspen Plus42,43 was used to simulate each process in order explore the specific differences and application of different distillations.
2. Experiments and methods
2.1 PDI partial property detection
Differential scanning calorimetry (DSC) measurements were performed using a DSC-Q2000 calorimeter (TA Instruments, Milford, MA, USA). The specimens were heated at 3 °C min−1 and scanned several times under nitrogen in the range from 10 to 65.00 °C. The melting temperatures (Tm) were determined from the main peaks in the initial DSC curves. The glass-transition temperatures (Tg) were calculated based on the midpoints of the change in the heat capacity, as indicated in the DSC scans.2.2 Aspen simulation
The simulated distillation used a packed distillation column, and the top condenser was cooled by cooling water, while the bottom reboiler was heated by medium-pressure steam with Aspen Plus. The basic simulation conditions, such as feed conditions, project objectives, and utility settings, are shown in Table 1.| Feed conditions | |
| Feed rate | 12.00 t h−1 |
| Mass fraction | PDI: 31.50% |
| o-Dichlorobenzene: 68.40% | |
| Benzoyl chloride: 0.10% | |
| Feed temperature | 25.00 °C |
![[thin space (1/6-em)]](https://www.rsc.org/images/entities/char_2009.gif) |
|
| Project objectives | |
| Product purity | PDI ≧ 99.90% |
| Product yield | PDI ≧ 99.00% |
| Impurity | Benzoyl chloride ≦ 100.00 ppm |
![[thin space (1/6-em)]](https://www.rsc.org/images/entities/char_2009.gif) |
|
| Utility settings | |
| Heating steam pressure | 4.00 MPa |
| Heating steam temperature | 250.00 °C |
| Cooling water upper temperature | 33.00 °C |
| Cooling water return temperature | 38.00 °C |
2.3 Conventional single-effect batch distillation
Distillation at reduced pressure was carried out in a 5.00 L flask with a height of 100.00 cm distillation column filled with θ rings (2.00 × 2.00 mm). The reflux ratio in the distillation process was 1.00 and the full reflux time was 30.00 min. The reboiler power of distillation was 850.00 w, and 25.00 °C constant temperature condensate was used for product cooling at the top of the column. During the batch distillation process, a total of 8.00 L of raw materials were added in batches. All electricity consumption data was measured using a watt hour meter. Assays were performed at pressures ranging 6.00–22.00 kPa.2.4 Technical-economic analysis
Refer to X. Gao44 using ASPEN to simulate and optimize distillation methanol–chlorobenzene, a series of formulas used to calculate total annual charge (TAC). TAC includes the investment cost and the annual operating cost, assuming a payback period of 5 years, and operating hours of 24 h per day and 300 days per year. An expression for the TAC can be described by eqn (1):
 | (1) |
The investment cost includes the costs of the distillation column, heat exchanger, and other equipment; the annual operating cost mainly includes the costs of electricity for vacuum pumps, electricity for compressor, booster pumps, and cooling water, as well as the cost of heating steam.
The height of the distillation column can be calculated by eqn (2):
 | (2) |
The investment cost of the distillation column can be calculated by eqn (3):
Column shell cost = 16![[thin space (1/6-em)]](https://www.rsc.org/images/entities/char_2009.gif) 870 × D1.01 × H0.8 870 × D1.01 × H0.8
| (3) |
The investment cost of the heat exchanger can be calculated by eqn (4):
| Total heat exchanger cost = 8496 × SC0.65 + 8496 × SR0.65 | (4) |
 | (5) |
 | (6) |
Investment cost can be calculated by eqn (7):
| Investment cost = (3) + (4) | (7) |
The cost of cooling water can be calculated by eqn (8):
| Cooling water cost = 0.574 × 24 × 300 × Q × E | (8) |
The cost of heating steam can be calculated by eqn (9):
| Heating steam cost = 30.8 × 24 × 300 × Wh | (9) |
The cost of electricity can be calculated by eqn (10):
| Electricity cost = 0.162 × 24 × 300 × Qe | (10) |
Operating cost can be calculated by the eqn (11):
| Operating cost = (8) + (9) + (10) | (11) |
3. Results and discussion
3.1 Estimated physicochemical parameters of PDI
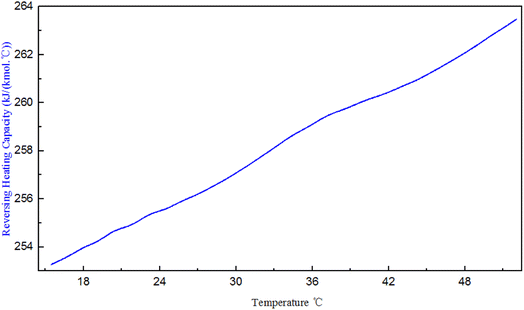
The PENG-ROB model used in this study is based on the group contribution method and provides the ability to predict activity coefficients in systems for which experimental data are insufficient.18 In this study, simple equations were developed that calculate the cp of PDI. The data is illustrated in Fig. 2, Curves of cp – temperature for various isocyanates, like as hexamethylene diisocyanate (HDI), diphenylmethane-4,4-diisocyanate (MDI), toluene-diisocyanate (TDI), and N-butyl-isocyanate (N-BUTI), recommended by Aspen Plus, the following methodology was employed. Except for the slope of the PDI simulation is varying at 25 °C, heat capacity was assumed to be a linear function of temperature: cp = A + B × T.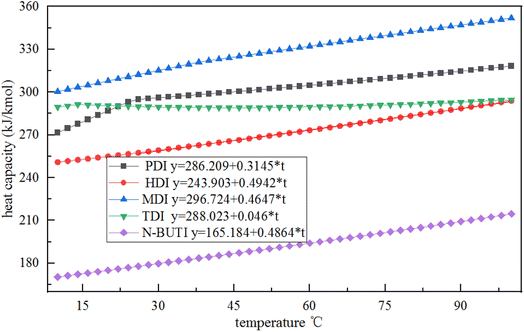 | ||
| Fig. 2 Plots of the heat capacity of various isocyanates as a function of temperature recommended by the Aspen database. | ||
We infer that it is because other isocyanates exist in the Aspen database, they have more experimental data, and their properties are complete. The specific heat capacity of PDI is simulated based on key experimental data. The specific heat capacity is measured based on the change in energy from room temperature to a specified temperature. The slope of PDI varies at 25 °C, possibly due to the commonly used room temperature value of 25 °C.
Where the cp values of PDI predicted with the Aspen Plus, are compared with the experimental data. However, the Aspen overestimates the experimental cp, with errors of about 16% for the case shown in Fig. 3. Kallitsis et al.32 corrected the model parameters of imidazolium ionic liquids heat capacity, showing that the corrected model predictions are reliable and have little error. The experimental data obtained by using DSC to test the specific heat of a known standard sapphire, which is then used to test the specific heat of a known quality sample PDI. The DSC curve of PDI in Fig. 3 is a straight line like other isocyanate specific heat capacity curves in the aspen database. The linear relationship between the specific heat capacity temperature is: cp = 248.9 + 0.277 × T, R = 0.997. The slope of the straight line by the experimental data is consistent with the slope given by Aspen, so the correction of intercepts is necessary. While in order to give PDI a predictive character to the new model:
| Amodified Aspen prediction = Adata |
As shown in Fig. 4, the new simple predictive equations are quite reliable leading to small errors for PDI which experimental data are available.
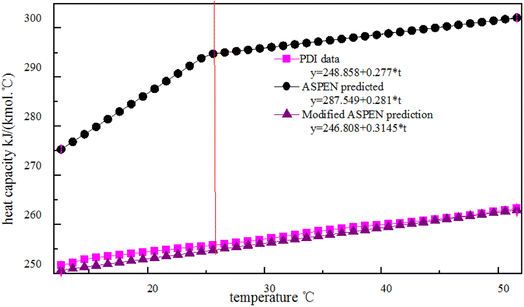 | ||
| Fig. 4 Plots of the heat capacity of temperature for PDI experimental data, Aspen predicted and modified Aspen prediction model. | ||
Since the physical properties of PDI were incomplete, the physical properties of PDI were first estimated using Aspen's own physical properties estimation system. W. Lian-ying et al.21 and Li et al.14 have both applied the PENG-ROB model into the simulation system of TDI. Based on this isolated knowledge, three activity coefficient models were developed: WILSON, non-random two-liquid (NRTL), and PENG-ROB. In order to determine the feasibility of the three activity coefficient methods, batch distillation experiment was carried out respectively, and the results showed that PENG-ROB model was more suitable for the distillation separation of PDI (Table 2). The key experimental data latent heat of vaporization (DHLV) that obtained with DSC in a nitrogen atmosphere for the estimation is 132![[thin space (1/6-em)]](https://www.rsc.org/images/entities/char_2009.gif) 823.46 kJ kmol−1. Ideal gas Gibbs energy of formation of PDI takes the value of HDI in the Aspen database. These key parameters play an important role in improving accuracy during PDI simulation. Estimated physicochemical parameters of PDI as showed in Table 3.
823.46 kJ kmol−1. Ideal gas Gibbs energy of formation of PDI takes the value of HDI in the Aspen database. These key parameters play an important role in improving accuracy during PDI simulation. Estimated physicochemical parameters of PDI as showed in Table 3.
| Parameter | Simulation result | Batch distillation result |
|---|---|---|
| The temperature of top | 98.8 °C | 98 °C |
| The temperature of bottom | 178.3 °C | 177 °C |
| The purity of PDI | 99.9% | 99.8% |
| The recovery rate of PDI | 99% | 99% |
| Pure component property | Estimated value | Pure component property | Estimated value |
|---|---|---|---|
| Critical temperature (K) | 679.98 | Standard heat at 25 °C (J kmol−1) | −1.98 × 10⁸ |
| Critical pressure (N m−2) | 3.29 × 10⁶ | Acentric factor | 0.72 |
| Critical volume (m3 kmol−1) | 0.40 | Heat of vap at TB (J kmol−1) | 5.2 × 10⁷ |
| Critical compressibility factor | 0.23 | Liquid mol vol at TB (m3 kmol−1) | 0.14 |
| Vapor pressure at TB (kPa) | 101.33 | Parachor | 327 |
| At 0.9 × TC (N m−2) | 1.20 × 10⁶ | Vapor pressure at TB (N m−2) | 3.29 × 10⁶ |
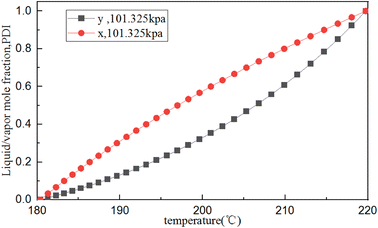
The PENG-ROB model, suitable for obtaining reasonable interaction parameters,45 is selected to describe the phase equilibrium data. Based on the above estimated physicochemical parameters for PDI, the T–X (y) phase equilibrium diagram of PDI/o-dichlorobenzene was simulated using Aspen Plus. Fig. 5 shows the phase diagram of temperature (T) versus PDI mole fraction (y) (that is, the equilibrium between temperature and liquid and vapor components) at a pressure of 100 kPa, which indicates that the crude PDI mixture can be purified by distillation.
3.2 Conventional single-effect distillation
Distillate and residue percentages were reported in Table 4. During the vacuum distillation, bottom temperatures and top temperatures will also increase with the increase of absolute pressure. The corresponding heating consumption and cooling energy consumption in the distillation process will also increase. Taking into account the yields obtained, and with the aim of avoiding reacting in the distillation residue, 10 kPa was selected as the most appropriate pressure. The higher the temperature of bottom, the lower the purity of the residue and the greater the viscosity, indicating the higher the side reaction. Zeng also indicates that the higher the temperature of PDI, the higher the side reaction.7| Absolute pressure (kPa) | 6 | 10 | 16 | 22 |
|---|---|---|---|---|
| Distillate (%) | 80.7 | 80.6 | 80.2 | 79.7 |
| Distillate GC purity (%) | 99.89 | 99.91 | 99.93 | 99.91 |
| Residue (%) | 19.3 | 19.4 | 19.8 | 20.3 |
| Residue GC purity (%) | 98.6 | 98.7 | 98.2 | 97.8 |
| Bottom temperatures (°C) | 165.0 | 176.0 | 192.0 | 203.0 |
| Top temperatures (°C) | 162.5 | 173.0 | 188.0 | 197.5 |
| Power consumption (kW h) | 0.96 | 0.94 | 0.98 | 1.01 |
| Total power cost ($/3.6 t) | 19.91 | 19.50 | 20.33 | 20.95 |
Table 5 lists the TAC of the conventional single-effect distillation at different operating pressures. The reduction of the operating pressure of the distillation column resulted in a decreased reflux ratio, which suggests that the heat duty of the reboiler decreased, and the decreased heat transfer area was able to meet the heat duty demand of the reboiler. The duty of the condenser continued to decrease with decreasing operating pressure, but the low operating pressure led to low heat transfer efficiency, and the heat transfer area of the condenser continued to increase. The diameter of the distillation column increased with the decrease of the operating pressure, which led to the continuous increase of the investment cost of the column. The data indicate that the lowest TAC was achieved with an operating pressure of 20.00 kPa.
| Operating pressure (kPa) | 60.00 | 50.00 | 40.00 | 30.00 | 20.00 | 10.00 |
|---|---|---|---|---|---|---|
| Reflux ratio | 0.52 | 0.48 | 0.44 | 0.40 | 0.36 | 0.30 |
| Height (m) | 5.53 | 5.53 | 5.53 | 5.53 | 5.53 | 5.53 |
| Number of stages | 30.00 | 30.00 | 30.00 | 30.00 | 30.00 | 30.00 |
| Feed stage | 16.00 | 16.00 | 16.00 | 16.00 | 16.00 | 16.00 |
| Diameter (m) | 1.37 | 1.38 | 1.40 | 1.42 | 1.45 | 1.54 |
| Column shell cost (103 $) | 91.07 | 91.74 | 93.09 | 94.43 | 96.44 | 102.49 |
| Reboiler duty (kW) | 1804.84 | 1753.47 | 1695.52 | 1627.33 | 1541.33 | 1415.25 |
| Condenser duty (kW) | 983.20 | 969.56 | 955.72 | 941.26 | 925.64 | 907.35 |
| Heat transfer area of reboiler (m2) | 252.81 | 197.57 | 157.37 | 126.39 | 101.17 | 78.91 |
| Heat transfer area of condenser (m2) | 77.27 | 83.8 | 93.69 | 110.67 | 148.43 | 345.11 |
| Total heat exchanger cost (103 $) | 368.39 | 332.08 | 308.36 | 297.08 | 307.2 | 433.53 |
| Operating cost (103 $) | 1366.69 | 1356.12 | 1347.94 | 1339.58 | 1326.91 | 1315.48 |
| Investment cost (103 $) | 459.46 | 423.82 | 401.45 | 391.51 | 403.64 | 536.02 |
| TAC (103 $) | 1458.58 | 1440.88 | 1428.23 | 1417.88 | 1407.63 | 1422.68 |
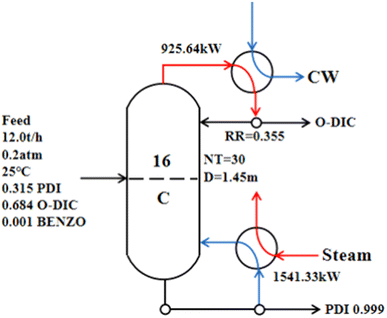
Using the 20.00 kPa operating pressure condition and a column diameter of 1.45 m, the reflux ratio was 0.35, the condenser duty was 925.64 kW, and the reboiler duty was 1541.33 kW (Fig. 6). However, due to the conventional single-effect distillation needs to deal with a large amount throughput, energy consumption and the TAC was still high. Distillation is a high-energy-consumption process. Economic optimization is an important and necessary engineering aspect of modern distillation.46,47 The combination of the atmospheric pressure column and the negative pressure column was adopted to carry out double-effect distillation of PDI, and the appropriate conditions were determined to obtain a minimal TAC.
3.3 Double-effect distillation
Based on the results of the conventional single-effect distillation, the number of stages and feed stage for the double-effect distillation were consistent with that of the conventional single-effect distillation. Operation parameters of different double-effect distillation are presented in Fig. 7. PDI was obtained by the following: parallel double-effect distillation from the reboiler of column C1 and C2; advection double-effect distillation from the reboiler of column C2; countercurrent double-effect distillation from the reboiler of column C2. The purity of all distilled PDI reached 99.9%.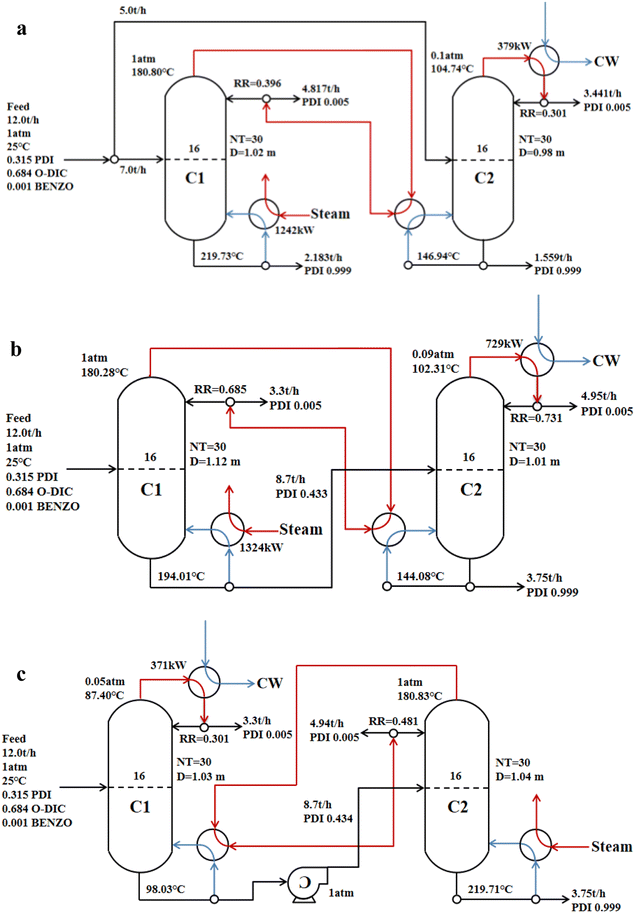 | ||
| Fig. 7 Operation parameters of different double-effect distillations (a) parallel double-effect distillation; (b) advection double-effect distillation; (c) countercurrent double-effect distillation. | ||
In the double-effect distillation process, the main energy consumption was from heating steam, condensing cooling, and the vacuum pump. Table 6 provides a comparison of energy consumption between the conventional single-effect distillation and double-effect distillation. The results show that the energy consumptions of double-effect distillations were significantly lower than the energy consumption of the conventional single-effect distillation in the process of PDI distillation purification. The energy-saving efficiency of parallel double-effect distillation and countercurrent double-effect distillation reached 33.74% and 36.09%, respectively, while the energy saving efficiency of advection double-effect distillation only reached 16.42%. The negative pressure column C1 in the countercurrent double-effect distillation utilized less raw material liquid, so the energy consumption required by the negative pressure column was lower, and the overall energy consumption was the lowest. Heat pump assisted multiple columns distillation process possesses impressive advantages in the cost and energy reduction of the conventional distillation process.48
| Parameter | Conventional single-effect distillation | Parallel double-effect distillation | Advection double-effect distillation | Countercurrent double-effect distillation |
|---|---|---|---|---|
| Cooling water consumption (kg h−1) | 25![[thin space (1/6-em)]](https://www.rsc.org/images/entities/char_2009.gif) 120.3 120.3 |
13![[thin space (1/6-em)]](https://www.rsc.org/images/entities/char_2009.gif) 189.56 189.56 |
15![[thin space (1/6-em)]](https://www.rsc.org/images/entities/char_2009.gif) 182.1 182.1 |
9064.75 |
| Heating steam consumption (kg h−1) | 803.46 | 481.58 | 525.53 | 736.42 |
| Reboiler electricity consumption (106 kJ h−1) | 5.55 | 4.47 | 4.77 | 4.29 |
| Condenser electricity consumption (106 kJ h−1) | 3.33 | 1.37 | 2.63 | 1.34 |
| Vacuum energy consumption (kW h−1) | 20.00 | 24.50 | 22.80 | 25.00 |
| Total electricity consumption (106 kJ h−1) | 8.95 | 5.93 | 7.48 | 5.72 |
| Electricity saving efficiency | — | 33.74% | 16.42% | 36.09% |
| Cooling water saving efficiency | — | 47.49% | 39.56% | 63.91% |
| Heating steam saving efficiency | — | 40.06% | 34.59% | 8.34% |
In this study, a 250Y packing distillation column was used to calculate the size of the distillation column, and the heat transfer areas of the reboiler and condenser were calculated. The equipment investment cost was evaluated by comparing the column diameter and the required heat exchanger area, and the total cost required by each distillation model was calculated. The TAC was compared to conventional single-effect distillation and the calculated results are shown in Table 7. It shows the column shell cost of double-effect distillation increased due to the addition of a distillation column compared with the conventional single-effect distillation, while the heat exchanger cost increased or decreased due to the different heat exchange areas. It is worth noting that the operating costs of the three modes of double-effect distillations were reduced than the conventional single-effect distillation. Based on a 5 year payback period, the TAC value of the parallel double-effect distillation was $937,690, which was 33.39% less than the TAC value of the conventional single-effect distillation. Combined with the energy consumption in Table 6 and TAC in Table 5, parallel double-effect distillation had more advantages in energy-savings and investment costs. Gu et al. used double-effect heat integration (DEHI) to separate a tetrahydrofuran–methanol–water mixture, for which the TAC (3 years payback period) was reduced by 25.1% compared with the conventional process.49,50
| Parameter | Conventional single-effect distillation C | Parallel double-effect distillation | Advection double-effect distillation | Countercurrent double-effect distillation | |||
|---|---|---|---|---|---|---|---|
| C1 | C2 | C1 | C2 | C1 | C2 | ||
| Column shell cost (103 $) | 96.44 | 132.53 | 141.24 | 137.22 | |||
| Total heat exchanger cost (103 $) | 307.20 | 286.14 | 324.55 | 266.06 | |||
| Operating cost (103 $) | 1326.91 | 853.96 | 1051.96 | 868.16 | |||
| Investment cost (103 $) | 403.64 | 418.67 | 465.79 | 403.28 | |||
| TAC (103 $) | 1407.63 | 937.69 | 1145.12 | 948.92 | |||
| TAC savings | — | 33.39% | 18.65% | 32.58% | |||
4. Conclusion
In this study, a new PDI heat capacity prediction method was established as cp = (248.9 + 0.277 × T) kJ kmol−1 °C−1, and PDI with a purity of 0.99 are obtained from the raw material by vacuum distillation. The energy consumption and TAC for distillation purification of a crude solution of PDI by conventional single-effect distillation, double-effect distillation were estimated by Aspen Plus. Parallel double-effect distillation produced total electricity saving, cooling water saving, and heating steam saving 33.74%, 47.49%, and 40.06%, respectively. The parallel double-effect distillation process had the best TAC savings, reduced by 33.39%. Considering the energy-saving efficiency and TAC, the parallel double-effect distillation is more suitable for PDI distillation purification. This study has important guiding significance for the distillation purification and cost control of bio-based chemical products.Conflicts of interest
There are no conflicts to declare.Acknowledgements
This work was supported by the National Key Research and Development Program of China (2020YFE0100100 and 2018YFA0901500), Joint Funds of the National Natural Science Foundation of China (U21B2097), Basic Science (Natural Science) Research Project of Jiangsu Province Colleges and Universities (21KJB530014), and the Jiangsu Synergetic Innovation Center for Advanced Bio-Manufacture.Notes and references
- V. García-Pacios, V. Costa, M. Colera and J. M. Martín-Martínez, Prog. Org. Coat., 2011, 71, 136–146 CrossRef.
- A. Kausar, Polym. Int., 2018, 67, 1470–1477 CrossRef CAS.
- P. Król, B. Król, J. Kozakiewicz, S. Zapotoczny, B. Pilch-Pitera and S. Kozdra, Prog. Org. Coat., 2015, 81, 72–79 CrossRef.
- D. K. Chattopadhyay and K. V. S. N. Raju, Prog. Polym. Sci., 2007, 32, 352–418 CrossRef CAS.
- X. Kong, G. Liu and J. M. Curtis, Int. J. Adhes. Adhes., 2011, 31, 559–564 CrossRef CAS.
- A. Moubarik, A. Allal, A. Pizzi, F. Charrier and B. Charrier, Eur. J. Wood Wood Prod., 2009, 68, 427–433 CrossRef.
- J. Zeng, Y. Yang, Y. Tang, X. Xu, X. Chen, G. Li, K. Chen, H. Li, P. Ouyang, W. Tan, J. Ma, Y. Liu and R. Liang, Ind. Eng. Chem. Res., 2022, 61, 2403–2416 CrossRef CAS.
- H. Ma, Y. Liu, J. Guo, T. Chai, Y. Yu, J. Yuan, S. Jing, F. Feng, L. Zhong, Y. Zhou, Q. Zhang and G. Wang, Coatings, 2020, 10, 1072 CrossRef.
- Z. Xingang and L. Pingkuo, Renewable Sustainable Energy Rev., 2013, 18, 194–202 CrossRef.
- M. Melchiors, M. Sonntag, C. Kobusch and E. Jürgens, Prog. Org. Coat., 2000, 40, 99–109 CrossRef CAS.
- A. Tenorio-Alfonso, M. C. Sánchez and J. M. Franco, Polymers, 2017, 9, 132–145 CrossRef PubMed.
- T. Seidel, L.-M. Ränger, T. Grützner and M. Bortz, Comput. Chem. Eng., 2022, 157, 107607 CrossRef CAS.
- G.-d. Yu, J.-l. Li, L.-z. Gong, Y.-g. Chen, L.-f. Ni, L. Peng, Z.-w. Jiang, L.-b. Yang and Y.-S. Duh, J. Therm. Anal. Calorim., 2020, 146, 2323–2331 CrossRef.
- Y. Li and J. Chen, Chem. Eng. Process., 2020, 154, 107933 CrossRef CAS.
- W. Li, H. Li, C. Wu, B. Han, P. Ouyang and K. Chen, Chem. Eng. J., 2021, 425, 131527 CrossRef CAS.
- J. Hu, Z. Chen, Y. He, H. Huang and X. Zhang, Res. Chem. Intermed., 2016, 43, 2799–2816 CrossRef.
- J. Feng, Q. Lu, W. Tan, K. Chen and P. Ouyang, Front. Chem. Sci. Eng., 2018, 13, 80–89 CrossRef.
- G. Montante, D. Horn and A. Paglianti, Chem. Eng. Sci., 2008, 63, 2107–2118 CrossRef CAS.
- Covestro Deutschland AG, US Pat., US10173970B2, 2019 Search PubMed.
- Mitsui Chemicals, Inc., US Pat., US20160090368A1, 2016 Search PubMed.
- W. Lian-ying, Mod. Chem. Ind., 2012, 32, 101–103 Search PubMed.
- Mitsui Chemicals, Inc., US Pat., US20210380528A1, 2021 Search PubMed.
- D. H. Park, G. P. Park, S. H. Kim and W. N. Kim, Macromol. Res., 2013, 21, 852–859 CrossRef CAS.
- V. Lenzi, A. Crema, S. Pyrlin and L. Marques, Polymers, 2022, 14, 1462 CrossRef PubMed.
- W. J. Seo, Y. T. Sung, S. J. Han, Y. H. Kim, O. H. Ryu, H. S. Lee and W. N. Kim, J. Appl. Polym. Sci., 2006, 101, 2879–2883 CrossRef CAS.
- X. Wu, J. Man, S. Liu, S. Huang, J. Lu, J. Tai, Y. Zhong, X. Shen, S. Cui and X. Chen, Ceram. Int., 2021, 47, 26668–26677 CrossRef CAS.
- H. Li, Y. Wu, X. Li and X. Gao, Chem. Eng. Technol., 2016, 39, 815–833 CrossRef CAS.
- Y. Xu, Y. Tang, C. He, Y. Shu, Q. L. Chen and B. J. Zhang, Chem. Eng. Process., 2022, 177, 108982 CrossRef CAS.
- M. F. Malone, R. S. Huss and M. F. Huss, Environ. Sci. Technol., 2003, 37, 5325–5329 CrossRef CAS PubMed.
- C. Zhang, H. Q. Liang, Z. K. Xu and Z. Wang, Advanced Science, 2019, 6, 1900883 CrossRef CAS PubMed.
- S. R. Pandit and A. K. Jana, Sep. Purif. Technol., 2022, 297, 121437 CrossRef CAS.
- K. Kallitsis, V. Koulocheris, G. Pappa and E. Voutsas, Appl. Therm. Eng., 2023, 233, 121201 CrossRef CAS.
- A. Liponi, C. Wieland and A. Baccioli, Energy Convers. Manage., 2020, 205, 112337 CrossRef.
- A. Liponi, C. Tempesti, A. Baccioli and L. Ferrari, Energies, 2020, 13, 3864 CrossRef CAS.
- S. Liu, Z. Wang, M. Han and J. Zhang, J. Cleaner Prod., 2021, 295, 126340 CrossRef CAS.
- A. Baccioli, M. Antonelli, U. Desideri and A. Grossi, Energy, 2018, 161, 456–469 CrossRef CAS.
- X. Li, C. Cui, H. Li and X. Gao, Sep. Purif. Technol., 2019, 228, 115760 CrossRef CAS.
- X. Li, X. Yang, S. Wang, J. Yang, L. Wang, Z. Zhu, P. Cui, Y. Wang and J. Gao, Process Saf. Environ. Prot., 2019, 128, 85–94 CrossRef CAS.
- J. A. Carballo, J. Bonilla, L. Roca, A. de la Calle, P. Palenzuela, D. C. Alarcón-Padilla and M. Berenguel, Energy Convers. Manage., 2020, 210, 112705 CrossRef.
- B. Han, Z. Liu, H. Wu and Y. Li, Desalination, 2014, 344, 391–395 CrossRef CAS.
- I. N. Caxiano, P. G. Junqueira, P. V. Mangili and D. M. Prata, Chem. Eng. Process., 2020, 147, 107784 CrossRef CAS.
- X. Gao, Z. Ma, L. Yang and J. Ma, Ind. Eng. Chem. Res., 2013, 52, 11695–11701 CrossRef CAS.
- M. Zhu, Y. Hou, N. Yu, M. Chen, Z. Ma and L. Sun, Chin. J. Chem. Eng., 2018, 26, 1837–1844 CrossRef CAS.
- X. Gao, Z. Ma, L. Yang and J. Ma, Ind. Eng. Chem. Res., 2013, 52, 11695–11701 CrossRef CAS.
- S. Hu, J. Li, Q. Wang and W. Yang, Chin. J. Chem. Eng., 2022, 45, 111–120 CrossRef CAS.
- Z. Xiong, K. Guo, H. Cai, H. Liu, W. Xiang and C. Liu, Chem. Eng. Sci., 2021, 238, 116597 CrossRef CAS.
- S. Jia, X. Qian, X. Liu, Y. Luo and X. Yuan, Chem. Eng. Sci., 2022, 260, 117924 CrossRef CAS.
- G. Miao, Y. Ma, C. Yang, B. Tong, G. Li and J. Xiao, Chem. Eng. Sci., 2023, 269, 118449 CrossRef CAS.
- J. Gu, X. You, C. Tao and J. Li, Chem. Eng. Process., 2019, 142, 107546 CrossRef.
- L. C. B. A. Bessa, F. R. M. Batista and A. J. A. Meirelles, Energy, 2012, 45, 603–612 CrossRef CAS.
Footnote |
| † Contributed equally to this work. |
| This journal is © The Royal Society of Chemistry 2023 |

