DOI:
10.1039/D3RA06348H
(Paper)
RSC Adv., 2023,
13, 31881-31890
The effect of MnCO3 on the gain coefficient for the 4I13/2 → 4I15/2 transition of Er3+ ions and near-infrared emission bandwidth flatness of Er3+/Tm3+/Yb3+ co-doped barium zinc silicate glasses†
Received
18th September 2023
, Accepted 17th October 2023
First published on 31st October 2023
Abstract
The roles of Mn2+ ions in the MnCO3 compound, leading to the formation of an Mn2+–Yb3+ dimer and affecting the gain coefficient for the 4I13/2 → 4I15/2 transition of Er3+ ions and near-infrared (NIR) emission bandwidth flatness of Er3+/Tm3+/Yb3+ co-doped in SiO2–ZnO–BaO (SZB) barium zinc silicate glasses, were investigated in this work. The composition of all elements from the original raw materials that exist in the host glasses was determined using energy-dispersive X-ray spectroscopy (EDS). Under the excitation of a 980 nm laser diode (LD), the NIR emission of Er3+/Tm3+/Yb3+-co-doped SZB glasses produced a bandwidth of about 430 nm covering the O, E, and C bands. The effects of Mn2+ ions and the Mn2+–Yb3+ dimer on the gain coefficient for the 4I13/2 → 4I15/2 transition of Er3+ ions and bandwidth flatness of NIR emission of Er3+/Tm3+-co-doped and Er3+/Tm3+/Yb3+-co-doped SZB glasses were also assigned. The optimal molar concentration of Mn2+ ions was determined such that the NIR bandwidth flatness of Er3+/Tm3+/Yb3+-co-doped SZB glasses was the flattest. In addition, the role of Mn2+ ions in reducing the gain coefficient for the 4I13/2 → 4I15/2 transition of Er3+ ions was also calculated and discussed.
1. Introduction
The near-infrared (NIR) emission spectra of rare earth ions (REIs), such as Pr3+, Er3+, Tm3+, and Ho3+ ions, in the wavelength range from ∼1200 to 2000 nm with the coverage of long-band (L-band), ultra-band (U-band), and (L + U)-bands have been of interest to researchers due to their expected applications in optical amplifiers and fibre lasers.1–3 The NIR emission spectra of the Er3+-doped peak at about 1545 nm and of the Tm3+-doped peak at about 1769 nm, corresponding to 4I13/2 → 4I15/2 (ref. 4) and 3F4 → 3H6 transitions, respectively, have been widely investigated because of their typical applications in an erbium-doped fiber amplifier (EDFA)5,6 and a thulium-doped fiber amplifier (TDFA).7 While Er3+ ions can be directly excited by commercial wavelengths of both 808 nm LD and 980 nm LD,1,5,6,8 Tm3+ ions can only be directly excited by the wavelength of an 808 nm LD but not by a 980 nm LD.9,10 Therefore, for the NIR emission spectra of Tm3+-doped and Er3+/Tm3+-co-doped glasses using a commercial wavelength 980 nm LD for excitation, Yb3+ ions are often introduced as a sensitizer or for a cooperative energy transfer (CET) process through dimers/trimers such as a Yb3+–Yb3+ dimer,11 Cr3+–Yb3+ dimer,12 Mn2+–Yb3+ dimer,13,14 or Mn2+–Mn2+–Yb3+ trimer4,15 for direct excitation by the commercial wavelength of a 980 nm LD.16 Among the dimers, the Mn2+–Yb3+ dimer formed by transition metal ions Mn2+ and Yb3+ ions is commonly used for the CET process of NIR emission spectra of Tm3+ doped or Er3+/Tm3+ co-doped in host glasses.13,14,17 In addition to expanding the NIR spectral bandwidth for REIs, recent studies have also focused on investigating and finding solutions to flatten the NIR spectral bandwidth of these REIs to optimize the obtained NIR spectral bandwidth for optical applications.18–22 In our previous studies,23,24 we investigated, calculated, and reported solutions to widen the bandwidth as well as to enhance the near-infrared bandwidth flatness of Tm3+-doped, Ho3+-doped, Tm3+/Ho3+-co-doped, and Ho3+/Tm3+/Yb3+-co-doped glasses.19,23 The obtained results indicated that the NIR bandwidth flatness of Tm3+-doped, Ho3+-doped, Tm3+/Ho3+-co-doped, and Ho3+/Tm3+/Yb3+co-doped glasses was significantly improved by the presence of Mn2+ ions and an Mn2+–Yb3+ dimer in the host glasses.13,14,23
Following the positive results described above, in this work, we continue to examine and report the effects of Mn2+ ions and Mn2+–Yb3+ dimers on the gain coefficient for the 4I13/2 → 4I15/2 transition of Er3+ ions and NIR emission bandwidth flatness of Er3+/Tm3+/Yb3+-co-doped barium zinc silicate glasses with the aim of clarifying the roles of Mn2+ ions in the MnCO3 compound in the formation of an Mn2+–Yb3+ dimer. Remarkably, we have attempted to determine not only the optimal BFN_NIR emission of Er3+/Tm3+/Yb3+-co-doped SZB glasses but also the optimal molar concentration of Mn2+ ions in the MnCO3 compound such that the BFN_NIR emission of Er3+/Tm3+/Yb3+-co-doped SZB glasses is a maximum. In addition, the role of Mn2+ ions in the MnCO3 compound in reducing the gain coefficient for the 4I13/2 → 4I15/2 transition of Er3+ ions was also examined. The obtained results are able to guide the selection of more optimal materials for EDFA and TDFA optical amplifiers.
2. Experimental details
2.1. Materials
In this experiment, the glass materials are fabricated by the conventional melting method. All the raw materials consisting of SiO2, ZnO, BaO, TiO2, MnCO3, Er2O3, Tm2O3, and Yb2O3 used in this study are laboratory reagents with high purity (99.99%). The abbreviations, chemical compositions, and detailed molar ratios are listed in Table 1.
Table 1 Detailed chemical composition and concentration ratios of SiO2–ZnO–BaO–TiO2–Er2O3–Tm2O3–MnCO3–Yb2O3 barium zinc silicate glasses
| Name of glass sample |
Details of composition and molar concentration (in mol%) |
| SiO2 |
ZnO |
BaO |
TiO2 |
Er2O3 |
Tm2O3 |
MnCO3 |
Yb2O3 |
| SZB-2Mn2Yb |
45 |
26 |
17 |
8 |
0 |
0 |
2 |
2 |
| SZB-0.5Er |
45 |
26 |
20.5 |
8 |
0.5 |
0 |
0 |
0 |
| SZB-1Tm |
45 |
26 |
20 |
8 |
0 |
1 |
0 |
0 |
| SZB-0.5Er2Yb |
45 |
26 |
18.5 |
8 |
0.5 |
0 |
0 |
2 |
| SZB-0.5Er2Yb2Mn |
45 |
26 |
16.5 |
8 |
0.5 |
0 |
2 |
2 |
| SZB-0.5Er2Yb2.5Mn |
45 |
26 |
16 |
8 |
0.5 |
0 |
2.5 |
2 |
| SZB-0.5Er2Yb3Mn |
45 |
26 |
15.5 |
8 |
0.5 |
0 |
3 |
2 |
| SZB-0.5Er2Yb3.5Mn |
45 |
26 |
15 |
8 |
0.5 |
0 |
3.5 |
2 |
| SZB-0.5Er2Yb4Mn |
45 |
26 |
14.5 |
8 |
0.5 |
0 |
4 |
2 |
| SZB-1Tm2Yb |
45 |
26 |
18 |
8 |
0 |
1 |
0 |
2 |
| SZB-1Tm2Yb2Mn |
45 |
26 |
16 |
8 |
0 |
1 |
2 |
2 |
| SZB-1Tm2Yb2.5Mn |
45 |
26 |
15.5 |
8 |
0 |
1 |
2.5 |
2 |
| SZB-1Tm2Yb3Mn |
45 |
26 |
15 |
8 |
0 |
1 |
3 |
2 |
| SZB-1Tm2Yb3.5Mn |
45 |
26 |
14.5 |
8 |
0 |
1 |
3.5 |
2 |
| SZB-1Tm2Yb4Mn |
45 |
26 |
14 |
8 |
0 |
1 |
4 |
2 |
| SZB-0.5Er1Tm2Yb |
45 |
26 |
17.5 |
8 |
0.5 |
1 |
0 |
2 |
| SZB-0.5Er21TmYb2Mn |
45 |
26 |
15.5 |
8 |
0.5 |
1 |
2 |
2 |
| SZB-0.5Er1Tm2Yb2.5Mn |
45 |
26 |
15 |
8 |
0.5 |
1 |
2.5 |
2 |
| SZB-0.5Er1Tm2Yb3Mn |
45 |
26 |
14.5 |
8 |
0.5 |
1 |
3 |
2 |
| SZB-0.5Er1Tm2Yb3.5Mn |
45 |
26 |
14 |
8 |
0.5 |
1 |
3.5 |
2 |
| SZB-0.5Er1Tm2Yb4Mn |
45 |
26 |
13.5 |
8 |
0.5 |
1 |
4 |
2 |
2.2. Experimental methods
Approximately 12 g of the mixtures of raw materials were weighed for each glass sample using an electronic analytical balance. After being finely ground using an onyx mortar and pestle, these mixtures were compressed into a platinum crucible and were then heated in a German-manufactured Nabertherm electric furnace at 1580 °C for a continuous period of 50 minutes, under an air atmosphere.23 In the process of fabrication of the host glass and the glass doped with rare earth elements, the raw material mixtures after fine grinding are often heated at a temperature that is equal to or greater than the glass transition temperature of the raw materials, (abbreviated Tg). This temperature Tg is related to the melting point temperature of the materials (Tm) through the expression  .24,25 In the experiment in this study, the SiO2, ZnO, TiO2, BaO, Er2O3, Tm2O3, and Yb2O3 raw material mixtures have melting points greater than 1580 °C. However, we chose the material melting temperature of 1580 °C23 at which these material mixtures are melted enough to form glasses.23,24 In the next step, the melted mixtures were poured into a mold and quenched on the surface of a stainless steel plate to form the raw glass. To increase the mechanical strength and remove thermal strain from the raw glass, all raw glass samples were annealed at ∼500 °C for a continuous period of 12 hours.17,19,23,26 The glass samples used for optical measurements were cut to a size of ∼10 mm × 10 mm × 2 mm. The edges and surfaces of these glass samples were then thoroughly polished.
The EDS spectrum was carried out using field emission scanning electron microscopy (FE-SEM), with a Jeol JSM-6510LV. Optical transmittance spectra of the glass within the wavelength range of 350 to 2000 nm were carried out using a Hitachi U-4100 UV/VIS/NIR spectrophotometer. NIR emission spectra of the glass within the wavelength range of 1300 to 2100 nm were measured using a Zolix SBP300 spectrophotometer with an InGaAs detector under excitation by a 980 nm LD. Optical transmittance and NIR emission spectra measurements as well as EDS analysis of the glass samples were performed at ambient temperature.17,19
3. Results and discussion
3.1. EDS analysis
To determine whether the elements in the original raw material still exist in the glass materials after fabrication, we conducted an EDS analysis for the SZB-0.5Er1Tm2Yb2Mn glass sample, and the analyzed results within the energy range from 0 to 10 keV are plotted in Fig. 1. The energy levels of each element are listed in detail in Table 2. The obtained results of the EDS spectrum analysis of the SZB-0.5Er1Tm2Yb2Mn glass sample confirmed that the C, Ti, O, Ba, Zn, Si, Mn, Tm, Er, and Yb elements were still present in the SiO2–ZnO–BaO–TiO2–Er2O3–Tm2O3–MnCO3–Yb2O3 glass matrix.27,28 It should be noted that the Mn element has many different valence states, including +2, +3, +4, +5, +6, and +7 valences. When the MnCO3 compound is introduced into the host glasses, the Mn element exists almost exclusively in the Mn 2p1 and Mn 2p3 valence states and this was investigated through XPS analysis and reported in a previous study.17 Following the results achieved on the behavior of the MnCO3 compound doped into barium zinc silicate glasses, the goal of this work is mainly to focus on investigating the role of Mn2+ ions in the MnCO3 compound for combining to form an Mn2+–Yb3+ dimer and transferring energy to Er3+ and Tm3+ ions to enhance the NIR emission intensity of Er3+/Tm3+/Yb3+-co-doped barium zinc silicate glasses under 980 nm LD excitation.
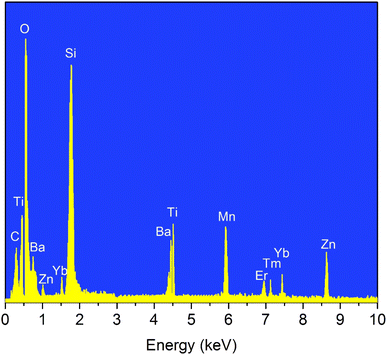 |
| | Fig. 1 EDS spectral analysis of the SZB-0.5Er1Tm2Yb2Mn glass sample. | |
Table 2 Details of the energy levels of the elements in the EDS spectral analysis
| Energy |
Element |
| C |
Ti |
O |
Ba |
Zn |
Si |
Mn |
Er |
Tm |
Yb |
| Lα (keV) |
0.278 |
0.452 |
0.526 |
0.971 |
1.012 |
1.741 |
0.638 |
1.405 |
7.179 |
1.521 |
| Kα (keV) |
|
4.509 |
|
4.466 |
8.629 |
|
5.895 |
6.946 |
|
7.415 |
3.2. Optical transmittance spectra
In Fig. 2(A), optical transmittance spectra of the SZB-0.5Er, SZB-0.5Er2Yb2Mn, SZB-1Tm, and SZB-1Tm2Yb2Mn glass samples are shown in curves (a), (b), (c) and (d), respectively. Curve (a) shows the optical transmittance spectra of the Er3+-doped sample in which seven optical transmittance bands can be observed corresponding to the 4I15/2 → 4G11/2, -4F7/2, -2H11/2, -4S3/2, -4F9/2, -4I11/2 and -4I13/2 transitions of Er3+ ions.29,30 Curve (b) shows the optical transmittance spectrum of the Er3+/Yb3+/Mn2+-co-doped sample in which nine optical transmittance bands can be observed, among which, one corresponds to the 6A1g → 4T1g transition of Mn2+ ions,13,14,17 one corresponds to the 2F7/2 → 2F5/2 transition of Yb3+ ions,27,28 and the remaining seven correspond to the 4I15/2 → 4G11/2, -4F7/2, -2H11/2, -4S3/2, -4F9/2, -4I11/2 and -4I13/2 transitions of Er3+ ions.30,31 Curve (c) shows the optical transmittance spectra of the Tm3+-doped in SZB-1Tm glass sample in which five optical transmittance bands can be observed corresponding to the 3H6 → 1G4, -3F2,3, -3H4, -3H5, and -3F4 transitions of Tm3+ ions. Curve (d) shows the optical transmittance spectra of the Tm3+/Yb3+/Mn2+ co-doped in SZB-1Tm2Yb2Mn glass sample in which seven optical transmittance bands can be observed, among which, one corresponds to the 6A1g → 4T1g transition of Mn2+ ions,13,14,17 one corresponds to the 2F7/2 → 2F5/2 transition of Yb3+ ions,27,28,31 and the remaining five optical transmittance bands correspond to the 3H6 → 1G4, -3F2,3, -3H4, -3H5, and -3F4 transitions of Tm3+ ions.27,28
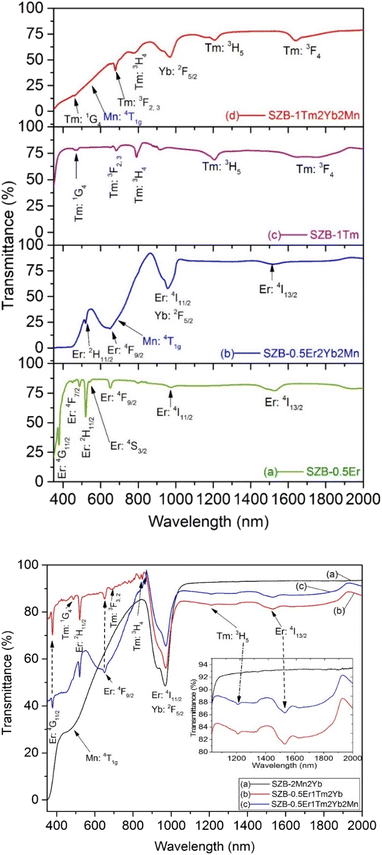 |
| | Fig. 2 (A) Optical transmittance spectra of the SZB-0.5Er, SZB-0.5Er2Yb2Mn, SZB-1Tm, and SZB-1Tm2Yb2Mn glass samples. (B) Optical transmittance spectra of the SZB-2Mn2Yb, SZB-0.5Er1Tm2Yb, and SZB-0.5Er1Tm2Yb2Mn glass samples. | |
To more clearly observe the optical transmittance spectra of Er3+, Mn2+, and Yb3+ ions, we measured and further analyzed the optical transmittance spectra of the SZB-2Mn2Yb, SZB-0.5Er1Tm2Yb, and SZB-0.5Er1Tm2Yb2Mn glass samples. The analyzed results of these optical transmittance spectra are plotted in Fig. 2(B). The obtained results displayed in curve (c) of Fig. 2(B) indicate that we can also observe all nine optical transmittance bands corresponding to 6A1g → 4T1g of Mn2+ ions, 2F7/2 → 2F5/2 of Yb3+ ions,4,11,13,14,17 and the 4I15/2 → 4G11/2, -4F7/2, -2H11/2, -4S3/2, -4F9/2, -4I11/2, -4I13/2 transitions of Er3+ ions,4,30,31 similar to the analysis above. Interestingly, the analyzed results reveal that the transmittance spectrum of the SZB-0.5Er1Tm2Yb2Mn glass samples containing Mn2+ components in the wavelength region of ∼380–900 nm was decreased whereas the optical transmittance spectrum in the wavelength region of ∼900–2000 nm was increased compared to SZB-0.5Er1Tm2Yb glass samples without Mn2+ components. Also from the results displayed in Fig. 2(B), it can be seen that the optical transmittance spectrum of the SZB-2Mn2Yb glass sample within the wavelength range ∼1000–2000 nm is higher than that of the SZB-0.5Er1Tm2Yb or SZB0.5Er1Tm2Yb2Mn glass samples. For the SZB-0.5Er1Tm2Yb and SZB0.5Er1Tm2Yb2Mn glass samples, in addition to the Mn2+ and Yb3+ components, there are also Er3+ and Tm3+ components with absorption peaks at about 1230 nm and 1542 nm in the wavelength range ∼1000 to 2000 nm, corresponding to the 3H6 → 3H5 transition of Tm3+ ions and the 4I15/2 → 4I13/2 transition of Er3+ ions, respectively. Part of the excitation energy is thus absorbed in the wavelength region from ∼1000 to 2000 nm, which does not occur for the SZB-2Mn2Yb glass sample. This is the reason why the transmittance spectrum of the SZB-2Mn2Yb sample is higher than those of the other glass samples.
3.3. NIR emission spectra
NIR emission spectra of the SZB-0.5Er2YbxMn (x = 0, 2, 2.5, 3, 3.5, and 4 mol%) glass samples under 980 nm LD excitation are plotted in Fig. 3. For the SZB-0.5Er2Yb glass sample, the NIR emission of Er3+/Yb3+-co-doped peaks at ∼1542 nm corresponds to the 4I13/2 → 4I15/2 transition of Er3+. With the increased concentrations of the MnCO3 compound from 2 up to 4 mol%, the NIR emission intensity of the Er3+/Yb3+-co-doped peaks at ∼1542 nm was significantly increased. Moreover, the NIR emission peak of Er3+ tends to split and shift the peaks by Δλ = 1553 − 1542 nm = 11 nm. The main reason for the increase in NIR emission intensity of Er3+/Yb3+-co-doped peaks at ∼1542 nm can be attributed to the combination between Yb3+ and Mn2+ ions in the MnCO3 compound leading to the formation of Mn2+–Yb3+ dimers13,32 contributing to the energy transfer (ET) to the 4I13/2 → 4I15/2 transition of Er3+ ions.13,23 The formation of an Mn2+–Yb3+ dimer can be interpreted with the result shown in Fig. 3, where the Er3+ and Yb3+ concentrations are unchanged when the concentration of the MnCO3 compound increases from 2 up to 4 mol%, and the NIR emission intensity of the Er3+/Yb3+-co-doped peaks at ∼1542 nm under the excitation of 980 nm LD was significantly increased. However, the Mn2+ ions cannot receive the direct excitation of the 980 nm LD, proving that Mn2+ ions combine with the Yb3+ ions to form an Mn2+–Yb3+ dimer,13,23 and therefore, the Mn2+–Yb3+ dimers receive the excitation of the 980 nm LD and transfer energy from the Mn2+–Yb3+ dimer to the 4I13/2 → 4I15/2 transition of Er3+ ions.13,23 The addition of MnCO3 compound into the host glass efficiently promotes not only the formation of the Mn2+–Yb3+ dimer but also contributes to breaking of the O–Zn, Si–O, Si–O–Si, Zn–O–Zn, and Si–O–Zn bonds,33 subsequently creating new non-bridging oxygens (NBOs), like Mn–O, Mn–Si, Si–O–Mn, Mn–O–Mn, and Mn–O–Zn bonds.34,35 Therefore, we believe that the presence of Mn2+ ions in the MnCO3 compound contributed to shifting the NIR emission peak at the 4I13/2 → 4I15/2 transition of Er3+ ions.
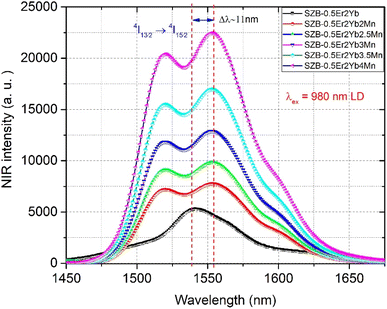 |
| | Fig. 3 NIR emission spectra of the SZB-0.5Er2YbxMn (x = 0, 2, 2.5, 3, 3.5, and 4 mol%) glass samples. | |
We also investigated the effects of Mn2+ on the NIR emission bandwidth flatness (NIR_EBF) parameter of Er3+/Yb3+ co-doped in SZB glasses. The NIR_EBF parameter of Er3+/Yb3+ co-doped in SZB glasses can be calculated based on the NIR emission spectra of Er3+/Yb3+ co-doped in SZB glasses with the following formula:19,23
| |
 | (1) |
where
I(
n) is the NIR emission intensity of Er
3+/Yb
3+ co-doped in SZB glasses within the analytical data range
n of the NIR emission wavelength
N.
19,23 NIR_EBF takes a value from 0 to 1.
19,23 The value of NIR_EBF is equal to 1 when all values of
I(
n) are equal.
19,23 The NIR_EBF calculated results of Er
3+/Yb
3+ co-doped in SZB glasses displayed in
Fig. 4 show that with increasing concentrations of Mn
2+ ions, the NIR_EBF of Er
3+/Yb
3+ co-doped in SZB glasses gradually decreased.
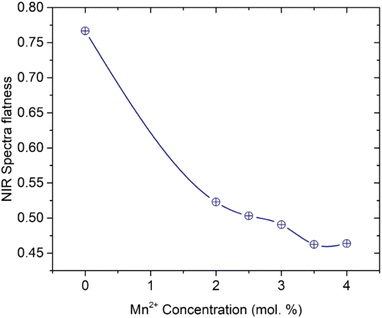 |
| | Fig. 4 Relationship between NIR spectra flatness of the SZB-0.5Er2YbxMn (x = 0, 2, 2.5, 3, 3.5, and 4 mol%) glass samples and molar concentration of Mn2+ ions. | |
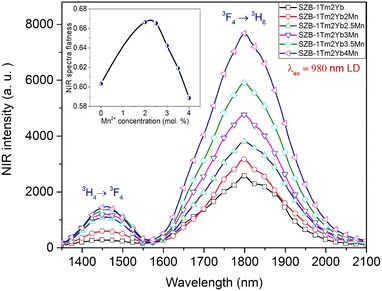
Similarly, the NIR emission spectra of SZB-1Tm2YbxMn (x = 0, 2, 2.5, 3, 3.5, and 4 mol%) glass samples under excitation of 980 nm LD are plotted in Fig. 5 and indicate that the NIR emission of the Tm3+/Yb3+-co-doped sample has two peaks at about ∼1457 and ∼1801 nm, corresponding to the 3H4 → 3F4 and 3F4 → 3H6 transitions of Tm3+ ions.36,37 Along with the increase in MnCO3 concentration from 2 up to 4 mol%, the NIR emission intensity of Tm3+/Yb3+-co-doped peaks at ∼1457 and ∼1801 nm was also significantly increased. This result is due to the ET processes from the Mn2+–Yb3+ dimer to the 3H4 → 3F4 and 3F4 → 3H6 transitions of Tm3+ ions.17
 |
| | Fig. 5 NIR emission spectra of the SZB-1Tm2YbxMn (x = 0, 2, 2.5, 3, 3.5, and 4 mol%) glass samples. | |
Formula (1) continued to be used to calculate the NIR_EBF spectra of Tm3+/Yb3+-co-doped samples when the molar concentration of the MnCO3 compound increases from 0 up to 4 mol% and the results of the calculation are shown in the insert to Fig. 5. These results show that the NIR_EBF spectra of the Tm3+/Yb3+-co-doped sample reached the optimal value of 0.668 when the molar concentration of the MnCO3 compound was 2 mol%. Energy levels of Er3+, Tm3+, Yb3+ ions, the Mn2+–Yb3+ dimer and mechanisms of the ETI (I = 1, 2, 3, 4, and 5) processes in the SZB glass system are shown in Fig. 6. Mechanisms of the ETI (I = 1, 2, 3, 4, and 5) processes between the Mn2+–Yb3+ dimer with Er3+, Tm3+ ions were also reported and discussed in detail in our previous studies.17,26 These ETI (I = 1, 2, 3, 4, and 5) processes can be described in detail in the form of the following equations:
| ET1: 2F5/2(Yb3+) + 3H5(Tm3+) → 2F7/2(Yb3+) + 3H6(Tm3+).17 |
| ET2: |2F5/2, 6A1〉(Mn2+–Yb3+) + 3H5(Tm3+) → |2F7/2, 6A1〉(Mn2+–Yb3+) + 3H6(Tm3+).17 |
| ET3: |2F5/2, 6A1〉(Mn2+–Yb3+) + 4I11/2(Er3+) → |2F7/2, 6A1〉(Mn2+–Yb3+) + 4I15/2(Er3+).17,23 |
| ET4: 2F5/2(Yb3+) + 4I11/2(Er3+) → 2F7/2(Yb3+) + 4I15/2(Er3+).26 |
| ET5: |2F7/2, 4T2〉(Mn2+–Yb3+) + 1G4(Tm3+) → |2F7/2, 6A1〉(Mn2+–Yb3+) + 3H6(Tm3+).17,23 |
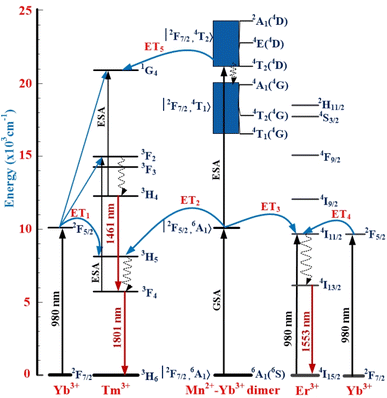 |
| | Fig. 6 Energy levels of Er3+, Tm3+, Yb3+, Mn2+–Yb3+ dimer and mechanisms of ETI (I = 1, 2, 3, 4, and 5) processes in the SZB glass system. | |
To achieve one of the main goals of this study, we investigated the effects of Mn2+ ions in the MnCO3 compound on the NIR_EBF spectra of Er3+/Tm3+/Yb3+-co-doped SZB glasses. We kept the molar compositions of the Er3+/Tm3+/Yb3+-co-doped sample to 0.5Er3+/1Tm3+/2Yb3+, and changed the molar composition of the MnCO3 compound from 2 up to 4 mol%. As shown in Fig. 7, the NIR emission spectra of SZB-0.5Er1Tm2YbxMn (x = 0, 2, 2.5, 3, 3.5, and 4 mol%) glass samples under excitation by a 980 nm LD reveal that when the molar concentration of the MnCO3 compound increases from 2 up to 4 mol%, the NIR emission intensity of the Er3+/Tm3+/Yb3+-co-doped peaks at ∼1553 and ∼1801 nm also strongly increases. This result may be due to Mn2+–Yb3+ dimers being formed during the excitation by 980 nm LD, with the energies from Mn2+ ions and Mn2+–Yb3+ dimers simultaneously transferred to Er3+ and Tm3+ ions. The NIR emission spectra of Er3+/Tm3+/Yb3+ co-doped in the SZB-0.5Er1Tm2YbxMn (x = 0, 2, 2.5, 3, 3.5, and 4 mol%) glass under 980 nm LD excitation created an NIR bandwidth of ∼430 nm. The NIR_EBF spectra of the Er3+/Tm3+/Yb3+-co-doped samples were determined when the molar concentration of Mn2+ ions in the MnCO3 compound increased from 2 up to 4 mol% using formula (1). The results of the calculation of the NIR_EBF value, given in Fig. 8, showed that the NIR_EBF spectra of the Er3+/Tm3+/Yb3+-co-doped sample reached the optimal value of 0.849 when the molar concentration of Mn2+ ions in the MnCO3 compound was 3.5 mol%.
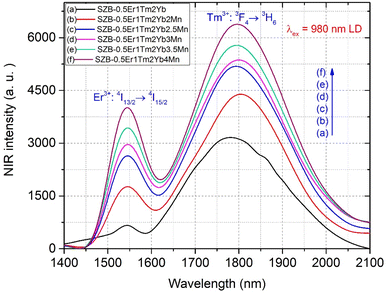 |
| | Fig. 7 NIR emission spectra of the SZB-0.5Er1Tm2YbxMn (x = 0, 2, 2.5, 3, 3.5, and 4 mol%) glass samples. | |
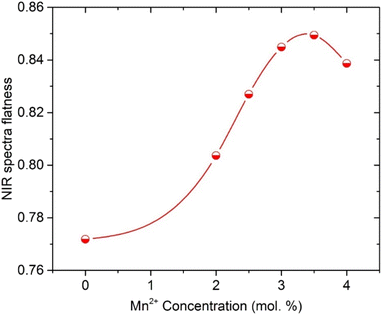 |
| | Fig. 8 The relationship between the molar concentration of Mn2+ ions and NIR_EBF parameter of the SZB-0.5Er1Tm2YbxMn (x = 0, 2, 2.5, 3, 3.5, and 4 mol%) glass samples. | |
3.4. Cross-section and gain coefficient study
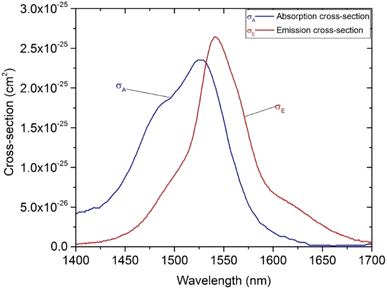
To evaluate the influence of Mn2+ ions in the MnCO3 compound on the gain coefficient of Er3+ (GEr(λ)), we first investigated and calculated the absorption cross-section σabs(λ) and emission cross-section σems(λ) for the 4I13/2 → 4I15/2 transition of Er3+ ions in the SZB glasses based on McCumber's theory.6,38,39 The value of σabs(λ) is calculated from the absorbance spectrum according to the following formula:6,38,39| |
 | (2) |
in which A(λ) is the absorbance spectrum; λ is the wavelength; C is the concentration of Er3+ ions; and d is the thickness of the SZB glass samples, where the glass sample in this study has a thickness of d = 2 mm.6,38 The absorbance spectrum A(λ) can be calculated from the transmittance spectrum T(λ) according to the formula:40,41| |
A(λ) = −log10![[thin space (1/6-em)]](https://www.rsc.org/images/entities/char_2009.gif) T(λ) = 2 − log10(% T(λ)), T(λ) = 2 − log10(% T(λ)),
| (3) |
where % T(λ) is the transmittance spectrum (measured as a percentage) determined from the experimental results in Fig. 2(A) and (B).
The value of σems(λ) is thus determined in relation to the value of σabs(λ) as follows:6,39
| |
 | (4) |
where
ZU and
ZL are the partition functions of the upper and lower manifolds, respectively;
T is the temperature;
h is Planck's constant,
k is Boltzmann's constant;
c is the speed of light;
λ is the photon wavelength;
λUL the wavelength corresponding to the transition between the bottom of the excited (upper) state manifold and the bottom of the ground (lower) state manifold.
6,35,36 The value of
σabs(
λ) for the
4I
15/2 →
4I
13/2 transition and of
σems(
λ) for the
4I
13/2 →
4I
15/2 transition of Er
3+ ions are determined as shown in
Fig. 9. The gain coefficient
G(
λ) for transitions of the REIs in the glass samples can be determined with the following formula:
6,38,39| | |
G(λ) = C·[P·σems(λ) − (1 − P)·σabs(λ)],
| (5) |
in which
P is the population inversion and
P = 0–1 stands for the ratio between the number of REIs in the excited state to the total number of REIs.
 |
| | Fig. 9 Absorption and emission cross-sections of the SZB-0.5Er glass sample. | |
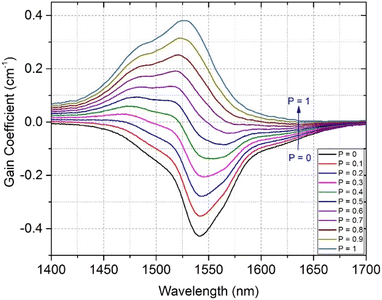
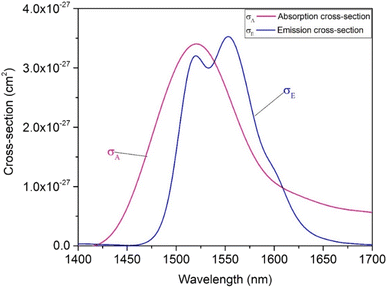
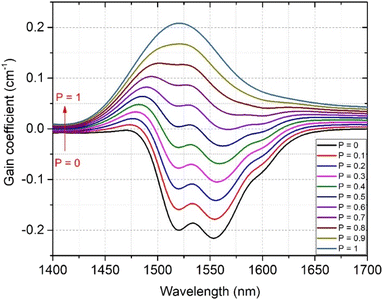
Formulae (2)–(5) are used to determine the values of σabs(λ), σems(λ), and GEr(λ), respectively, for the 4I13/2 → 4I15/2 transition of Er3+ ions in the SZB-0.5Er glass sample. The values of GEr(λ) were calculated and are shown in Fig. 10. We can observe that the GEr(λ) value becomes positive in the range wavelength of ∼1500–1600 nm for cases where P is equal to 0.5 to 1. When P is greater than 0.6, the NIR emission of the Er3+-doped SZB-0.5Er glass sample exhibits a flat net gain covering the L-, U-, and (L + U)-bands.6 At the same time, the GEr(λ) value is found to be about 0.38, corresponding to P = 1. Similarly, we also used formulae (2)–(5) to determine the values of σabs(λ), σems(λ), and GEr_Mn(λ), respectively, for the 4I13/2 → 4I15/2 transition of Er3+ ions in the SZB-0.5Er2Yb2Mn glass sample. The values of σabs(λ) and σems(λ) of the SZB-0.5Er2Yb2Mn glass sample are shown in Fig. 11 and the values of GEr_Mn(λ) for the 4I13/2 → 4I15/2 transition of Er3+ ions in the SZB-0.5Er2Yb2Mn glass sample are shown in Fig. 12. Comparison of the results in Fig. 10 and 12 shows that with the existence of Mn2+ ions in the SZB-0.5Er2Yb2Mn glass sample, the value of GEr_Mn(λ) for the 4I13/2 → 4I15/2 transition of Er3+ ions was significantly reduced. The value of GEr_Mn(λ) is found to be about 0.21 corresponding to P = 1. These GEr_Mn(λ) and GEr(λ) calculation results showed that in the presence of Mn2+ ions and an Mn2+–Yb3+ dimer, the broadband NIR emission of the 4I13/2 → 4I15/2 transition of Er3+ ions in this study can be utilized for optical amplifiers. The γG ratio between GEr_Mn(λ) and GEr(λ) is determined as follows:
| |
 | (6) |
 |
| | Fig. 10 Gain coefficient for the 4I13/2 → 4I15/2 transition of Er3+ ions in the SZB-0.5Er glass sample. | |
 |
| | Fig. 11 Absorption and emission cross-sections of the SZB-0.5Er2Yb2Mn glass sample. | |
 |
| | Fig. 12 Gain coefficient for the 4I13/2 → 4I15/2 transition of Er3+ ions in the SZB-0.5Er2Yb2Mn glass sample. | |
Based on the above results and analyses, we can confirm that in the presence of Mn2+ ions, the NIR bandwidth flatness of Er3+ ions was improved, but the gain coefficient for the 4I13/2 → 4I15/2 transition of Er3+ ions was significantly reduced. Therefore, depending on the specificity of the application in the optical amplifier, we should choose the type of SZB glass material with or without the Mn2+ component to suit the specific applications.
4. Conclusions
In this work, the effects of Mn2+ ions in the MnCO3 compound leading to the formation of an Mn2+–Yb3+ dimer and affecting the gain coefficient for the 4I13/2 → 4I15/2 transition of Er3+ ions and the NIR_EBF value of Er3+-doped and Er3+/Tm3+/Yb3+-co-doped barium zinc silicate glasses under 980 nm LD excitation were investigated. A broadband NIR emission of Er3+/Tm3+/Yb3+-co-doped barium zinc silicate glasses with an FWHM of ∼430 nm was observed. The roles of Mn2+ ions in the MnCO3 compound led to the formation of an Mn2+–Yb3+ dimer and contributed to a significant increase in the NIR_EBF value of Er3+-doped and Er3+/Tm3+/Yb3+-co-doped barium zinc silicate within the NIR wavelength range of 1600–2200 nm. The NIR_EBF value of Er3+/Tm3+/Yb3+-co-doped SZB glasses obtained at 0.849 corresponds to the molar concentration of MnCO3 compound of 3.5 mol%. However, the presence of Mn2+ ions in the SZB glass composition also led to a significant decrease in the gain coefficient for the 4I13/2 → 4I15/2 transition of Er3+ ions. The results obtained in this study will be able to guide the selection of glass material compositions for applications in optical amplifiers in the future.
Conflicts of interest
There are no conflicts of interest to declare.
Acknowledgements
This research was supported by Project of the TNU-University of Sciences in Vietnam under Grant number CS2023-TN06-10. The corresponding author (Ho Kim Dan) would like to express his gratitude to Van Lang University.
References
- H. K. Dan, N. M. Ty, V. H. Nga, D. T. Phuc, A.-L. Phan, D. C. Zhou and J. B. Qiu, Broadband flat near-infrared emission and energy transfer of Pr3+–Er3+–Yb3+ tri-doped niobate tellurite glasses, J. Non-Cryst. Solids, 2020, 549, 120335, DOI:10.1016/j.jnoncrysol.2020.120335.
- D. C. Zhou, R. F. Wang, Z. W. Yang, Z. G. Song, Z. Y. Yin and J. B. Qiu, Spectroscopic properties of Tm3+ doped TeO2–R2O–La2O3 glasses for 1.47 μm optical amplifiers, J. Non-Cryst. Solids, 2011, 357, 2409–2412, DOI:10.1016/j.jnoncrysol.2010.12.027.
- S. M. Li, L. H. Zhang, X. J. Tan, W. Deng, M. Z. He, G. Z. Chen, M. Xu, Y. L. Yang, S. L. Zhang, P. X. Zhang, Z. Q. Chen and Y. Hang, Growth, structure, and spectroscopic properties of a Tm3+, Ho3+ co-doped Lu2O3 crystal for ∼2.1 μm lasers, Opt. Mater., 2019, 96, 109277, DOI:10.1016/j.optmat.2019.109277.
- P. X. Le, N. M. Ty, J. B. Qiu, D. C. Zhou and H. K. Dan, Enhanced upconversion and near-infrared emissions of co-doped Ho3+/Yb3+ in TeO2–ZnO–Na2CO3–La2O3 tellurite glasses, Opt. Mater. Express, 2019, 9, 3998–4008, DOI:10.1364/OME.9.003998.
- X. Wang, X. X. Jin, P. Zhou, X. L. Wang, H. Xiao and Z. J. Liu, High power, widely tunable, narrowband super fluorescent source at 2 μm based on a monolithic Tm-doped fiber amplifier, Opt. Express, 2015, 23(3), 3382–3389, DOI:10.1364/OE.23.003382.
- H. K. Dan, D.-N. Le, H. T. Nguyen-Truong, T. D. Tap, H. X. Vinh, N. M. Ty, R. F. Wang, D. C. Zhou and J. B. Qiu, Effects of Y3+ the enhancement NIR emission of Bi+–Er3+ co-doped in transparent silicate glass-ceramics for Erbium-doped fiber amplifier (EDFA), J. Lumin., 2020, 219, 116942, DOI:10.1016/j.jlumin.2019.116942.
- P. Peterka, I. Kašík, V. Matějec, W. Blanc, B. Faure, B. Dussardier, G. Monnom and V. Kubeček, Thulium-doped silica-based optical fibers for cladding-pumped fiber amplifiers, Opt. Mater., 2007, 30, 174–176, DOI:10.1016/j.optmat.2006.11.039.
- Y. Guo, J. H. Xie, M. X. Yu, W. T. Huang, H. J. Yang, X. B. Li, L. X. Wang and Q. T. Zhang, The enhanced up-conversion green by Yb–Mn dimer in NaBiF4: Yb3+/Er3+/Mn2+ for optical fiber temperature sensor, J. Alloys Compd., 2021, 888, 161497, DOI:10.1016/j.jallcom.2021.161497.
- L. Z. Xia, Y. Zhang, X. J. Shen and Y. X. Zhou, Broad and flat dual-band NIR luminescence from Er3+/Tm3+/Ho3+ tri-doped tellurite glass, Opt. Lett., 2021, 46(9), 2031–2034, DOI:10.1364/OL.418971.
- N. Wang, R. J. Cao, M. Z. Cai, L. L. Shen, Y. Tian, F. F. Huang, S. Q. Xu and J. J. Zhang, Ho3+/Tm3+ codoped lead silicate glass for 2 μm laser materials, Opt. Laser Technol., 2017, 97, 364–369, DOI:10.1016/j.optlastec.2017.07.025.
- S. Ye, Y.-J. Li, D.-C. Yu, G.-P. Dong and Q.-Y. Zhang, Room-temperature upconverted white light from GdMgB5O10: Yb3+, Mn2+, J. Mater. Chem., 2011, 21, 3735–3739, 10.1039/C0JM03307C.
- S. Ye, E. H. Song, E. Ma, S. J. Zhang, J. Wang, X. Y. Chen, Q. Y. Zhang and J. R. Qiu, Broadband Cr3+-sensitized upconversion luminescence in La3Ga5GeO14: Cr3+, Yb3+, Er3+, Opt. Mater. Express, 2014, 4(4), 638–648, DOI:10.1364/OME.4.000638.
- H. K. Dan, N. L. Thai, L. D. Tin, J. B. Qiu, D. C. Zhou and Q. Jiao, Enhanced near/mid-infrared emission bands centered at ∼1.54 and ∼2.73 μm of Er3+-doped in transparent silicate glass-ceramics via Mn2+−Yb3+ dimer, Infrared Phys. Technol., 2018, 95, 33–38, DOI:10.1016/j.infrared.2018.10.009.
- J. L. Wang, E. H. Song, M. Wu, W. B. Dai, S. Ye and Q. Y. Zhang, Selectively enhanced up- and down-conversion emissions of Er3+ via Yb3+−Mn2+ dimer sensitizing in spinel MgGa2O4: Er3+, Yb3+, Mn2+, Mater. Res. Bull., 2016, 74, 340–345, DOI:10.1016/j.materresbull.2015.10.043.
- X. X. Han, E. Song, S. Zhang, S. Ye, X. Yang and Q. Zhang, Heavy Mn2+ doped near-infrared photon upconversion luminescence in Fluoride RbZnF3: Yb3+, Mn2+ guided by dopant distribution simulation, J. Mater. Chem. C, 2020, 8, 12164–12172, 10.1039/D0TC03225E.
- C. Pan, Y. Feng-Jing, Z. Zi-Zhong, H. Bo, W. Li-Bo and Z. Ya-Xun, Enhancement of 2.0 μm fluorescence emission in new Ho3+/Tm3+/Yb3+ tri-doped tellurite glasses, Optoelectron. Lett., 2016, 12(5), 0341, DOI:10.1007/s11801-016-6145-8.
- H. K. Dan, D. C. Zhou, R. F. Wang, Q. Jiao, Z. W. Yang, Z. G. Song, X. Yu and J. B. Qiu, Effect of Mn2+ ions on the enhancement red upconversion emission and energy transfer of Mn2+/Tm3+/Yb3+ tri-doped transparent glass-ceramics, Mater. Res. Bull., 2016, 73, 357–361, DOI:10.1016/j.materresbull.2015.09.019.
- L. Z. Xia, Y. Zhang, X. J. Shen and Y. X. Zhou, Broad and flat dual-band NIR luminescence from Er3+/Tm3+/Ho3+ tri-doped tellurite glass, Opt. Lett., 2021, 46(9), 2031–2034, DOI:10.1364/OL.418971.
- N. M. Ty, D. C. Zhou, J. B. Qiu and H. K. Dan, Broadband flat near/mid-infrared emissions of Tm3+-Ho3+ co-doped, and Tm3+-Ho3+-Yb3+ tri-doped zinc silicate glasses under 808 and 980 nm, Infrared Phys. Technol., 2020, 111, 103483, DOI:10.1016/j.infrared.2020.103483.
- N. Shasmal, W. J. G. J. Faria, A. S. Stucchi de Camargo and A. C. M. Rodrigues, Enhancement in green and NIR emissions of Er3+ by energy transfer from ZnSe nanoparticles in borosilicate glass, J. Alloys Compd., 2021, 863(15), 158428, DOI:10.1016/j.jallcom.2020.158428.
- A. Roy, A. Dwivedi, H. Mishra, A. K. Rai and S. B. Rai, Generation of color tunable emissions from Ho3+/Tm3+/Yb3+ co-doped YTaO4 phosphors through NIR excitation under different conditions (variation of concentration, excitation pump power and the external temperature), J. Alloys Compd., 2021, 865, 158938, DOI:10.1016/j.jallcom.2021.158938.
- M. Kochanowicz, J. Żmojda, P. Miluski, A. Baranowska, T. Ragin, J. Dorosz, M. Kuwik, W. A. Pisarski, J. Pisarska, M. Leśniak and D. Dorosz, 2 μm emission in gallo-germanate glasses and glass fibers co-doped with Yb3+/Ho3+ and Yb3+/Tm3+/Ho3+, J. Lumin., 2019, 211, 341–346, DOI:10.1016/j.jlumin.2019.03.060.
- H. K. Dan, N. D. Trung, D. C. Zhou and J. B. Qiu, Influences of Mn2+ ions, and Mn2+–Yb3+ dimer on the optical band gaps and bandwidth flatness of near-infrared emissions of Ho3+/Tm3+, Ho3+/Tm3+/Yb3+ co-doped calcium aluminosilicate glasses, J. Non-Cryst. Solids, 2023, 603, 122086, DOI:10.1016/j.jnoncrysol.2022.122086.
- H. Masai, T. Nishibe, S. Yamamoto, T. Niizuma, N. Kitamura, T. Akai, T. Ohkubo and M. Yoshida, Low melting oxide glasses prepared at a melt temperature of 500 °C, Sci. Rep., 2021, 11, 214, DOI:10.1038/s41598-020-80424-9.
- H. K. Dan, N. D. Trung, T. H. Le, N. L. Thai, N. M. Ty, D. C. Zhou and J. B. Qiu, Influence of F− on the reduction process of Eu3+ to Eu2+ and optical properties of Eu3+/Eu2+–Er3+–Yb3+ co-doped niobate silicate glasses, J. Non-Cryst. Solids, 2022, 581, 121417, DOI:10.1016/j.jnoncrysol.2022.121417.
- H. K. Dan, D. C. Zhou, R. F. Wang, Q. Jiao, Z. W. Yang, Z. G. Song, X. Yu and J. B. Qiu, Effect of Mn2+ ions on the enhancement red upconversion emission of Mn2+/Er3+/Yb3+ tri-doped in transparent glass-ceramics, Opt. Laser Technol., 2014, 64, 264–268, DOI:10.1016/j.optlastec.2014.05.002.
- Y. G. Liao, X-ray emission lines & Periodic table for EDS analysis, Practical electron microscopy and database – An Online Book, https://www.globalsino.com/EM, accessed 15 August, 2023 Search PubMed.
- H. K. Dan, N. D. Trung, N. M. Tam, L. T. Ha, C. V. Ha, D. C. Zhou and J. B. Qiu, Optical band gaps and spectroscopy properties of Bi+/Eun+/Yb3+ co-doped (m = 0, 2, 3; and n = 2, 3) zinc calcium silicate glasses, RSC Adv., 2023, 13, 6861–6871, 10.1039/d2ra07310b.
- Y. Tsang, B. Richards, D. Binks, J. Lousteau and A. Jha, A Yb3+/Tm3+/Ho3+ triply doped tellurite fiber laser, Opt. Express, 2008, 16(14), 10690–10695, DOI:10.1364/OE.16.010690.
- H. K. Dan, N. M. Ty, D. C. Zhou, J. B. Qiu and A.-L. Phan, Influence of Cr3+ on yellowish-green UC emission and energy transfer of Er3+/Cr3+/Yb3+ tri-doped zinc silicate glasses, J. Am. Ceram. Soc., 2020, 103(11), 1–13, DOI:10.1111/jace.17359.
- B. T. Huy, D. H. Kwon, S.-S. Lee, V.-D. Dao, H. B. Truong and Y.-I. Lee, Optical properties of Sr2YF7 material doped with Yb3+, Er3+, and Eu3+ ions for solar cell application, J. Alloys Compd., 2022, 897, 163189, DOI:10.1016/j.jallcom.2021.163189.
- H. K. Dan, D. C. Zhou, R. F. Wang, Q. Jiao, Z. W. Yang, Z. G. Song, X. Yu and J. B. Qiu, Effect of Mn2+ ions on the enhancement upconversion emission and energy transfer of Mn2+/Tb3+/Yb3+ tri-doped transparent glass-ceramics, Mater. Lett., 2015, 150, 76–80, DOI:10.1016/j.matlet.2015.03.005.
- W. Ahmina, M. E. Moudane, M. Zriouil and M. Taibi, Glass-forming region, structure and some properties of potassium manganese phosphate glasses, Phase Transform., 2016, 89, 1051–1061, DOI:10.1080/01411594.2016.1144057.
- J. de Clermont-Gallerande, D. Taniguchi, M. Colas, P. Thomas and T. Hayakawa, High-temperature investigation of TeO2–Na2O–ZnO glasses, Phys. Status Solidi B, 2022, 259, 2200065, DOI:10.1002/pssb.202200065.
- P. Pascuta, G. Borodi, N. Jumate, I. Vida-Simiti, D. Viorel and E. Cule, The structural role of manganese ions in some zinc phosphate glasses and glass ceramics, J. Alloys Compd., 2010, 504, 479–483, DOI:10.1016/j.jallcom.2010.05.147.
- G. Bai, Y. Guo, Y. Tian, L. Hu and J. Zhang, Light emission at 2 μm from Ho–Tm–Yb doped silicate glasses, Opt. Mater., 2011, 33(8), 1316–1319, DOI:10.1016/j.optmat.2011.03.033.
- C. Z. Wang, Y. Tian, X. Y. Gao, Q. H. Liu, F. F. Huang, B. P. Li, J. J. Zhang and S. Q. Xu, Mid-infrared fluorescence properties, structure and energy transfer around 2 μm in Tm3+/Ho3+ co-doped tellurite glass, J. Lumin., 2018, 194, 791–796, DOI:10.1016/j.jlumin.2017.09.052.
- G. Y. Zhao, L. Z. Xu, S. H. Meng, C. B. Du, J. S. Hou, Y. F. Liu, Y. Y. Guo, Y. Z. Fang, M. S. Liao, J. Zou and L. L. Hu, Facile preparation of plasmon enhanced near-infrared photoluminescence of Er3+-doped Bi2O3-B2O3-SiO2 glass for optical fiber amplifier, J. Lumin., 2019, 206, 164–168, DOI:10.1016/j.jlumin.2018.10.026.
- Z. Y. Zhao, C. Liu, M. L. Xia, J. Wang, J. J. Han, J. Xie and X. J. Zhao, Effects of Y3+/Er3+ ratio on the 2.7 μm emission of Er3+ ions in oxyfluoride glass-ceramics, Opt. Mater., 2016, 54, 89–93, DOI:10.1016/j.optmat.2016.02.022.
- T. G. Mayerhöfer, S. Pahlow and J. Popp, The Bouguer-Beer-Lambert Law: Shining light on the obscure, ChemPhysChem, 2020, 21, 2029–2046, DOI:10.1002/cphc.202000464.
- N. Ilie, A. C. Ionescu, K. C. Huth and M. Moldovan, Light transmission characteristics and cytotoxicity within a dental composite color palette, Materials, 2023, 16, 3773, DOI:10.3390/ma16103773.
|
| This journal is © The Royal Society of Chemistry 2023 |
Click here to see how this site uses Cookies. View our privacy policy here.  Open Access Article
 *ab,
Nguyen Dinh Trungcd,
Nguyen Minh Tam
 e,
L. T. Ha
 *f,
Nguyen Le Thaig,
Tran Dang Thanhh,
Dacheng Zhoui and
Jianbei Qiui
 .24,25 In the experiment in this study, the SiO2, ZnO, TiO2, BaO, Er2O3, Tm2O3, and Yb2O3 raw material mixtures have melting points greater than 1580 °C. However, we chose the material melting temperature of 1580 °C23 at which these material mixtures are melted enough to form glasses.23,24 In the next step, the melted mixtures were poured into a mold and quenched on the surface of a stainless steel plate to form the raw glass. To increase the mechanical strength and remove thermal strain from the raw glass, all raw glass samples were annealed at ∼500 °C for a continuous period of 12 hours.17,19,23,26 The glass samples used for optical measurements were cut to a size of ∼10 mm × 10 mm × 2 mm. The edges and surfaces of these glass samples were then thoroughly polished.


![[thin space (1/6-em)]](https://www.rsc.org/images/entities/char_2009.gif) T(λ) = 2 − log10(% T(λ)),
T(λ) = 2 − log10(% T(λ)),


