 Open Access Article
The impact of aggregation of AIE and ACQ moiety-integrating material on the excited state dynamics †
Gui-Yuan Wu *a,
Hui-Min Zhua,
Hao Lia,
Kai Zhang
 b,
Xianyi Zhanga,
Dong Yan
 c,
Xiu-Du Zhangc,
Lili Lin
 *b and
Zhou Lu
 *a
*a
aAnhui Province Key Laboratory of Optoelectronic Material Science and Technology, School of Physics and Electronic Information, Anhui Normal University, Wuhu, 241002, China. E-mail: wgy@ahnu.edu.cn; zhoulu@ahnu.edu.cn
bShandong Province Key Laboratory of Medical Physics and Image Processing Technology, School of Physics and Electronics, Shandong Normal University, Jinan, 250014, China. E-mail: linll@sdnu.edu.cn
cKey Laboratory of Functional Molecular Solids, Ministry of Education, College of Chemistry and Materials Science, Anhui Normal University, Wuhu, 241002, China
First published on 20th November 2023
Abstract
The investigation of the properties of aggregate materials is highly interesting because the process of aggregation can result in the disappearance of original properties and the emergence of new ones. Here, a novel fluorescent material (TPEIP), which synergistically combines aggregation-induced emission (AIE) and aggregation caused quenching (ACQ) moieties, was first synthesized by the cyclization reaction of 2,3-diamino-phenazine with 4-tetraphenylenthenealdehyde. We controlled the degree of aggregation of TPEIP to shed light on the impact of the aggregation on the excited state dynamics. TPEIP aggregation realized control over the Intersystem Crossing (ISC) rates and, in turn, the suppression of triplet excited states in MeOH, EtOH or via the simple addition of water to TPEIP solutions in DMSO. From global target analysis, the time scale was 966.2 ps for ISC for TPEIP in DMSO, but it was 860 ps in the case of TPEIP solutions featuring 5% water. The dynamics of TPEIP excited states undergo significant changes as the degree of aggregation increases. Notably, the lifetime of singlet excited states decreases, and there was a gradual diminishment in triplet states.
Introduction
Aggregates have been a prominent research topic in the field of self-assembly, playing an indispensable role in the domains of biology, chemistry, and materials science.1 Specifically, aggregates are entities composed of two or more interacting components at the mesoscale, with normal dimensions ranging from nanometers to millimeters, bridging the large gap between microscopic molecules and macroscopic matter. There is plenty of room in the middle to explore and unlock the mysteries of the middle world.2 Therefore, “aggregate science” deserves more attention and exploration in its own right rather than being considered merely an “extension package” of molecular science programs. Although properties always depend on the structure–property relationship, the term “structure” no longer solely refers to the molecular chemical structure but also encompasses the mesoscopic structure of aggregates.3 Therefore, the elucidation of the relationship between aggregates and properties is imperative for the construction of novel organic compounds and the advancement of multifunctional materials.In materials science, research beyond molecules attracts more and more attention, as represented by research in molecular self-assembly, supramolecular chemistry, and nanotechnology.4 Aggregation-induced emission (AIE) and aggregation-caused quenching (ACQ) are two important optical properties of luminescent materials that aim to explore luminescence or quenching at the aggregate level.5 The two effects exhibit converse fluorescence characteristics; as the aggregation degree of molecules increases, the fluorescence intensity weakens for ACQ phores but strengthens for AIEgens. These distinct fluorescence properties of their aggregates inspire chemists to synthesize individual molecules that bind ACQ and AIE moieties, and tunable multicolour fluorescence is achieved by controlling the degree of aggregation because the π–π stacking of ACQ moieties is prevented by the twisted molecular geometry of AIE rotors in the aggregated state.6 On the other hand, temperature, solvent effect, concentration, and solubility are factors that influence molecular aggregation.7 Therefore, combining AIE and ACQ into a single molecule may integrate the strengths of both types of fluorophores and offer an alternative strategy for solvent discrimination. In addition, it is important to determine the correlation between basic aggregate-properties and relaxation dynamics of multiple organic dye molecular aggregates in order to design materials for electroluminescence, sensors, organic lasers, photocatalysis, and bioimaging.8 The degree of molecular aggregation always depends on various types of molecular interactions, including π–π stacking, hydrogen bonding, hydrophobic or electrostatic interactions, and van der Waals forces.9 All of these interactions alter the photophysical behaviors. Therefore, there is an urgent need for systematic studies on the dynamics of excited states at different degrees of molecular aggregation, which will benefit the application and development of organic dye molecules in various fields.10
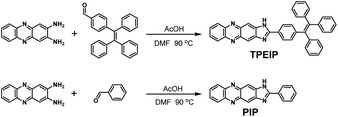
Herein, a novel fluorescent material TPEIP containing tetraphenylethylene (TPE) with a propeller shape and phenazine unit was designed and synthesized via the cyclization reaction of 2,3-diamino-phenazine with 4-tetraphenylenthenealdehyde. TPEIP possesses both AIE (TPE) and ACQ (phenazine) moieties. In methanol solvent, the fluorescence of TPEIP can be significantly quenched due to molecular aggregation and solvation effect. Therefore, the excited state dynamics of TPEIP aggregation in methanol, ethanol and DMSO/water mixture solutions were comprehensively investigated by femtosecond time-resolved transient absorption (TA) and computational studies to determine the relaxation dynamics of TPEIP molecular aggregates. Notably, the singlet state only occurred in TPEIP aggregates, and the intersystem crossing (ISC) rate can be tuned via the simple addition of water to TPEIP solutions in DMSO. Radiative transitions progressively decrease and eventually disappear with increasing degrees of TPEIP aggregation. These results not only clarify the unique excellent methanol-discriminating behavior of TPEIP but also provide an approach for determining the excited-state dynamics of molecular aggregates.
Experimental section
Synthesis of compounds TPEIP and PIP
A mixture of 2,3-diamino-phenazine (0.21 mg, 1.0 mmol), 4-(1,2,2-triphenylvinyl)benzaldehyde (1.08 g, 3 mmol), 1.0 mL acetic acid (AcOH) and N,N-dimethylformamide (DMF) were magnetically stirred and heated at 90 °C for 12 h. After cooling to room temperature, the yellow precipitate was filtrated, washed with hot absolute ethanol three times, then recrystallized with DMF-H2O to get yellow powdery product TPEIP (0.25 g, 0.45 mmol) in 45% yield, 1H-NMR (DMSO-d6, 400 MHz) 13.36 (s 1H, NH), 8.44 (s 1H, ArH), 8.23–8.21 (m 2H, ArH), 8.13 (d J = 8.36 Hz, 2H, ArH), 7.90–7.89 (m 2H, ArH), 7.24–7.13 (m 12H, ArH), 7.07–7.0 (m 6H, ArH). 13C-NMR (DMSO-d6, 100 MHz) 159.25, 147.05, 142.87, 142.68, 142.02, 141.82, 140.11, 139.78, 131.57, 130.80, 130.67, 129.82, 128.97, 128.1, 127.94, 127.37, 127.02, 126.93, 126.69. ESI-MS m/z: calcd. for C39H26N4, 550.22; Found, 551.22 (Scheme 1).Results and discussion
UV-vis absorption and fluorescence emission properties
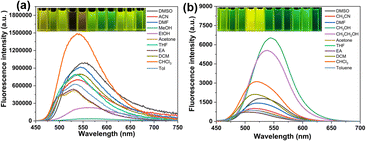
To study the spectrum of TPEIP molecule in various solvents, UV-vis and fluorescence experiments were carried out in various solvents, i.e., dimethyl sulfoxide (DMSO), acetonitrile (ACN), dimethylformamide (DMF), methanol (MeOH), ethanol (EtOH), acetone, tetrahydrofuran (THF), ethyl acetate (EA), dichloromethane (DCM), chloroform (CHCl3), toluene (Tol). In the UV-vis absorption spectra, TPEIP, which contains a conjugated phenazine group, exhibited strong absorption peaks at approximately 250–320 nm and 406–413 nm in various organic solvents with solvatochromism of about 7 nm and shoulder absorptions in the range of 450–500 nm (Fig. S1†). However, the UV-vis absorption spectra of TPEIP did not show significant dependence on solvents because neither solvent polarity nor hydrogen bonding influenced the energy levels. Furthermore, fluorescent measurements for TPEIP were performed in various organic solvents (λex = 410 nm). The photophysical properties, including the quantum yield (Φf) and fluorescence lifetime of TPEIP in various organic solvents, were summarized in Table S1.† Interestingly, the fluorescence emission intensity of TPEIP was significantly lower in methanol and ethanol compared to other organic solvents. Specifically, in methanol solvent, the fluorescence intensity was seven times weaker than that observed in ethanol (Fig. 1a). More importantly, methanol solvents can be discriminated by the naked eye as they exhibit almost no fluorescence emissions in methanol and yellow or green fluorescence in other solvents. The specificity of TPEIP fluorescence emission in methanol and ethanol was investigated by performing concentration-dependent UV absorption and fluorescence spectra of TPEIP in both solvents (Fig. S2–S4†). The TPEIP absorption peak was found to increase in proportion with concentration, surpassing the detection limit at concentrations exceeding 0.5 mM (Fig. S2†). For concentration-dependent fluorescence spectra (Fig. S3†), the fluorescence emission intensity of TPEIP initially increased, but subsequently decreased and the emission peak redshifted upon increasing the concentration. The intensity reached its maximum at a concentration of 0.02 mM, indicated ACQ behavior when the concentration exceeded 0.02 mM. The strong ACQ effect may be attributed to the π–π stacking of the nearly planar phenazine unit. Conversely, when the concentration was below 0.02 mM, weak fluorescence intensity was observed due to the solvation effect on TPEIP. The fluorescence emission color of TPEIP in EtOH under 365 nm ultraviolet light was observed with the naked eye, transitioning from colorless to yellow and then orange. However, as the concentration of TPEIP in MeOH increases, the fluorescence emission color of the solution changes from colorless to yellowish to reddish (Fig. S4†).The influence of the tetraphenyl moiety on the spectral characteristics of TPEIP molecular structure was further explored via the design and synthesis of a phenazine derivative PIP featuring an additional phenyl group. UV-vis and fluorescence experiments of PIP were also conducted in various solvents (Fig. 1 and S1†). Compared to TPEIP, PIP was more sensitive to solvent polarity in the fluorescence spectra, resulting in a redshift of the maximum fluorescence emission peak with increasing solvent polarity. In addition, the emission maxima of PIP in ethanol and methanol were 539 nm and 544 nm, respectively. This was accompanied by a significant enhancement in fluorescence emission, resulting in yellow fluorescence colors. It was difficult to distinguish between methanol and ethanol with the naked eye because PIP did not aggregate in MeOH or EtOH solvents (Fig. 1b).
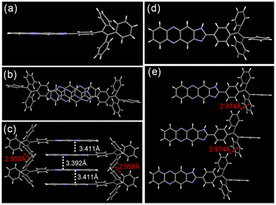
To the best of our knowledge, the aggregation-caused quenching (ACQ) effect can be induced by the aggregation of phenazine groups. Thus, we have verified whether the fluorescence quenching of TPEIP in MeOH or EtOH was caused by molecular aggregation. The dynamic light scattering (DLS) experiment proved to be an effective method for measuring solute aggregation in solution. Dynamic light scattering experiments were conducted on TPEIP (0.02 mM) in various solvents, revealing significant aggregation sizes in MeOH and EtOH. However, the aggregate size of TPEIP in other solvents was below the instrument's limit, making it impossible to determine the aggregate size. At the same concentration (0.02 mM), the average aggregation sizes of TPEIP in MeOH and EtOH were 116 nm and 193 nm (Fig. S5c†), respectively. These results fully indicate that TPEIP forms aggregates in methanol and ethanol. The concentration-dependent DLS analysis of TPEIP in EtOH and MeOH was also conducted, which revealed an increase in the average size of aggregates with higher concentrations. It was worth noting that no aggregation was observed at concentrations below 6 μM. Additionally, when comparing equivalent concentrations, the degree of aggregation in ethanol exceeded that in methanol (Fig. S5†). The aggregation of molecules depends on intermolecular interactions, such as π–π stacking, hydrogen bonding, hydrophobic or electrostatic interactions, and van der Waals forces. These interactions control the extent of molecular aggregation and influence the photophysical behaviors. To gain further insight into the molecular structure in the solid state, the crystals of TPEIP were grown for X-ray analysis by slowly evaporating their MeOH solution. The molecular structure of TPEIP was shown in Fig. 2. The 1H-imidazo[4,5-b]phenazine and phenyl group units were nearly spatially parallel in the crystal. In the packing of the crystal structure, π–π stacking interactions (centroid distances of 3.392 and 3.411 Å) can be observed between the phenazine units. Additional C–H⋯π interactions were found between the phenyl group in adjacent TPE units, leading to the formation of a 3D structure. Due to multiple weak interactions and the large steric hindrance of the TPE moiety, TPEIP exhibited a head-to-tail, antiparallel herringbone packing structure in its crystalline state, as depicted in Fig. 2c.
To further investigate the molecular ACQ effect, UV-vis and fluorescence spectra were employed to investigate the ACQ effect of TPEIP in DMSO/H2O mixture solutions with varying degrees of aggregation. The UV absorption of TPEIP decreased as the water ratio increased (Fig. S6†). In the fluorescent spectrum (Fig. S6†), the fluorescence intensity of TPEIP was significantly reduced with a redshift of approximately 15.0 nm when the H2O concentration was 10%. Within the range of 20–100% H2O content, the fluorescence intensity continued to decrease until it was completely quenched, indicating that molecular aggregation caused a rapid decline in emission intensity due to the ACQ effect resulting from an increase in H2O content. Based on other literature reports on similar structures, as well as the single crystal structure of TPEIP and the photophysical phenomena of TPEIP in methanol or ethanol. Three key factors contributed to this ACQ effect: (i) TPEIP was hydrophobic, DMSO and H2O act as good and poor solvents, respectively. The higher the water content, the greater degree of molecular aggregation; (ii) the crystal structure of TPEIP revealed a strong π–π stacking between the phenazine units, with the molecules arranged in a head-to-tail manner. This arrangement increased the distance between the two TPE units and prevented them from being closely packed. Therefore, ACQ between phenazine units was dominant in TPEIP aggregates; (iii) compared to other solvents, the fluorescence intensity of TPEIP was noticeably weaker in methanol or ethanol. In DMSO/H2O mixture solutions, H2O as a protic solvent, the fluorescence emission intensity of TPEIP is also weakened.
Theoretical simulation of TPEIP monomers absorption
The absorption spectra of TPEIP monomers in DMSO, MeOH and EtOH were calculated using density functional theory (DFT) at the M06-2X/6-31G* level (Fig. S7†). The solvent effect was considered by using the polarizable continuum model (PCM). The calculated absorption spectra corresponded to the experimental results. There were two absorption peaks in the spectra, and the highest absorption peak was induced by the electron transition from the ground state (S0) to the third excited singlet state (S3). The transition from S0 to the first singlet excited state (S1) also contributes to a weak absorption peak. The absorption spectra of the TPEIP monomers in the three solvents were almost the same. The distributions of electrons and holes in S1 and S3 were plotted in Fig. 3. It was evident that for TPEIP in the three solvents, S1 represents localized excitation (LE) states with both electrons and holes located at the 1H-imidazo[4,5-b]phenazine unit. As for S3, the transition exhibits a slight charge transfer (CT) property, which also involves the TPE unit. | ||
| Fig. 3 Electrons and holes distribution in S1 and S3 for TPEIP-monomers in DMSO, EtOH and MeOH (green represents the electron distribution, blue represents the hole distribution). | ||
Theoretical confirmation of ACQ in TPEIP
To confirm that aggregation can induce fluorescence quenching in MeOH, the light emitting properties of TPEIP monomers in MeOH and the crystal state were theoretically studied through the PCM method and the combined quantum mechanics and molecular mechanics (QM/MM) method, respectively. In the QM/MM calculation, the ONIOM model was adopted, as show in Fig. 4a. The central molecule was calculated using the QM method at the M06-2X/6-31G level, while the remaining molecules were calculated using the MM method with the UFF force field. In Fig. 4b, we find that the oscillator strength of TPEIP in the crystal state was significantly smaller than that of TPEIP monomers in MeOH solvent, resulting in weak emission in the crystal state. From the electron distributions of the highest occupied molecular orbital (HOMO) or HOMO-2 and the lowest unoccupied molecular orbital (LUMO) that contribute most to the excitation of S1, we find that the transition changes from π → π* to n → π; thus, a smaller oscillator strength was obtained in the crystal state. The calculated wavelength in the crystal state was 29 nm larger than that of the TPEIP monomers in solvent (Table S2†). The radiative rate calculated in the crystal state was approximately three orders of magnitude smaller than that in the solvent, and the nonradiative rates were almost the same in both states. Consequently, weak emission was expected for TPEIP in the crystal state. This result indicates that aggregation can influence the transition properties of excited states and thus affect the light-emitting properties, which corresponds with experimental results.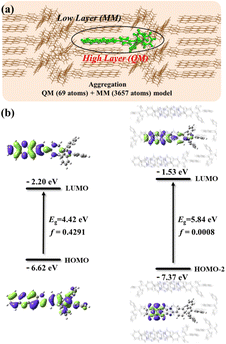 | ||
| Fig. 4 (a) ONIOM model of TPEIP calculated in crystal state. (b) Electron distribution of HOMO (HOMO-2) and LUMOs and their energy gaps for TPEIP-monomers in MeOH solvent and crystal state. | ||
Theoretical simulation of excited dynamic process
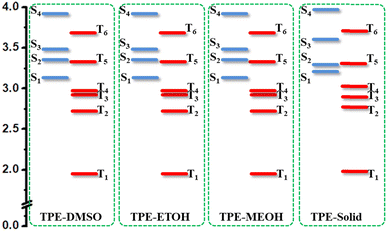
The energy diagram of TPEIP-monomer in three solvents were also plotted in Fig. 5. It was found that the energy diagram for them were quite similar. The four triplet states were lower in energy than S1. It implied that triplet states might participate in the excited states decay process. For comparison, the energy distribution of excited states for TEPIP in crystal state was also plotted in Fig. 5. It was a little different from that in solvent. In crystal state, the energy of T5 was higher than that of S2, while it was lower than S2 in solvent. In addition, the energy gap between S2 and S1 was smaller than that in solvent. It was possible that the excited states could quickly decay from S3 to S2 and S1 in crystal state, while S2 could decay to T5 by intersystem crossing due to the small energy gap between S2 and T5 as well as large energy gap between S2 and S1 in DMSO. Then T5 will decay to T2 and T1, which would induce another absorption from triplet states. It was indicated that aggregation could influence the energy diagram and also the excited dynamic processes.Ultrafast transient absorption spectra
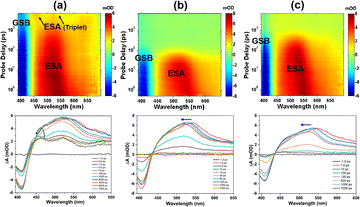
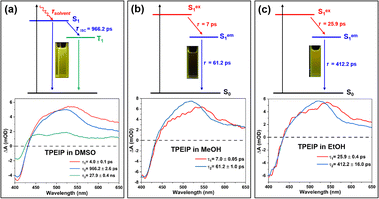
Transient absorption (TA) measurements can detect transition routes and transition rates between excited state energy levels of samples. To investigate TPEIP on the dynamics of excited states, femtosecond transient absorption spectra of TPEIP (0.02 mM) were obtained in DMSO, MeOH and EtOH at 380 nm femtosecond pulse excitation (Fig. 6). TPEIP monomer exhibited a completely different TA spectrum in DMSO compared to that in methanol and ethanol. As shown in Fig. 6a, the excited state absorption (ESA) bands exhibited a slight blueshift and intensity increase due to the solvent–solute interaction (solvation). Subsequently, the ESA intensity gradually decays and accompanied by the emergence of two new ESA bands at 460 nm and 520 nm, indicating the generation of new excited states. Then, there were barely any changes in the whole TA spectra within the 7 ns detection time window. However, the initial transient absorption spectra were almost identical in MeOH and EtOH solutions, exhibiting negative ground state bleaching (GSB) in the 400–430 nm region, positive ESA across wavelengths of 440–650 nm, and no stimulated emission (SE) band. As shown in Fig. 6b, the ESA band exhibited a significant blueshift in the first 10 ps in MeOH due to solvent–solute interaction (solvation), which has also been observed in EtOH with a longer blueshift time (100 ps). These phenomena may be caused by TPEIP aggregates' higher degree of aggregation in MeOH than in EtOH. Afterwards, the ESA band gradually decreased and disappeared, indicating a continuous return of excited-state molecules to the ground state. Interestingly, the decay time of the TPEIP excited state band in EtOH was longer than that of TPEIP in MeOH (Fig. 6c), which was consistent with the fluorescence emission lifetime of TPEIP in EtOH.Global fitting of fs-TA data was carried out to thoroughly elucidate the process of these spectral evolutions, and the time constants of the corresponding excited state processes were shown in Table 1. The target evolution models and species-associated difference spectra (SADS) were shown in Fig. 7 and S8,† while temporal concentrations of corresponding species and kinetics traces at several selected typical wavelengths were depicted in Fig. S9 and Table S3.† For the TPEIP monomers in DMSO, the first species-associated spectra (SADS-1) exhibit GSB signal at 413 nm and ESA signal at 540 nm, The time constant of the process associated with solvation-stabilization relaxation processes was 4.0 ps. This time scale indicates that the S1 excited state undergoes solvent reorganization facilitated by conformational relaxation.11 Subsequently, one section of the S1 state (the second SAS) relaxes to the S0 state, while the other section relaxes to the triplet state. Nanosecond transient absorption spectroscopy (ns-TA) was performed to characterize the triplet state under deaerated and aerobic conditions in DMSO (Fig. S10 and S11, Table S4†). The triplet lifetime of TPEIP monomers was twice as long under deaerated conditions (210 ns) than under aerated conditions (87.7 ns) in DMSO. This demonstrates that the triplet state was generated by TPEIP monomers in DMSO because oxygen could quench the triplet state. However, for TPEIP aggregates in MeOH and EtOH, there were only two SADS processes (Sex1 and Sem1).
| Solvent | τ1 (ps) | τ2 (ps) | τ3 (ns) |
|---|---|---|---|
| DMSO | 4.0 ± 0.1 | 966.2 ± 2.6 | Long-lived |
| MeOH | 7.0 ± 0.1 | 61.2 ± 1.0 | — |
| EtOH | 25.9 ± 0.4 | 412.2 ± 16.0 | — |
These phenomena suggest that aggregation inhibited intersystem crossing (ISC) (Fig. 7). The lifetimes of SADS-1 (Sex1) were 7 ps and 25.9 ps for TPEIP aggregates in MeOH and EtOH, respectively. Therefore, SADS-2 represents the geometrically relaxed S1 state (SRlx1), and the time constants of the radiative pathway were 61.2 and 412.2 ps (τ2) for TPEIP aggregates in MeOH and EtOH, respectively. Because the time constant of the radiative pathway (SRlx1) was longer in EtOH, the fluorescence emission intensity of TPEIP aggregates was weaker in MeOH than in EtOH. It was further indicated that excited state dynamics were affected by molecular aggregation.
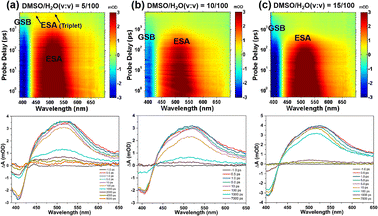
To investigate the effect of molecular aggregation on excited-state dynamics, the differential absorption 3D maps of transient absorption and the corresponding time evolutions of TPEIP in DMSO/H2O mixtures with water contents of 5%, 10%, 15%, 20%, 30%, and 40% were displayed in Fig. 8 and S12.† The TA spectral features of TPEIP in MeOH or EtOH were similar to those in water content exceeding 10%. Within the test time window, there was only a singlet signal, which gradually weakened with increasing water proportion. This suggests that the phenyl group's geometrical constraint hindered any ISC in most of the chromophores. Specifically, the restriction of rotation was caused by the proximity of individual TPEIP molecules to each other. Subsequently, ISC transitions occur during relaxation from the SRlx1 state to the triplet state T1. The decay of T1 reinstates the ground state within 11.9 ns for a water content of 5%. However, the lifetimes of the SRlx1 state were 614 ps, 398.1 ps, 256.1 ps, 155.9 ps, and 122.6 ps for water contents of 10%, 15%, 20%, 30%, and 40% respectively. In this context, the triplet state T1 was not generated for water contents greater than 5%, and the relaxation time of the SRlx1 state becomes shorter while the signal strength weakens with increasing water content ratio. Notably, the time scales of the SRlx1 state derived from single wavelength kinetics were consistent with the evolution times SADS-2, which were evaluated based on global target analysis (Fig. S15 and Tables S5, S9†). The lifetimes of the SRlx1 state in DMSO/H2O mixed solvents with 0%, 5%, 10%, 15%, 20%, 30% and 40% H2O content at a wavelength of 462 nm were as follows: 636.5 ps, 408.9 ps, 226.1 ps, 142.5 ps and 102.9 ps (Table S5†). These arguments further confirm that the fluorescence intensity of TPEIP aggregates was weaker in MeOH than in EtOH due to different degrees of aggregation.
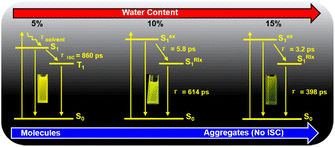
We analyze the global fitting of the 3D fs-TA data matrices to reveal individual signatures of each excited state and present the kinetic models for TPEIP in DMSO solutions with 5% (a), 10% (b), and 15% (c) water content, as depicted in Scheme 2. The population evolution of the corresponding SADS was illustrated in Fig. S9.† The initially excited state (Sex1) lifetimes were 3.9, 5.8, 3.2, 3.3, 4.6 and 4.5 ps for 5%, 10%, 15%, 20%, 30% and 40% water content, respectively (Fig. S13 and S14†). For TPEIP solutions with a water content of only 5%, the geometrically relaxed S1 state (SRlx1) was formed via state deactivation (Sex1) caused by geometrical relaxation.
Conclusions
In conclusion, we synthesize a novel tetraphenylethene-based phenazine-imidazole derivative (TPEIP) with AIE and ACQ units. TPEIP exhibits brilliant fluorescence in nonprotic solvents. However, TPEIP shows the weakest fluorescence intensity in MeOH solvent due to molecular aggregation. Different degrees of TPEIP aggregation resulted in a specific fluorescence response. The effects of TPEIP aggregation on excited states dynamics were studied in detail by TA and DFT, revealing that the rate of ISC and radiative transitions progressively decrease until they disappear with increasing degrees of TPEIP aggregation. This work provides an approach for understanding the excited-state dynamics of molecular aggregates.Author contributions
Gui-Yuan Wu: funding acquisition, project administration, resources, supervision, writing – review & editing. Hui-Min Zhu and Hao Li: formal analysis, data curation. Kai Zhang: theoretical simulation. Xianyi Zhang: project administration, supervision, writing – review & editing. Dong Yan: formal analysis, data curation. Xiu-Du Zhang: formal analysis, data curation. Lili Lin: theoretical simulation, investigation, validation. Zhou Lu: funding acquisition, supervision, writing – review & editing.Conflicts of interest
There are no conflicts to declare.Acknowledgements
We gratefully acknowledge financial support from the National Natural Science Foundation of China (21773256 and 22073001),the University Annual Scientific Research Plan of Anhui Province (2022AH010013) and Natural Science Foundation of Anhui Province (no. 2108085QB79).Notes and references
- A. P. Alivisatos, P. F. Barbara, A. W. Castleman, J. Chang, D. A. Dixon, M. L. Klein, G. L. McLendon, J. S. Miller, M. A. Ratner, P. J. Rossky, S. I. Stupp and M. E. Thompson, Adv. Mater., 1998, 10, 1297 CrossRef CAS; Y. Tu, Z. Zhao, J. W. Y. Lam and B. Z. Tang, Matter, 2021, 4, 338–349 CrossRef.
- P. W. Anderson, Science, 1972, 177, 393 CrossRef CAS PubMed; B. Liu and B. Z. Tang, Angew. Chem., Int. Ed., 2020, 59, 9788 CrossRef PubMed.
- J. Mei, N. L. C. Leung, R. T. K. Kwok, J. W. Y. Lam and B. Z. Tang, Chem. Rev., 2015, 115, 11718 CrossRef CAS PubMed; Z. Zhao, W. He and B. Z. Tang, Acc. Mater. Res., 2021, 2, 1251 CrossRef; H. Yao, Annu. Rep. Prog. Chem., Sect. C, 2004, 100, 99 RSC; Y. Shi, S. Wang, W. Tao, J. Guo, S. Xie, Y. Ding, G. Xu, C. Chen, X. Sun, Z. Zhang, Z. He, P. Wei and B. Z. Tang, Nat. Commun., 2022, 13, 1882 CrossRef PubMed.
- Y. Wang, J. Nie, W. Fang, L. Yang, Q. Hu, Z. Wang, J. Sun and B. Z. Tang, Chem. Rev., 2020, 120, 4534 CrossRef CAS PubMed; L.-J. Chen and H.-B. Yang, Acc. Chem. Res., 2018, 51, 2699 CrossRef PubMed; X. Sun, W. Huang, Y. Zhou and D. Yan, Phys. Chem. Chem. Phys., 2010, 12, 11948 RSC; J. Li, Y. Liu, Y. Qian, L. Li, L. Xie, J. Shang, T. Yu, M. Yi and W. Huang, Phys. Chem. Chem. Phys., 2013, 15, 12694 RSC; K. Li, S. Li, L. Liu, W. Huang, Y. Wang, C. Yu and Y. Zhou, Phys. Chem. Chem. Phys., 2019, 21, 19995 RSC.
- W. J. Li, X. Q. Wang, D. Y. Zhang, Y. X. Hu, W. T Xu, L. Xu, W. Wang and H. B. Yang, Angew. Chem., Int. Ed., 2021, 60, 18761 CrossRef CAS PubMed.
- Q. Wan, B. Zhang, J. Tong, Y. Li, H. Wu, H. Zhang, Z. Wang, Y. Pan and B. Z. Tang, Phys. Chem. Chem. Phys., 2019, 21, 9837 RSC; B. S. Shivaji, R. Boddula and S. P. Singh, Phys. Chem. Chem. Phys., 2022, 24, 15110 RSC; Y. Zhang, B. He, J. Liu, S. Hu, L. Pan, Z. Zhao and B. Z. Tang, Phys. Chem. Chem. Phys., 2018, 20, 9922 RSC; G. Yakalı, Phys. Chem. Chem. Phys., 2021, 23, 11388 RSC; H. Wei, Y. Zeng, Q. Li and X. Zheng, Phys. Chem. Chem. Phys., 2022, 24, 25487 RSC; B. Yu, D. Liu, Y. Wang, T. Zhang, Y.-M. Zhang, M. Li and X.-A. Zhang, Phys. Chem. Chem. Phys., 2018, 20, 23851 RSC.
- M. Son, K. H. Park, C. Shao, F. Würthner and D. Kim, J. Phys. Chem. Lett., 2014, 5, 3601 CrossRef CAS PubMed; K. Dirian, S. Bauroth, A. Roth, Z. Syrgiannis, F. Rigodanza, M. Burian, H. Amenitsch, D. I. Sharapa, M. Prato, T. Clark and D. M. Guldi, Nanoscale, 2018, 10, 2317 RSC.
- J. Guo and H. X. Zhou, Chem. Rev., 2016, 116, 6503 CrossRef CAS PubMed; T. R. Nelson, A. J. White, J. A. Bjorgaard, A. E. Sifain, Y. Zhang, B. Nebgen, S. Fernandez-Alberti, D. Mozyrsky, A. E. Roitberg and S. Tretiak, Chem. Rev., 2020, 120, 2215 CrossRef PubMed; M. Lv, X. Lu, Y. Jiang, M. E. Sandoval-Salinas, D. Casanova, H. Sun, Z. Sun, J. Xu, Y. Yang and J. Chen, Near-Unity Triplet Generation Promoted via Spiro-Conjugation, Angew. Chem., Int. Ed., 2022, 61, e202113190 CrossRef PubMed; I. A. Heisler and S. R. Meech, Chem. Soc. Rev., 2021, 50, 11486 RSC; X. Luo, J. Li, J. Zhao, L. Gu, X. Qian and Y. Yang, Chin. Chem. Lett., 2019, 30, 839 CrossRef; P.-P. Jia, L. Xu, Y.-X. Hu, W.-J. Li, X.-Q. Wang, Q.-H. Ling, X. Shi, G.-Q. Yin, X. Li, H. Sun, Y. Jiang and H.-B. Yang, J. Am. Chem. Soc., 2021, 143, 399 CrossRef PubMed; Q. Lin, X. W. Guan, S.-S. Song, H.-Y. Fan, H. Yao, Y. M. Zhang and T.-B. Wei, Polym. Chem., 2019, 10, 253 RSC.
- H. B. Cheng, Y. Li, B. Z. Tang and J. Yoon, Chem. Soc. Rev., 2020, 49, 21 RSC; S. Liu, G. Feng, B. Z. Tang and B. Liu, Chem. Sci., 2021, 12, 6488 RSC.
- M. W. Mara, B. T. Phelan, Z. L. Xie, T. W. Kim, D. J. Hsu, X. Liu, A. J. S. Valentine, P. Kim, X. Li, S. i. Adachi, T. Katayama, K. L. Mulfort and L. X. Chen, Chem. Sci., 2022, 13, 1715 RSC; M. Zalibera, F. Ziegs, S. Schiemenz, V. Dubrovin, W. Lubitz, A. Savitsky, S. H. M. Deng, X. B. Wang, S. M. Avdoshenko and A. A. Popov, Chem. Sci., 2021, 12, 7818 RSC; S. Cekli, R. W. Winkel, E. Alarousu, O. F. Mohammed and K. S. Schanze, Chem. Sci., 2016, 7, 3621 RSC.
- S. V. Kirner, C. Henkel, D. M. Guldi, J. D. M. Jr. and D. I. Schuster, Chem. Sci., 2015, 6, 7293 RSC; Y. Rout, C. Montanari, E. Pasciucco, R. Misra and B. Carlotti, J. Am. Chem. Soc., 2021, 143, 9933 CrossRef CAS PubMed; E. Sebastian and M. Hariharan, J. Am. Chem. Soc., 2021, 143, 13769 CrossRef PubMed; L. Wimberger, S. K. K. Prasad, M. D. Peeks, J. Andréasson, T. W. Schmidt and J. E. Beves, J. Am. Chem. Soc., 2021, 143, 20758 CrossRef PubMed.
Footnote |
| † Electronic supplementary information (ESI) available. CCDC 2144544. For ESI and crystallographic data in CIF or other electronic format see DOI: https://doi.org/10.1039/d3ra06359c |
| This journal is © The Royal Society of Chemistry 2023 |

