 Open Access Article
Benign electrolytic modifications of starch: effects on functional groups and physical properties†
Pitcha Liewchirakorn ab and
Kamonwad Ngamchuea
 *a
*a
aSchool of Chemistry, Institute of Science, Suranaree University of Technology, 111 University Avenue, Suranaree, Muang, Nakhon Ratchasima 30000, Thailand. E-mail: kamonwad@g.sut.ac.th; Tel: +66 (0) 44 224 637
bInstitute of Research and Development, Suranaree University of Technology, 111 University Avenue, Suranaree, Muang, Nakhon Ratchasima, 30000, Thailand
First published on 13th October 2023
Abstract
Herein, a low-cost electrolytic technology for starch modification has been developed using abundant chloride salt as a redox mediator. The effects of electrolysis conditions on the in situ starch modification are investigated in detail, including chloride concentrations, applied voltages, and electrolysis durations. The modification mechanisms are determined by the type of chlorine species (Cl2, HClO, ClO−, and HCl) generated during the process. Following electrolysis, carbonyl and carboxyl groups ranging from 0.056 to 1.3 g/100 g of starch and 0.006 to 0.5 g/100 g of starch, respectively, were observed. Starch granule median size can be reduced from 15.3 μm to 13.5 μm. In addition to the pronounced changes in granule size, shape, and functional groups, electrolysis leads to increased moisture resistance, higher crystallinity, and substantial alterations in the pasting properties.
1 Introduction
Polysaccharides in the form of starches are a vital natural source of biomaterials for several industries, including pharmaceutical,1 biomedical,2,3 cosmetic,4 and packaging.5–7 Among these starch sources, cassava starch is of particular interest due to its abundant availability, economic importance, and sustainability. Cassava starch consists of two main glucose polymers: amylose (17–24%) and amylopectin (76–83%), forming semi-crystalline starch granules.8 Each starch granule has a mean diameter ranging from 13.36 to 17.24 μm.9 Amylose, with a molecular weight average of approximately 0.24–2.7 MDa, is bonded to other amylose molecules through α-(1 → 4) glycosidic bonds, forming tight helical structures or double helices.10 Meanwhile, amylopectin is highly branched, with a molecular weight average of 5–4000 MDa.10 Its α-D-glucose units are linked together by α-(1 → 4) glycosidic bonds, while branching occurs through α-(1 → 6) bonds, comprising around 5% of all glycosidic linkages.11 Scheme S1 (ESI†) illustrates the typical structure of cassava starch granules.However, cassava starch in its native form has limitations in physicochemical properties, and it is necessary to modify the chemical structures and functionalities of starch to have the desired properties and broaden its applications. These desired properties include, for example, reduced viscosity, shear stability, thermal stability, improved moisture resistance, and increasing chemical compatibility with other polymers.12–15 Industrial production of modified starch involves the utilization of hazardous chemicals, physical processes, enzymes, and the combination approaches.16,17 Additionally, there are alternative methods for starch modification, such as ozone treatment,18,19 corona electrical discharge,20 ultrasound treatment,21 microwave,22 pulsed electric fields23 and electrochemical techniques.24–26 Table 1 presents a comprehensive overview of the various techniques employed for the modification of starch.
| Methods | Chemical reagents | Advantages | Disadvantages | Ref. |
|---|---|---|---|---|
| Chemical oxidation | e.g. H2O2, HClO, O2, O3, Br2, IO4−, MnO4−, TEMPO (2,2,6,6-tetramethylpiperidine-1-oxyl) | • Simple operation | • Generate waste | 17 |
| • Capable of scaling up to industrial levels | • Slow reaction rate; typically require catalyst | |||
| Corona electrical discharge | — | • Fast | • May cause crosslinking, increasing polymer weight | 20 |
| • Wasteless | • May cause degradation | |||
| Ultrasound | — | • Efficient | • Require coupling with other methods for oxidation purposes | 27 |
| • Fast | ||||
| • Low energy consumption | ||||
| Microwave | — | • Efficient | • Uneven heating | 22 |
| • Fast | • Require coupling with other methods for oxidation purposes | |||
| • Low energy consumption | ||||
| Pulsed electric fields | Can be performed with or without reagents e.g. IO4−, ClO−, etc. | • Efficient | • Equipment complexity | 23 |
| • Fast | • Relatively high energy consumption | |||
| Direct electrooxidation | — | • Mild reaction conditions | • Require high voltage | 24 |
| • Generate less waste | • Electrode passivation | |||
| Redox-mediated electrooxidation | TEMPO (2,2,6,6-tetramethylpiperidine-1-oxyl) | • Environmentally friendly | • Expensive reagent (TEMPO) | 25 |
| Br− | • Low cost (Br− and Cl−) | • Scale-up challenges | ||
| Cl− | • Use a small amount of reagent | • Scale-up challenges | 26 | |
| • Reagent regenerated after starch modification | • Scale-up challenges | This work | ||
| • Generate less waste |
However, chemical processes remain the most commonly employed method for starch modification due to their low investment costs, especially in Southeast Asia. Considering the critical aspects of waste management and environmental impact, the development of green and low-cost technologies becomes imperative for starch modification.
This work aims to address this need by developing a simple electrochemical method, using mild conditions, to modify the functional groups of cassava starch. However, direct electrooxidation of starch requires high overpotentials (high energy input), and its application in aqueous solutions would result in side-reactions of the hydrogen evolution reaction (HER) and oxygen evolution reaction (OER) at the cathode and anode, respectively. In this work, we utilize a chlorine-based system as redox mediators. The oxidizing chlorine species are generated in situ by applying potential or voltage between two conducting electrodes, as demonstrated in Scheme 1. The method relies on the use of readily available, cost-effective, and eco-friendly sodium chloride salt as the starting material, making the process not only highly efficient but also environmentally sustainable. The oxidation of chloride occurs at a much lower potential than the OER, which helps prevent the occurrence of side-reactions and improves the efficiency of starch modification.
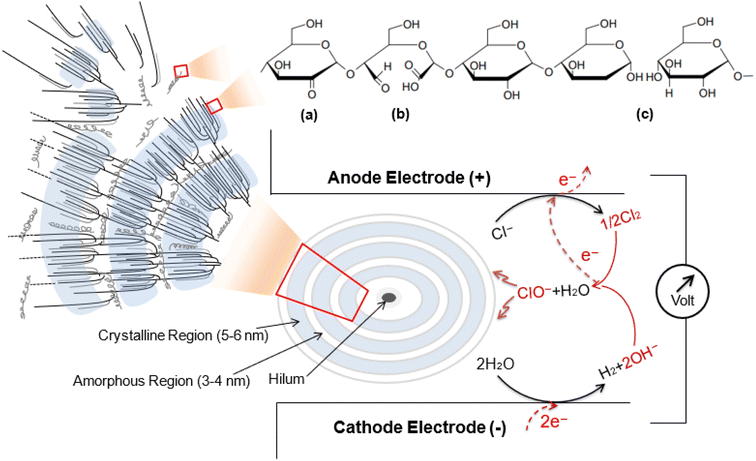 | ||
| Scheme 1 Schematic diagram presenting the typical structure of amylose/amylopectin in cassava starch granule after electrolysis mediated by the in situ generated oxidizing chlorine species (Cl2, HClO, and ClO−).30,31 (a) oxidation at C2 position, (b) oxidation at C2 and C3, and (c) oxidation at the α-1,4-glycosidic linkage.28,29,32 | ||
However, organic molecules like starches can undergo oxidation through a series of intricate processes that involve numerous radical intermediates and subsequent reactions when chlorine species are generated. Alkyl and carbon radicals are formed during these reactions by the abstraction of hydrogen. The hydroxyl groups at C2, C3, and C6 positions in starches are easily oxidized.28 In other degradation processes, the glycosidic bonds of the glucose units can be attacked by chlorine species, potentially hydrolyzing them into alcohol (OH) groups or converting the C–C bonds into carbonyl groups, including aldehydes, ketones, and carboxylates.29
The focus of our investigation revolves around unraveling the correlations between the applied potential and the extent of starch oxidation during electrolysis. By systematically exploring various electrolyte and oxidation conditions, including applied potential, current density, pH, time, and temperature, we aim to pinpoint the optimal parameters for starch modifications. In addition to examining the modifications of functional groups, we conduct rigorous investigations into the changes in physicochemical properties associated with starch oxidation, encompassing aspects such as starch granule size, viscosity, thermal stability, crystal structure, morphology, and pasting properties. By comprehensively exploring these aspects, this research aims to provide valuable insights into the effects of the proposed oxidation method on starch properties, thereby facilitating its effective and sustainable utilization in diverse applications.
2 Experimental
2.1 Materials
The native cassava starch used in this work is a commercially available food-grade product obtained from Thai Wah Public Company (TWPC). All chemicals used in the study were of analytical grade: sodium chloride (NaCl, >99%, Sigma Aldrich), hydrochloric acid (HCl, 37%, RCI Labscan Limited), sodium hydroxide (NaOH, 98%, Sigma Aldrich), hydroxylamine hydrochloride (NH2OH·HCl, 99%, TCI Chemicals). Deionized water used in all experiments was obtained from the Elga Purelab Ultra water purification system (Elga Labwater, UK).2.2 Starch modification via electrolysis
First, 8.00 g of cassava starch were suspended in an aqueous electrolyte solution containing 0.2, 0.4, 0.8, or 1.2 g of NaCl dissolved in 80.00 mL of deionized water in a long-bottomed glass vessel electrolysis cell. The employed NaCl concentrations were 2.5–15 wt% based on starch (equivalent to ca. 0.04, 0.09, 0.17, and 0.26 mol L−1). Platinum plate electrodes with a surface area of 4 cm2 were employed as cathode and anode, connected to a DC Power Supply R-SPS3010 (0–30 V, 0–10 A). The distance between the two electrodes ranged from 1 to 2 cm. Electrolysis was conducted under a fume hood while varying the electrical voltage at 12 and 24 V. The temperature of the electrochemical oxidation reaction was maintained at 40 °C using a hot plate and ice bath for three different time periods (30, 60, and 120 minutes). Currents during electrolysis were recorded, and vigorous stirring was necessary to prevent starch sedimentation. After completing the electrolysis, the starch was vacuum-filtered and washed three times with deionized water (approximately 500 cm3). The oxidized starch was subsequently dried in a hot air oven at 40 °C for 12 hours. A portion of the NaCl electrolyte solution was separated after electrolysis to measure its pH value.2.3 Carbonyl and carboxyl content analysis
The carbonyl and carboxyl contents of the oxidized starch were measured using titrimetric methods adapted from Smith33 and Chattopadhyay,34 respectively. For carbonyl analysis, 1.00 g of dry starch was suspended in 50.0 mL of deionized water and gelatinized in a boiling water bath for 10 minutes. After cooling to 25 °C, the pH was adjusted to 3.2 with 0.10 N HCl. Next, 5.00 mL of hydroxylamine reagent was added and heated at 40 °C for 4 hours with slow stirring. Excess hydroxylamine was titrated with standardized 0.10 N HCl to a pH of 3.2. The pH values of all solutions were measured using a digital pH meter (Five Easy™, Mettler Toledo, Germany) at the temperature of 25 °C.The carbonyl content was expressed as a percent mass fraction of the carbonyl groups per starch, specifically as grams of carbonyl groups per 100 grams of oxidized starch:
 | (1) |
For carboxyl analysis, 2.00 g of starch was mixed with 25.00 mL of 0.10 N HCl, stirred for 30 minutes, and then washed with deionized water to ensure the absence of chloride residue (verified using silver nitrate solution). The resulting starch was split into two equal portions. The first portion was oven-dried at 40 °C for 12 hours to determine the net dry weight. The other portion was dispersed in 100.0 mL of deionized water, gelatinized in a boiling water bath for 10 minutes, and titrated to a pH of 8.3 with standardized 0.010 N NaOH.
The carboxyl content was expressed as a percent mass fraction of carboxyl groups per starch, specifically as grams of carboxyl groups per 100 grams of oxidized starch:
 | (2) |
2.4 Physicochemical characterization of starch
The particle sizes and size distribution of the starch samples were analyzed with a Laser Scattering Particle Size Distribution Analyzer (LA-950V2, Horiba, Germany). Before size analysis, the starch samples were dispersed in deionized water and vortex-mixed. The refractive indices used were 1.31 for water and 1.50 for starch.The morphology of the starch granules was examined using a field emission scanning electron microscope (AURIGA FE-SEM/FIB/EDX, Zeiss, Germany). Starch samples were suspended in ethanol to obtain a 1% w/v suspension. The samples were then treated with ultrasound for 15 minutes to prevent aggregation, deposited onto carbon tape, dried at 40 °C for 12 hours, and finally coated with gold for SEM analysis.
The crystal structures of starch samples were analyzed using a powder X-ray diffractometer (D2 Phaser XRD, Bruker, Karlsruhe, Germany) under the following conditions: 30 kV and 10 mA with Cu tube radiation (0.154184 nm), and a scan speed of 2° min−1. Each scan covered a range from 5 to 50°. The relative crystallinity (RC%) of the starch granules was determined using the following equation:
 | (3) |
The functional groups in the starch samples were evaluated using an ATR-FTIR spectrometer (Tensor 27 FT-IR Spectrometer, Bruker, Germany). The starch powders were oven-dried at 60 °C for 15 hours prior to testing. FTIR spectra were recorded over a wavenumber range from 4000 to 400 cm−1. The resolution was set to 4 cm−1 and each scan was repeated 64 times.
Thermal stability testing of the starch samples was carried out under a nitrogen atmosphere with a heating rate of 10 °C min−1 using a thermal gravimetric analyzer (TGA/DSC 1, Mettler Toledo, Germany). The scanning temperature range extended from 35 to 600 °C.
The pasting properties of starches were assessed using a Rapid Visco Analyzer (MCR-52, Anton Paar, Graz-8054, Austria) following the testing conditions outlined by Chandak et al.35 A starch suspension (1.2 g of dry starch in 13.8 g of deionized water) was initially equilibrated at 50 °C for one minute, then heated from 50 °C to 95 °C at a rate of 6 °C per minute, and maintained at 95 °C for 2.7 minutes. Subsequently, the suspension was gradually cooled back to 50 °C at the same rate and held at that temperature for 2 minutes.
3 Results and discussion
Initially, starch samples were subjected to electrolytic modifications utilizing chloride salts across a range of conditions. The effects of parameters such as applied potentials, electrolysis duration, chloride concentrations, pH levels, and currents were evaluated. Through a comprehensive analysis, alterations in functional groups, size distribution, and properties of starch such as crystal structure, morphology, and thermal stability, were subsequently examined.3.1 Carbonyl content
During the electrooxidation of starch samples through the electrolysis of chloride salts, the hydroxyl groups had the potential to be oxidized, initially converting to carbonyl groups and possibly further transforming into carboxyl groups.28,32 The details of the chloride electrolysis process are summarized in Section S2 of the ESI.†In this section, we assess the resulting carbonyl content in starch after electrolysis. Fig. 1 illustrates a clear time-dependent relationship between the carbonyl group content and electrolysis duration. In the investigations conducted under both 12 V and 24 V applied voltages, a noticeable and time-dependent increase in the concentration of carbonyl groups within starch samples was observed as the electrolysis duration was extended. Note that the selection of the two studied voltages, 12 V and 24 V, was based on their practical applicability in achieving the desired levels of starch oxidation while considering factors like chloride concentration and electrolysis duration. Voltages below 12 V can induce starch oxidation, but achieving a high degree of oxidation requires substantial chloride salt and prolonged electrolysis. Conversely, voltages higher than 24 V yield very low oxidized starch output, resulting in excessively small starch particles. Although using filtration paper with smaller pore size can improve this, the overly fine starch particles may not be suitable for many applications. It is worth noting that the choice of voltage depends on specific applications, as different applications may require starch with varying sizes and degrees of oxidation. However, for the purposes of this study, we focused on 12 V and 24 V to demonstrate the proof-of-concept regarding the effects of voltage on starch oxidation through chloride salt electrolysis.
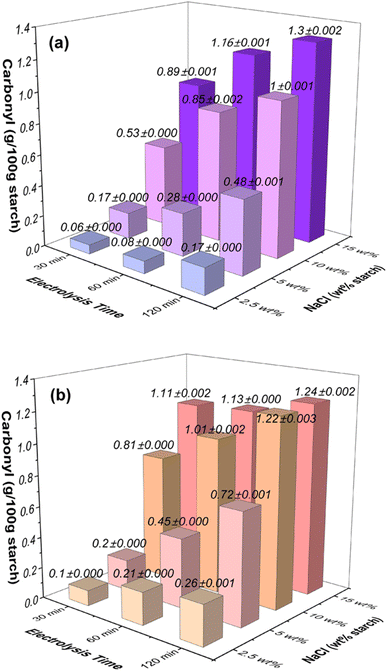 | ||
| Fig. 1 Effects of NaCl concentration (wt% based on starch) and electrolysis time on the carbonyl contents in oxidized starches at the applied voltage of (a) 12 V and (b) 24 V. | ||
At an applied voltage of 12 V (Fig. 1a), when considering starch samples with a lower NaCl concentration of 2.5 wt% (equivalent to 0.04 mol L−1), the carbonyl content showed an escalation from 0.06 g/100 g starch at 30 minutes to 0.17 g/100 g starch at 120 minutes. Similarly, with an elevated NaCl concentration of 5 wt% (0.09 mol L−1), the carbonyl content exhibited a rise from 0.17 g/100 g starch at 30 minutes to 0.48 g/100 g starch at 120 minutes. This trend persisted for higher NaCl concentrations: at 10 wt% NaCl (0.17 mol L−1), the carbonyl content increased from 0.53 g/100 g starch at 30 minutes to 1.0 g/100 g starch at 120 minutes, and for 15 wt% NaCl (0.26 mol L−1), the carbonyl content increased from 0.89 g/100 g starch at 30 minutes to 1.3 g/100 g starch at 120 minutes.
When the applied voltage was increased to 24 V (Fig. 1b), a similar pattern emerged: for starch samples with a low NaCl concentration of 2.5 wt% (0.04 mol L−1), the carbonyl content increased from 0.1 g/100 g starch at 30 minutes to 0.26 g/100 g starch at 120 minutes. With NaCl concentration at 5 wt% (0.09 mol L−1), the carbonyl content rose from 0.2 g/100 g starch at 30 minutes to 0.72 g/100 g starch at 120 minutes. At 10 wt% NaCl (0.17 mol L−1), the carbonyl content exhibited an increase from 0.81 g/100 g starch at 30 minutes to 1.22 g/100 g starch at 120 minutes. Similarly, for 15 wt% NaCl (0.26 mol L−1), the carbonyl content increased from 1.11 g/100 g starch at 30 minutes to 1.24 g/100 g starch at 120 minutes.
3.2 Carboxyl content
Fig. 2 illustrates the variations in carboxyl content in oxidized starches resulting from electrolysis performed on starch solutions with different NaCl concentrations (2.5 wt%, 5 wt%, 10 wt%, and 15 wt%) at two distinct applied voltages (12 V and 24 V). Prolonged electrolysis durations (ranging from 30 to 120 minutes) led to notable increases in carboxyl group levels within the starch. The influence of NaCl concentration was evident, as higher concentrations correlated with more significant enhancements.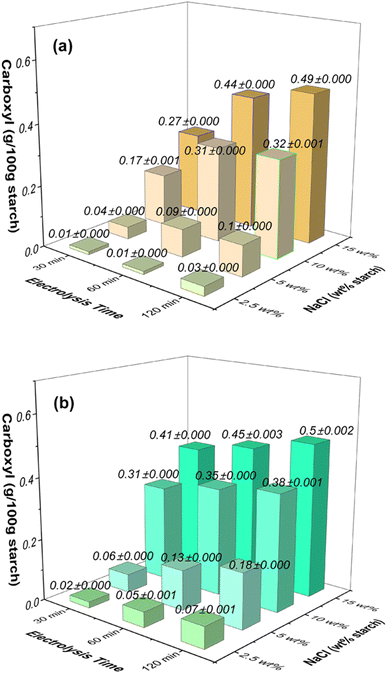 | ||
| Fig. 2 Effects of NaCl concentration (wt% based on starch) and electrolysis time on the carboxyl contents in oxidized starches at the applied voltage of (a) 12 V and (b) 24 V. | ||
Under an applied voltage of 12 V (Fig. 2a), a low NaCl concentration of 2.5 wt% triggered carboxyl content growth from 0.01 g/100 g starch at 30 minutes to 0.03 g/100 g starch at 120 minutes. Similarly, higher NaCl concentrations (5 wt%, 10 wt%, and 15 wt%) led to increases from 0.04 g/100 g starch to 0.1 g/100 g starch, from 0.17 g/100 g starch to 0.32 g/100 g starch, and from 0.27 g/100 g starch to 0.49 g/100 g starch, respectively, over the same time span.
At the applied voltage of 24 V (Fig. 2b), the carboxyl group content rose from 0.02 g/100 g starch at 30 minutes to 0.07 g/100 g starch at 120 minutes for the 2.5 wt% NaCl concentration. Similarly, for higher NaCl concentrations (5 wt%, 10 wt%, and 15 wt%), the content increased from 0.06 g/100 g starch to 0.18 g/100 g starch, from 0.31 g/100 g starch to 0.38 g/100 g starch, and from 0.41 g/100 g starch to 0.5 g/100 g starch, respectively. Notably, the increase of carboxyl content is less pronounced at the highest NaCl concentration of 15 wt% (NaCl 0.26 mol L−1), suggesting a saturation point for carbonyl and carboxyl group increase under these conditions.
3.3 Degree of oxidation
It is important to note that the formation of carboxyl groups within starch exhibited a similar time-dependent pattern to that of carbonyl groups, especially at lower concentrations. This transformation took place subsequent to the conversion of hydroxyl groups to carbonyl groups, and further modifications were observed as chlorine species transformed carbonyl groups into carboxyl groups. The cumulative measurement of both carbonyl and carboxyl groups, known as the degree of oxidation (DO) through electrolysis, is presented in Table 2. The DO of the modified starch increases with higher NaCl concentrations at both applied voltages of 12 V and 24 V. Furthermore, the DO of the modified starch also increases with prolonged electrolysis time. The lowest DO value recorded was 0.06 g/100 g of starch, observed under the mildest conditions (NaCl 2.5 wt% based on starch, 12 V, 30 min). Conversely, the highest DO value achieved was 1.74 g/100 g of starch, observed under the more severe condition (NaCl 15 wt% based on starch, 24 V, 120 min).| Sample | Electrolysis conditions | Current during electrolysis (A) | pH after electrolysis | DO (CO + COOH) (g/100 g starch) | Yield (%) | ||
|---|---|---|---|---|---|---|---|
| NaCl (wt%) | Time (min) | Applied voltage (V) | |||||
| a Note: (i) pH of deionized water = 6.95 ± 0.1, (ii) pH of native starch (8 g) in deionized water (80 mL) = 5.7 ± 0.1, (iii) carbonyl content of native starch = 0.06 ± 0.000 g/100 g starch. | |||||||
| 1 | 2.5 | 30 | 12 | 0.14–0.16 | 7.34 ± 0.010 | 0.06 ± 0.000 | 98.8 ± 0.21 |
| 2 | 2.5 | 60 | 12 | 0.14–0.16 | 7.10 ± 0.010 | 0.09 ± 0.000 | 98.5 ± 0.33 |
| 3 | 2.5 | 120 | 12 | 0.14–0.16 | 3.83 ± 0.010 | 0.19 ± 0.000 | 97.9 ± 0.40 |
| 4 | 5 | 30 | 12 | 0.27–0.30 | 7.63 ± 0.010 | 0.20 ± 0.000 | 98.4 ± 0.96 |
| 5 | 5 | 60 | 12 | 0.27–0.30 | 3.88 ± 0.010 | 0.37 ± 0.000 | 94.1 ± 0.32 |
| 6 | 5 | 120 | 12 | 0.27–0.30 | 3.33 ± 0.010 | 0.57 ± 0.001 | 90.2 ± 0.39 |
| 7 | 10 | 30 | 12 | 0.54–0.60 | 7.63 ± 0.010 | 0.70 ± 0.001 | 92.6 ± 0.21 |
| 8 | 10 | 60 | 12 | 0.54–0.60 | 3.14 ± 0.010 | 1.16 ± 0.002 | 86.3 ± 0.22 |
| 9 | 10 | 120 | 12 | 0.54–0.60 | 3.31 ± 0.010 | 1.32 ± 0.002 | 83.1 ± 0.64 |
| 10 | 15 | 30 | 12 | 0.82–0.90 | 7.42 ± 0.006 | 1.17 ± 0.001 | 86.1 ± 0.60 |
| 11 | 15 | 60 | 12 | 0.82–0.90 | 3.14 ± 0.010 | 1.60 ± 0.002 | 85.8 ± 0.88 |
| 12 | 15 | 120 | 12 | 0.82–0.90 | 3.25 ± 0.006 | 1.79 ± 0.002 | 76 ± 0.39 |
| 13 | 2.5 | 30 | 24 | 0.35–0.38 | 7.30 ± 0.010 | 0.12 ± 0.000 | 98.4 ± 0.85 |
| 14 | 2.5 | 60 | 24 | 0.35–0.38 | 3.67 ± 0.010 | 0.26 ± 0.001 | 98.2 ± 0.16 |
| 15 | 2.5 | 120 | 24 | 0.35–0.38 | 3.34 ± 0.010 | 0.34 ± 0.002 | 97.3 ± 0.33 |
| 16 | 5 | 30 | 24 | 0.68–0.75 | 7.36 ± 0.010 | 0.25 ± 0.000 | 98.2 ± 0.99 |
| 17 | 5 | 60 | 24 | 0.68–0.75 | 3.20 ± 0.010 | 0.58 ± 0.001 | 93.8 ± 0.14 |
| 18 | 5 | 120 | 24 | 0.68–0.75 | 3.09 ± 0.010 | 0.91 ± 0.001 | 87.3 ± 0.61 |
| 19 | 10 | 30 | 24 | 1.28–1.50 | 7.05 ± 0.010 | 1.12 ± 0.001 | 91.0 ± 0.35 |
| 20 | 10 | 60 | 24 | 1.28–1.50 | 3.13 ± 0.010 | 1.36 ± 0.002 | 86.0 ± 0.71 |
| 21 | 10 | 120 | 24 | 1.28–1.50 | 2.97 ± 0.010 | 1.60 ± 0.004 | 82.6 ± 0.14 |
| 22 | 15 | 30 | 24 | 1.84–2.10 | 2.85 ± 0.010 | 1.52 ± 0.003 | 86.0 ± 0.72 |
| 23 | 15 | 60 | 24 | 1.84–2.10 | 3.05 ± 0.010 | 1.58 ± 0.004 | 78.3 ± 1.00 |
| 24 | 15 | 120 | 24 | 1.84–2.10 | 2.97 ± 0.010 | 1.74 ± 0.004 | 31.25 ± 1.09 |
The increase in carbonyl and carboxyl content depends on the concentration of NaCl, the duration of electrolysis, and the applied voltage. These variations are linked to the in situ formation of oxidizing chlorine species (HClO, ClO−, and Cl2), which can subsequently create acids, causing pH fluctuations and changes in the composition of oxidizing chlorine species within the solution. Higher NaCl concentrations result in a greater concentration of the generated oxidizing chlorine species. Moreover, the application of a higher voltage leads to increased carbonyl and carboxyl levels due to enhanced oxidation and reduction rates occurring at the anode and cathode.
However, at the highest NaCl concentration (15 wt%), an increase in voltage has a limited effect on carbonyl and carboxyl group increase, potentially due to structural degradation during electrolysis. The action of chlorine species can hydrolyze the amorphous regions (α-1,4-glycosidic linkage) before the α-1,6-glycosidic linkage of the granules, which in turn can enhance the crystallinity of the starch.36 This process reduces starch molecular weight and hot paste viscosity.37 Therefore, the amount of carbonyl and carboxyl groups on starch granules possibly increases, but some that deteriorated under severe electrolysis conditions could break off significantly, resulting in very small fragments smaller than 2 μm. These fragments could be lost during the filtration process using filter paper (2 μm), leading to a lower concentration of carbonyl and carboxyl groups than usual.
3.4 pH during electrolysis
The pH values of starch solutions during and after electrolysis are influenced by factors such as NaCl amount and electrolysis time (Table 1). Electrolysis generates ClO−, HClO, and Cl2 from Cl−, leading to pH changes. At lower NaCl concentrations and 12 V voltage, electrolysis for 30 minutes results in pH close to 7, favoring ClO− and HClO, refer to Fig. S1 (ESI).† However, at 15 wt% NaCl concentration and 24 V voltage, pH drops to 2.85 due to increased Cl2 gas production, refer to Fig. S1 (ESI).† Electrolysis exceeding 30 minutes at both 12 V and 24 V generates more Cl2 gas. This pH variation affects starch granule oxidation. Intense electrolysis conditions (15 wt% NaCl, 120 min, 24 V) yield excess Cl2 gas, potentially leading to HCl formation) and reduced starch granule size, discussed in Section 3.7. This outcome is elaborated in the modified starch section, focusing on particle size and distribution.3.5 Electrical currents during electrolysis
The electric current during electrolysis varies due to changes in electron exchange rates from oxidation and reduction processes at both cathode and anode electrodes. When the applied voltage is 12 V, electric current for 2.5 wt% NaCl based on starch ranges from 0.14 to 0.16 A (Table 1). Increasing NaCl concentration twofold, fourfold, and sixfold results in proportional electric current enhancements. At 24 V, the current for the same NaCl concentration ranges from 0.35 to 0.38 A, with similar proportional increases upon concentration escalation (Table 1). Evidently, electrolysis rate directly correlates with NaCl concentration increment.As the electrolysis was carried out at high voltages (up to 24 V) and high currents (up to 2.10 A), it was essential to investigate the potential effects of electrode poisoning. We examined both the surface and electroactivity of the electrodes before and after the electrolytic modifications using an optical microscope and cyclic voltammetry of the [Fe(CN)6]4−/3− standard redox probe, respectively. The results, as depicted in Fig. S2 and S3 (ESI),† revealed that there were no significant changes in the appearance of the electrodes. However, following electrolysis, a slight decrease in the electroactivity of both the anode and cathode was observed, possibly due to some degree of electrode passivation. Nevertheless, the electrode activities could be restored through a cleaning procedure involving immersion in a 0.10 M HCl solution for 2 minutes, followed by mechanical polishing using alumina slurry (1.0, 0.3, and 0.05 μm, Buehler, USA) on soft polishing microcloths (Buehler, USA), and subsequent sonication to remove any remaining alumina from the surface.
3.6 Particle size and size distribution of oxidized starch
The process of electrolysis has a dual effect, impacting not only the extent of oxidation by augmenting the presence of carbonyl and carboxyl groups, but also exerting an influence on the size of starch granules, as demonstrated in Table 3. The median size (D50) of native starch was approximately 15.3 μm with a broad normal distribution curve (Fig. 3). Following electrolysis, the size of the modified starch decreased, and the normal distribution curve changed from broad to narrow (Fig. 3).| Sample | D50 (μm) |
|---|---|
| Native cassava starch | 15.3 ± 0.05 |
| NaCl 5 wt% based on starch, 12 V, 30 min | 15.0 ± 0.08 |
| NaCl 5 wt% based on starch, 12 V, 120 min | 14.6 ± 0.03 |
| NaCl 10 wt% based on starch, 12 V, 30 min | 14.9 ± 0.08 |
| NaCl 10 wt% based on starch, 12 V, 60 min | 14.8 ± 0.09 |
| NaCl 10 wt% based on starch, 12 V, 120 min | 14.7 ± 0.21 |
| NaCl 15 wt% based on starch, 12 V, 30 min | 14.8 ± 0.14 |
| NaCl 15 wt% based on starch, 12 V, 60 min | 14.5 ± 0.23 |
| NaCl 15 wt% based on starch, 12 V, 120 min | 14.0 ± 0.17 |
| NaCl 5 wt% based on starch, 24 V, 30 min | 14.7 ± 0.02 |
| NaCl 5 wt% based on starch, 24 V, 120 min | 14.5 ± 0.22 |
| NaCl 10 wt% based on starch, 24 V, 30 min | 14.6 ± 0.15 |
| NaCl 10 wt% based on starch, 24 V, 60 min | 14.4 ± 0.14 |
| NaCl 10 wt% based on starch, 24 V, 120 min | 14.1 ± 0.08 |
| NaCl 15 wt% based on starch, 24 V, 30 min | 14.4 ± 0.02 |
| NaCl 15 wt% based on starch, 24 V, 60 min | 13.9 ± 0.01 |
| NaCl 15 wt% based on starch, 24 V, 120 min | 13.5 ± 0.30 |
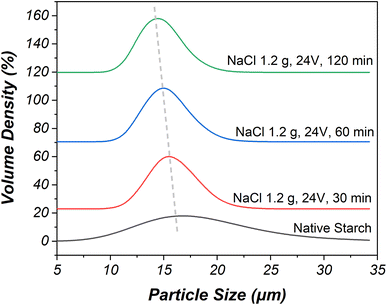 | ||
| Fig. 3 The particle size of native starch compared with oxidized starch prepared using 15 wt% NaCl, the applied voltage of 24 V, and the electrolysis time of 30–120 minutes. | ||
In particular, the study focused on modified starches and their granule median size changes under different NaCl concentrations and applied voltages during electrolysis. The experimentation began at a NaCl concentration of 5 wt% due to minimal size change below this concentration. The granule median size decreased from 15.0 to 14.0 μm when the NaCl concentration was increased to 15 wt% with an electrolysis time of 120 minutes and an applied voltage of 12 V. This reduction was attributed to hydrochloric acid presence during electrolysis, which hydrolyzed starch granules. The oxidation and electrolysis reactions primarily affected amylose before amylopectin, leading to the separation of both components. This oxidation and electrolysis process, driven by chlorine species, caused the breaking of 1,4-glycosidic linkages and consequently reduced starch size.36
A higher applied voltage of 24 V resulted in a stronger electrolysis reaction compared to 12 V, leading to greater reduction in granule median size under the same conditions. Specifically, a NaCl concentration of 15 wt% combined with an applied voltage of 24 V significantly reduced starch median size from 14.4 to 13.5 μm over an electrolysis time ranging from 30 minutes to 120 minutes, due to enhanced chlorine generation and subsequent increase in solution acidity. The interplay of these factors, along with increased chlorine gas dissolution and subsequent hydrochloric and hypochlorous acid formation, contributed to the more substantial reduction in granule median size for this specific condition.
3.7 Morphology of oxidized starch
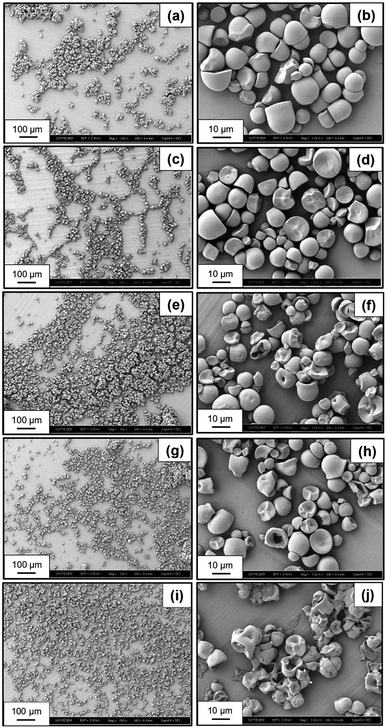
Fig. 4a–j reveal the morphology of native starch and various oxidized starches subjected to different electrolysis conditions. Native starch granules display a regular shape with a smooth surface (Fig. 4a and b). In Fig. 4c and d, oxidized starch resulting from electrolysis under conditions of NaCl 10 wt%, 12 V, and 30 min showcases subtle alterations in shape and size due to oxidation reactions by HClO and ClO−. In Fig. 4e–k, a more significant transformation is evident in the shape and size of oxidized starch. This transformation arises from electrolysis reactions involving HClO, Cl2, and HCl due to the more acidic conditions. During this acidic transformation, it is likely that a portion of the amylose component will become solubilized and leached out.38 Notably, the starch granules undergo layer peel-off, resulting in smaller sizes and fragmented particles post-oxidation and electrolysis. The extent of these changes intensifies with increasing NaCl concentration, from 10 wt% (Fig. 4e and f) to 15 wt% (Fig. 4g and h), and with the elevation of applied voltage from 12 V to 24 V (Fig. 4i and j), revealing a pronounced presence of fragmented and deteriorated granules.3.8 Crystallinity of oxidized starch
Fig. 5 presents the XRD patterns of native and oxidized cassava starches. Both the native and oxidized starch under specific electrolysis conditions, such as NaCl 10 wt%, 12 V, 30 min (Fig. 5a and b), exhibit distinct peaks at 14.9°, 16.9°, 17.6°, and 22.8°, aligning with an A-type crystalline pattern.21 In contrast, modifications in crystalline patterns are evident across other oxidized starches. Notably, the intensity and positions of the four peaks in oxidized starches subjected to NaCl 15 wt%, 24 V, 30 min and NaCl 15 wt%, 24 V, 120 min conditions (Fig. 5c and d) undergo alteration, shifting to 15.2°, 17.1°, 18.0°, and 23.2°. This shift suggests subtle modifications in the amorphous and crystalline structure.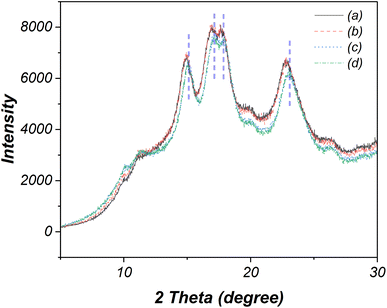 | ||
| Fig. 5 XRD patterns of (a) native starch and oxidized starches modified using (b) 10 wt% NaCl, 12 V, 30 min, (c) 15 wt% NaCl, 24 V, 30 min, and (d) 15 wt% NaCl, 24 V, 60 min. | ||
The % relative crystallinity was further determined from the ratio of integrated crystalline area and total integrated area of the XRD patterns, according to the method previously described in the literature.39 The initial relative crystallinity of native starch stands at approximately 22.4%. Following electrolysis under NaCl 10 wt%, 12 V, 30 min conditions, the modified starch experiences an increase in relative crystallinity to 22.8%, while the NaCl 15 wt%, 24 V, 30 min condition elevates this value to 23.3%. The most pronounced increase is witnessed under the rigorous electrolysis conditions of NaCl 15 wt%, 24 V, 120 min, resulting in the highest relative crystallinity of 24.2%. This augmented crystallinity arises from the transformation of some amorphous or amylose portions into small fragments during electrolysis. The shorter amylose chains, due to their smaller size, can move and undergo rearrangement, leading to an increase in crystallinity.40,41 Besides, these fragments are small (<2 μm), enough to pass through filter paper during the filtration process.
3.9 Functional groups
The ATR-FTIR technique was employed to verify changes in the functional groups of starch granules resulting from electrolysis. The comparison of FTIR spectra between native and modified cassava starch (Fig. 6a–e) revealed several characteristic bands. These included O–H stretching at 3300 cm−1,42 symmetrical and asymmetrical C–H stretching at 2926 cm−1,42 water molecule deformation vibrations at 1630 cm−1,43 C–O–H bending vibrations of polysaccharides at 1336 cm−1,43 C–O–C stretching glycosidic bond at 1149 cm−1,43 and C–O, C–C, and O–H bond stretching at 1078 cm−1.43 Additionally, the band at 1005 cm−1 indicated C–O–H bending vibrations,42 while the 924 cm−1 band signified C–O–C of alpha glycosidic linkage.43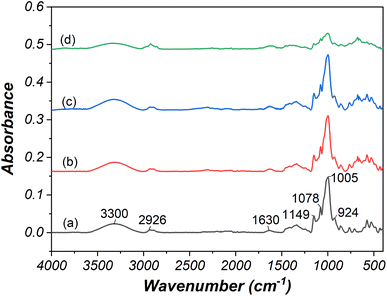 | ||
| Fig. 6 ATR-FTIR spectra of (a) native starch and oxidized starch prepared using (b) 10 wt% NaCl, 24 V, 30 min, (c) 15 wt% NaCl, 24 V, 30 min, (d) 15 wt% NaCl, 24 V, 120 min. | ||
The ATR-FTIR analysis demonstrated changes in starch's functional groups following oxidation and electrolysis, particularly notable in starch modified under severe electrolysis conditions (15 wt% NaCl, 24 V, 120 min). Modified starch displayed reduced water absorption compared to native starch. The decline in peak height at 1005 cm−1 confirmed the transformation of C–OH at C2, C3, and C6 into carbonyl and carboxyl groups. Furthermore, reduced peak heights at 1149 cm−1 and 924 cm−1 was associated with starch depolymerization at alpha glycosidic linkage due to oxidation and electrolysis reactions.
3.10 Thermal stability of oxidized starch
We subsequently examined the thermal properties of both native and oxidized starches using thermal gravimetric analysis (TGA). The TGA curves presented in Fig. 7 displayed three distinct stages of mass loss: dehydration (endothermic), decomposition of organic matter (exothermic), and formation of residues. When subjected to various electrolysis conditions, the moisture content within the oxidized starches exhibited changes as follows: 10.7–10.9% (10 wt% NaCl, 12 V, 30 min); 10.4% (15 wt% NaCl, 24 V, 30 min); 9.7% (15 wt% NaCl, 24 V, 120 min). The findings suggested that a higher degree of oxidation led to a reduction in moisture absorption due to an increase in carbonyl/carboxyl groups and a decrease in hydroxyl groups.44 Additionally, an increased degree of oxidation was associated with elevated decomposition temperatures. In comparison, native starch underwent decomposition at 317.8 °C, while oxidized starches decomposed at 322.7 °C (10 wt% NaCl, 12 V, 30 min), 319 °C (15 wt% NaCl, 24 V, 30 min), and 318 °C (15 wt% NaCl, 24 V, 120 min). The slight decrease in decomposition temperature observed in oxidized starches with extended electrolysis duration, higher salt concentration, and increased applied voltage might be attributed to a reduction in the starch granule size, shorter amylose chains, and a higher proportion of amylopectin following filtration.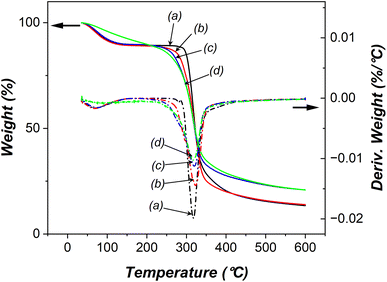 | ||
| Fig. 7 Thermal gravimetric analysis of (a) native starch, and oxidized starches using (b) 10 wt% NaCl, 12 V, 30 min, (c) 15 wt% NaCl, 24 V, 30 min, and (d) 15 wt% NaCl, 24 V, 120 min. | ||
3.11 Pasting properties
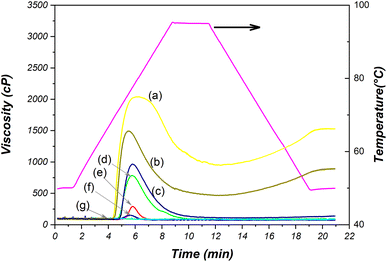
This section investigated changes in starch granules during gelatinization and retrogradation using the Rapid Visco-Analyzer. The results were presented in Fig. 8 and Table S1 (ESI).† During the heating process, starch molecules undergo significant rearrangements that lead to a notable change in viscosity. The lowest temperature needed for both native and oxidized starches to undergo gelatinization is referred to as the pasting temperature (PT). Peak viscosity (PV) gauges the maximum viscosity achieved by starches when a temperature-dependent balance is struck between swelling and leaching.35Upon considering the modification of starch under severe conditions (15 wt% NaCl, 24 V, 120 min), it becomes evident that the gelatinization and retrogradation properties are lost. This is manifested by the occurrence of consistent viscosity (91.0 cP) during testing. This outcome is attributed to significant alterations in the morphology of starch granules, as can be observed in Fig. 4i and j. The oxidized starch sample subjected to these conditions exhibits heightened hardness and is almost translucent, setting it apart from native starch.
The pasting temperature (PT) of native cassava starch is 68.3 °C. When cassava starch is oxidized under different conditions (varying concentrations of NaCl, applied voltage, and electrolysis time), the resulting starches exhibit higher pasting temperatures, ranging from 69.1 to 73.5 °C (Table S1, ESI).† These effects, including the lack of indications for swelling, gelatinization, and retrogradation behaviors during the pasting test, as well as the elevated pasting/gelatinizing temperature,45 result from a significant reduction in starch granule size, a notably low amylose content, and an increase in crystallinity.46
Next, the study compares native starch and oxidized starches in terms of viscosity properties. Native starch has the highest peak viscosity (PV) of 1996 cP, while oxidized starches show reduced PV values due to depolymerization reactions caused by acid-thinning and oxidation, which occur mainly in the amorphous area of the starch granules.47 Breakdown viscosity (BDV) measures starch's resistance to heat and shear.35 Native starch has the highest BDV of 1065 cP, while certain oxidized starches under specific electrolysis conditions may exhibit no BDV due to reduced resilience (the ability to absorb and store energy when it is deformed), refer to Table S1, ESI.†
The final viscosity (FV) of starch indicates how amylose molecules assemble and increase viscosity upon cooling. Among the tested starches, native starch has the highest FV at 1511 cP. The oxidized starches showed reduced FV values ranging from 869.4 cP to 73.0 cP (Table S1, ESI).† This reduction is primarily influenced by the remaining amount of amylose after electrolysis, which affects water retention. Starch granules with lower water absorption and smaller size demonstrate less development of final viscosity upon cooling.35
Setback viscosity (SBV) is a measure of how starch forms gels or retrogrades.48 Native starch has an SBV of 579.7 cP. In general, the oxidized starches had lower SBV values, while some oxidized starches had no SBV at all (Table S1, ESI†). Setback is the process in which tangled starch molecules reassociate to create a network that retains water. Native starches displayed higher setback than modified ones, suggesting they are more stable against retrogradation, or the process of forming such networks.
4 Conclusions
We have developed a method for modifying starch using electrolysis of chloride salts to generate oxidizing chlorine species, including Cl2, HClO, and ClO−, in situ. This method utilizes low-cost, abundant, and non-hazardous chloride salts, which are regenerated after starch oxidation. This offers a sustainable, cost-effective, and readily available green technology for starch modification. Our research extensively delved into the influence of various electrolysis parameters, such as chloride content, applied voltage, and electrolysis time, on the resulting starch properties. The modification process has demonstrated the ability to increase carbonyl and carboxyl contents in the starch, while concurrently reducing the size of starch granules. It has also improved moisture resistance and crystallinity, raised the decomposition temperature, and altered pasting properties. These outcomes would be advantageous for utilizing modified starch in various applications, such as coatings, food additives, and packaging.Conflicts of interest
The authors declare no known competing financial interests or personal relationships that could have appeared to influence the work reported in this paper.Acknowledgements
This work was supported by (i) Suranaree University of Technology (SUT), (ii) Thailand Science Research and Innovation (TSRI), and (iii) National Science, Research and Innovation Fund (NSRF) (project code 90464). We also acknowledge funding from (i) Suranaree University of Technology (SUT), (ii) Thailand Science Research and Innovation (TSRI), and (iii) National Science, Research and Innovation Fund (NSRF; NRIIS number 189603).References
- M. A. V. T. Garcia, C. F. Garcia and A. A. G. Faraco, Pharmaceutical and biomedical applications of native and modified starch: A review, Starch/Staerke, 2020, 72(7–8), 1900270 CrossRef CAS.
- R. Chakraborty, P. Kalita and S. Sen, Natural Starch in Biomedical and Food Industry: Perception and Overview, Curr. Drug Discovery Technol., 2019, 16(4), 355–367 CrossRef CAS PubMed.
- M. A. Labelle, P. Ispas-Szabo and M. A. Mateescu, Structure-functions relationship of modified starches for pharmaceutical and biomedical applications, Starch/Staerke, 2020, 72(7–8), 2000002 CrossRef CAS.
- N. Thanyapanich, A. Jimtaisong and S. Rawdkuen, Functional properties of banana starch (Musa spp.) and its utilization in cosmetics, Molecules, 2021, 26(12), 3637 CrossRef CAS PubMed.
- G. F. Schutz, R. M. V. Alves and R. P. Vieira, Development of Starch-Based Films Reinforced with Coffee Husks for Packaging Applications, J. Polym. Environ., 2023, 31(5), 1955–1966 CrossRef CAS.
- H. Onyeaka, et al., Current research and applications of starch-based biodegradable films for food packaging, Polymers, 2022, 14(6), 1126 CrossRef CAS PubMed.
- S. P. Bangar, et al., Native and modified biodegradable starch-based packaging for shelf-life extension and safety of fruits/vegetables, Int. J. Food Sci. Technol., 2023, 58(2), 862–870 CrossRef CAS.
- L. M. Fonseca, et al., Oxidation of potato starch with different sodium hypochlorite concentrations and its effect on biodegradable films, LWT–Food Sci. Technol., 2015, 60(2), 714–720 CrossRef CAS.
- F. Zhou, et al., Potato starch oxidation induced by sodium hypochlorite and its effect on functional properties and digestibility, Int. J. Biol. Macromol., 2016, 84, 410–417 CrossRef CAS PubMed.
- M. K. Chapagai, et al., Multiple length scale structure-property relationships of wheat starch oxidized by sodium hypochlorite or hydrogen peroxide, Carbohydr. Polym. Technol. Appl., 2021, 2, 100147 CAS.
- C. Beninca, et al., Thermal, rheological, and structural behaviors of natural and modified cassava starch granules, with sodium hypochlorite solutions, J. Therm. Anal. Calorim., 2013, 111, 2217–2222 CrossRef CAS.
- N. Javadian, A. Mohammadi Nafchi and M. Bolandi, The effects of dual modification on functional, microstructural, and thermal properties of tapioca starch, Food Sci. Nutr., 2021, 9(10), 5467–5476 CrossRef CAS PubMed.
- S. Suri and A. Singh, Modification of starch by novel and traditional ways: influence on the structure and functional properties, Sustainable Food Technol., 2023, 1(3), 348–362 RSC.
- S. S. Panchal and D. V. Vasava, Biodegradable polymeric materials: synthetic approach, ACS Omega, 2020, 5(9), 4370–4379 CrossRef CAS PubMed.
- Q. Chen, et al., Recent progress in chemical modification of starch and its applications, RSC Adv., 2015, 5(83), 67459–67474 RSC.
- S. Punia Bangar, et al., Enzymatic modification of starch: A green approach for starch applications, Carbohydr. Polym., 2022, 287, 119265 CrossRef CAS PubMed.
- T. M. Hoogstad, et al., Environmental Impact Evaluation for Heterogeneously Catalysed Starch Oxidation, ChemistryOpen, 2022, 11(10), e202200029 CrossRef CAS PubMed.
- H. M. Palma-Rodriguez, et al., Effect of acid treatment on the physicochemical and structural characteristics of starches from different botanical sources, Starch/Staerke, 2012, 64(2), 115–125 CrossRef CAS.
- C. I. La Fuente, et al., Ozonation of cassava starch to produce biodegradable films, Int. J. Biol. Macromol., 2019, 141, 713–720 CrossRef CAS PubMed.
- M. R. Nemţanu and M. Braşoveanu, Exposure of starch to combined physical treatments based on corona electrical discharges and ionizing radiation. Impact on physicochemical properties, Radiat. Phys. Chem., 2021, 184, 109480 CrossRef.
- A. Rahaman, et al., Ultrasound based modification and structural-functional analysis of corn and cassava starch, Ultrason. Sonochem., 2021, 80, 105795 CrossRef CAS PubMed.
- K. Lewicka, P. Siemion and P. Kurcok, Chemical modifications of starch: microwave effect, Int. J. Polym. Sci., 2015, 2015, 867697 Search PubMed.
- Y. Li, et al., The effects of pulsed electric fields treatment on the structure and physicochemical properties of dialdehyde starch, Food Chem., 2023, 408, 135231 CrossRef CAS PubMed.
- M. Guschakowski and U. Schröder, Direct and Indirect Electrooxidation of Glycerol to Value-Added Products, ChemSusChem, 2021, 14(23), 5216–5225 CrossRef CAS PubMed.
- P. Parpot, et al., TEMPO mediated oxidation of carbohydrates using electrochemical methods, Cellulose, 2010, 17, 815–824 CrossRef CAS.
- C. Ni-na, et al., Indirect Electrosynthesis of Double Aldehyde Starch Using Pb-(BrO_3∼-/Br∼-) as Electro-catalytic Mediator, J. Electrochem., 2009, 15(4), 458 Search PubMed.
- W. Chong, et al., The influence of ultrasound on the degree of oxidation of hypochlorite-oxidized corn starch, LWT–Food Sci. Technol., 2013, 50(2), 439–443 CrossRef CAS.
- N. L. Vanier, et al., Molecular structure, functionality and applications of oxidized starches: A review, Food Chem., 2017, 221, 1546–1559 CrossRef CAS PubMed.
- E. Henry Omoregie, Chemical Properties of Starch and Its Application in the Food Industry, in Chemical Properties of Starch, ed. E. Martins, IntechOpen, Rijeka, 2019, Ch. 5 Search PubMed.
- M. Luna-Trujillo, et al., Formation of active chlorine species involving the higher oxide MOx+1 on active Ti/RuO2-IrO2 anodes: A DEMS analysis, J. Electroanal. Chem., 2020, 878, 114661 CrossRef CAS.
- C. Ronco and G. J. Mishkin, Disinfection by sodium hypochlorite: dialysis applications, Karger Medical and Scientific Publishers, 2007, Vol. 154 Search PubMed.
- S. Dimri, et al., Oxidation of Starch, in Starch: Advances in Modifications, Technologies and Applications, ed. V.S. Sharanagat, et al., Springer International Publishing, Cham, 2023, pp. 55–82 Search PubMed.
- R. Smith, 4. Carboxyl in XXV. Characterization and Analysis of Starches, Starch: Chem. Technol., 1967, 2, 620–622 Search PubMed.
- S. Chattopadhyay, R. S. Singhal and P. R. Kulkarni, Optimisation of conditions of synthesis of oxidised starch from corn and amaranth for use in film-forming applications, Carbohydr. Polym., 1997, 34(4), 203–212 CrossRef CAS.
- A. Chandak, et al., Effects of Cross-Linking on Physicochemical and Film Properties of Lotus (Nelumbo nucifera G.) Seed Starch, Foods, 2022, 11(19), 3069 CrossRef CAS PubMed.
- P. Chen, et al., Effect of acid hydrolysis on the multi-scale structure change of starch with different amylose content, Food Hydrocolloids, 2017, 69, 359–368 CrossRef CAS.
- Z. Wang, et al., Cassava starch: Chemical modification and its impact on functional properties and digestibility, a review, Food Hydrocolloids, 2022, 129, 107542 CrossRef CAS.
- L. Stone and K. Lorenz, The Starch of Amaranthus—Physico-chemical Properties and Functional Characteristics, Starch/Staerke, 1984, 36(7), 232–237 CrossRef CAS.
- L. Zhang, et al., Study on the morphology, crystalline structure and thermal properties of yellow ginger starch acetates with different degrees of substitution, Thermochim. Acta, 2009, 495(1–2), 57–62 CrossRef CAS.
- M. Jiang, et al., Effects of acid hydrolysis intensity on the properties of starch/xanthan mixtures, Int. J. Biol. Macromol., 2018, 106, 320–329 CrossRef CAS PubMed.
- D. G. Pereira and A. D. P. Beleia, Characterization of acid-thinned cassava starch and its technological properties in sugar solution, LWT--Food Sci. Technol., 2021, 151, 112151 CrossRef CAS.
- M. G. Lomelí-Ramírez, et al., Chemical and mechanical evaluation of bio-composites based on thermoplastic starch and wood particles prepared by thermal compression, BioResources, 2014, 9(2), 2960–2974 CrossRef.
- P. Deeyai, et al., Characterization of modified tapioca starch in atmospheric argon plasma under diverse humidity by FTIR spectroscopy, Chin. Phys. Lett., 2013, 30(1), 018103 CrossRef.
- P. Boonsuk, et al., Poly(vinyl alcohol)/modified cassava starch blends plasticized with glycerol and sorbitol, J. Appl. Polym. Sci., 2022, 139(24), 52362 CrossRef CAS.
- S. M. Chisenga, et al., Characterization of physicochemical properties of starches from improved cassava varieties grown in Zambia, AIMS Agric. Food., 2019, 4(4), 939–966 Search PubMed.
- J. G. Salcedo-Mendoza, et al., Enzymatic modification of cassava starch (Corpoica M-Tai) around the pasting temperature, Dyna, 2018, 85, 223–230 CrossRef.
- T. M. Ali and A. Hasnain, Morphological, Physicochemical, and Pasting Properties of Modified White Sorghum (Sorghum bicolor) Starch, Int. J. Food Prop., 2014, 17(3), 523–535 CrossRef CAS.
- S. Punia, et al., Pearl millet grain as an emerging source of starch: A review on its structure, physicochemical properties, functionalization, and industrial applications, Carbohydr. Polym., 2021, 260, 117776 CrossRef CAS PubMed.
Footnote |
| † Electronic supplementary information (ESI) available. See DOI: https://doi.org/10.1039/d3ra06382h |
| This journal is © The Royal Society of Chemistry 2023 |

