 Open Access Article
Computational medicinal chemistry applications to target Asian-prevalent strain of hepatitis C virus†
Rashid Hussain *a,
Zulkarnain Haidera,
Hira Khalid*a,
M. Qaiser Fatmib,
Simone Carradori
 c,
Amelia Cataldic and
Susi Zarac
aDepartment of Chemistry, Forman Christian College University, Lahore-54000, Pakistan. E-mail: hirakhalid@fccollege.edu.pk; rashid.bioinfo@gmail.com
bDepartment of Biosciences, COMSATS University Islamabad, Park Road, Chak Shahzad, Islamabad 45600, Pakistan
cDepartment of Pharmacy, “G. d’Annunzio” University of Chieti-Pescara, via dei Vestini 31, 66100 Chieti, Italy
First published on 16th October 2023
Abstract
Hepatitis C Virus (HCV), affecting millions of people worldwide, is the leading cause of liver disorder, cirrhosis, and hepatocellular carcinoma. HCV is genetically diverse having eight genotypes and several subtypes predominant in different regions of the globe. The HCV NS3/4A protease is a primary therapeutic target for HCV with various FDA-approved antivirals and several clinical developments. However, available protease inhibitors (PIs) have lower potency against HCV genotype 3 (GT3), prevalent in South Asia. In this study, the incumbent computational tools were utilized to understand and explore interactions of the HCV GT3 receptor with the potential inhibitors after the virtual screening of one million compounds retrieved from the ZINC database. The molecular dynamics, pharmacological studies, and experimental studies uncovered the potential PIs as ZINC000224449889, ZINC000224374291, and ZINC000224374456 and the derivative of ZINC000224374456 from the ZINC library. The study revealed that these top-hit compounds exhibited good binding and better pharmacokinetics properties that might be considered the most promising compound against HCV GT3 protease. Viability test, on primary healthy Human Gingival Fibroblasts (HGFs) and cancerous AGS cell line, was also carried out to assess their safety profile after administration. In addition, Surface Plasmon Resonance (SPR) was also performed for the determination of affinity and kinetics of synthesized compounds with target proteins.
Introduction
Hepatitis C Virus (HCV) is a member of the Flaviviridae family that was first discovered in 1989.1 According to the World Health Organization (WHO), HCV is responsible for more than 185 million infections worldwide, making it a significant global public health issue.2 The virus is most commonly transmitted through contact with infected blood, such as sharing of needles among injection drug users, and unsafe medical procedures, including blood transfusions and organ transplants prior to the implementation of screening procedures. It can also be transmitted through unprotected sexual contact, perinatally from mother to child during childbirth, and in rare cases through occupational exposure to infected blood. HCV infections can lead to chronic hepatitis, cirrhosis, liver failure, and liver cancer, highlighting the importance of effective prevention and treatment strategies.3,4The HCV genome exhibits high genetic diversity, with eight major genotypes and 87 subtypes identified to date.5,6 This genetic diversity is due to the high mutation rate in the HCV genome, i.e., 10−3 substitutions per site per year.7 It contributes to the difficulty in developing effective vaccines and antiviral therapies against HCV. However, understanding the structure and function of the HCV genome provides insights into viral replication and pathogenesis, and can inform the development of new therapeutic strategies to combat HCV infections. The genome of the Hepatitis C Virus (HCV) is a single-stranded, positive-sense RNA molecule that contains approximately 9.6 kilobases in length. The RNA genome consists of an open reading frame (ORF), 5′ untranslated region (UTR), and 3′ UTR.
HCV encodes a single polyprotein that is processed into at least 10 individual proteins, including six non-structural (NS) proteins and three structural proteins. The NS proteins consist of ion channel (p7), auto-protease (NS2), protease and helicase (NS3), co-factor (NS4A), membrane-associated protein (NS4B), phosphor-protein (NS5A), and RNA-dependent RNA polymerase (NS5B). These proteins are responsible for various functions in viral replication, assembly, and immune evasion. NS3 has both protease and helicase activity and is essential for the replication of the HCV genome. NS5B is an RNA-dependent RNA polymerase, which is essential for viral replication, and is also the target of several antiviral drugs. NS5A is a multi-functional protein that plays a critical role in viral replication, assembly, and modulation of host immune responses. The three structural proteins include capsid (C) and envelope proteins (E1 and E2). The capsid protein forms the nucleocapsid core of the viral particle, while the envelope proteins are responsible for viral entry into host cells and are the main targets of neutralizing antibodies. E2 is also involved in viral attachment to host cells, while E1 is required for viral fusion with host cell membrane.8–10 To cure HCV, it's important to identify the most suitable drug target. There are various tools available for this purpose, including the prediction of chokepoints for drug-target identification. This process involves identifying metabolic reactions that either consume a unique substrate or produce a unique product, which can then be used as potential drug targets.11–13 In general, both the non-structural and structural proteins of HCV are crucial to the viral life cycle and represent critical targets for antiviral therapies. Inhibition of NS3/4A protease and NS5B polymerase has been shown to be effective in treating HCV infection, and ongoing research is focused on developing new drugs that target other HCV proteins, including NS5A and the envelope proteins.14–16
Currently, available drugs for HCV treatment are not equally effective against all genotypes. Most of these drugs are designed to target genotype 1, while little attention has been given to developing drugs specific to genotype 3a. This is partly due to the lack of a crystal structure of NS3 GT3, which makes it difficult to design genotype-specific drugs. Recent studies have identified specific mutations at key residues that are responsible for the lower response of genotype 3a to existing drugs.7 On the other hand, in silico calculations are among essential therapeutic strategies, particularly where the experimental structure of the target proteins has not been revealed yet. In addition, molecular modeling methods help us understand drug-target interactions and discover novel drug candidates.
Our recent studies have used several in silico tools to target HCV NS3 protease.17–19 Similar studies were carried out for quest of finding suitable drugs against different diseases.20–25 Finally, to determine the safety profile of the best-in-class compounds, we assayed them at two fixed concentrations (10 and 50 µM) and discrete time points (48 and 72 h) on healthy primary Human Gingival Fibroblasts (HGFs) and a cancerous cell line (AGS, gastric adenocarcinoma) by means of the MTT test. The former cell type has been selected as they represent the first cell population to be in contact with the compounds after oral administration.26
Material and methods
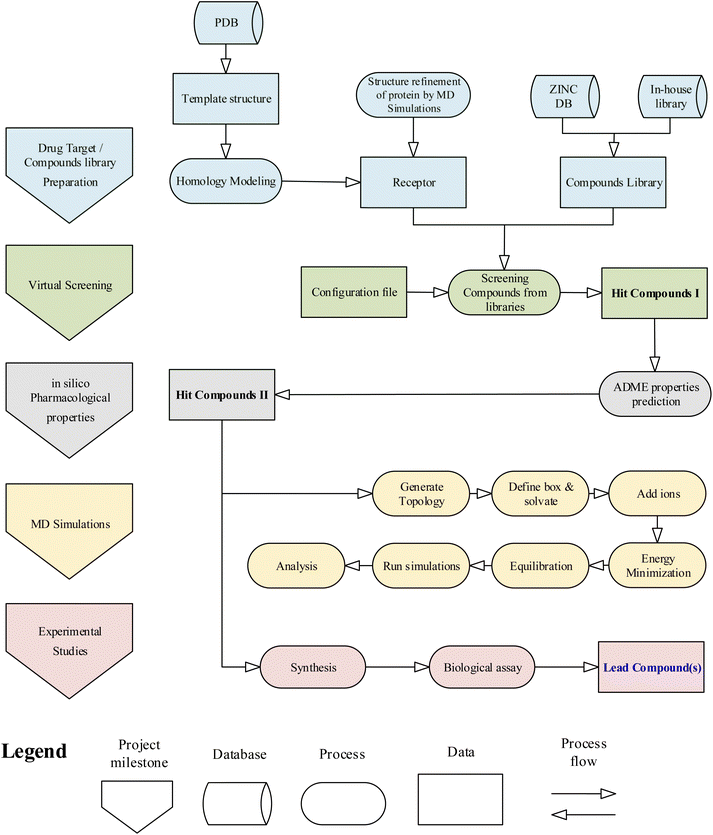
The general workflow of the research project is given in the flowchart (Fig. 1). Initially, the computational studies were conducted to find potential inhibitors against the drug target HCV NS3 GT3. The computational results were then validated using experimental methods. The methods and techniques used in computational and experimental studies are given below.Computational studies
![[thin space (1/6-em)]](https://www.rsc.org/images/entities/char_2009.gif) 30 in the following steps:
30 in the following steps:(1) Receptor and ligand structure preparation: The model protein of HCV NS3 GT3 was opened using UCSF Chimera. The Dock prep module of Chimera was used for receptor preparation.
(2) Sphere generation and selection: The binding groove sphere of 3 Å was generated by using the knowledge of docked ligand of the template protein PDB ID: 4I31.
(3) Grid generation: The grid around the receptor's active site was generated by keeping the distance between grid points along each axis.
(4) Docking: Rigid ligand docking was performed in which the ligand was kept completely rigid during the orientation step.
![[thin space (1/6-em)]](https://www.rsc.org/images/entities/char_2009.gif) 000 steps of the steepest descent minimization algorithm to avoid any bad contacts generated while solvating the system. To stabilize the environment equilibration of the system was conducted in two phases. The first phase was conducted under an NVT ensemble (constant number of particles, volume, and temperature) by keeping the temperature at 300 K and pressure coupling off. In the second phase, NPT ensemble (constant number of particles, pressure, and temperature) was used to keep pressure coupling at 1 bar. The Leapfrog integrator was used to integrate the Newtonian equation of motion with 25,000,000 steps. SHAKE algorithm was used to fix all bond distances involving hydrogen atoms; therefore, the time step was increased to 2 femtoseconds (fs), making the total duration of the simulation 50 ns. The Lenard–Jones equation was used to calculate van der Waal's interactions. The short-range neighbour list cut-off, short-range electrostatic cut-off, and short-range van der Waal's cut-off were fixed at 1 nm. The conformations of the homology model generated during the 50 ns MD simulation were compared with those obtained for simulations of the template crystal structure, 4I31.pdb, performed using the same parameters and conditions.
000 steps of the steepest descent minimization algorithm to avoid any bad contacts generated while solvating the system. To stabilize the environment equilibration of the system was conducted in two phases. The first phase was conducted under an NVT ensemble (constant number of particles, volume, and temperature) by keeping the temperature at 300 K and pressure coupling off. In the second phase, NPT ensemble (constant number of particles, pressure, and temperature) was used to keep pressure coupling at 1 bar. The Leapfrog integrator was used to integrate the Newtonian equation of motion with 25,000,000 steps. SHAKE algorithm was used to fix all bond distances involving hydrogen atoms; therefore, the time step was increased to 2 femtoseconds (fs), making the total duration of the simulation 50 ns. The Lenard–Jones equation was used to calculate van der Waal's interactions. The short-range neighbour list cut-off, short-range electrostatic cut-off, and short-range van der Waal's cut-off were fixed at 1 nm. The conformations of the homology model generated during the 50 ns MD simulation were compared with those obtained for simulations of the template crystal structure, 4I31.pdb, performed using the same parameters and conditions.To assess the results of virtual screening by USCF DOCK6, MD simulations of top-hit compounds were carried out at 100 ns. In addition, the hit compounds complexed with the modeled protein were undergone for protein–ligand complex simulations. The topologies of the receptor and each top-hit compound were prepared separately and then joined into a single GROMACS file. The system is finally prepared and run after solvation, ionization, energy minimization, and equilibration.
Experimental studies
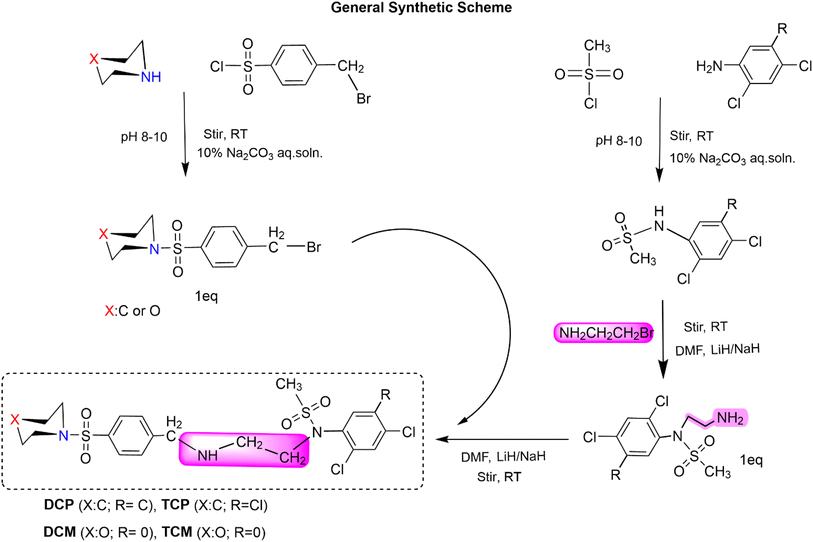
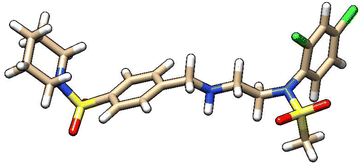
Synthesis of N-(2-(4-(piperidin-1-ylsulfonyl)benzylamino)ethyl)-N-(2,4,5-trichlorophenyl)methanesulfonamide (TCP). 1-(4-(Bromomethyl)phenylsulfonyl)piperidine (0.1749 g) was taken in a round-bottomed flask (150 mL) and dissolved into 5% DMF (15 mL). N-(2-Aminoethyl)-N-(2,4,5-tri-chlorophenyl)methanesulfonamide (0.15 g) was added to it and stirred at room temperature for 8 hours. Lithium hydride (0.002 g) was also added as a catalyst. TLC (hexanes, acetate; 80
![[thin space (1/6-em)]](https://www.rsc.org/images/entities/char_2009.gif) :
:![[thin space (1/6-em)]](https://www.rsc.org/images/entities/char_2009.gif) 20) showed a single spot. The reaction mixture was quenched with chilled water, and the product precipitated, filtered, and dried.
20) showed a single spot. The reaction mixture was quenched with chilled water, and the product precipitated, filtered, and dried.
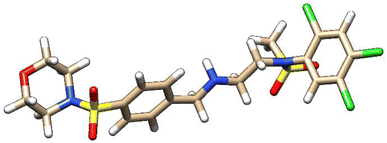
Synthesis of N-(2-(4-(morpholinosulfonyl)benzyl amino)ethyl)-N-(2,4,5-trichlorophenyl)methanesulfonamide (TCM). 4-(4-(Bromomethyl)phenylsulfonyl)morpholine (0.17375 g) was taken in the round-bottomed flask (150 mL) and dissolved into 5% DMF (15 mL). N-(2-Aminoethyl)-N-(2,4,5-trichlorophenyl)methanesulfonamide (0.15 g) was added to it and stirred at room temperature for 8 hours 15 minutes. Lithium hydride (0.002 g) was also added as a catalyst. TLC (hexanes, acetate; 80
![[thin space (1/6-em)]](https://www.rsc.org/images/entities/char_2009.gif) :
:![[thin space (1/6-em)]](https://www.rsc.org/images/entities/char_2009.gif) 20) showed a single spot. The reaction mixture was quenched with chilled water, and the product precipitated, filtered, and dried.
20) showed a single spot. The reaction mixture was quenched with chilled water, and the product precipitated, filtered, and dried.
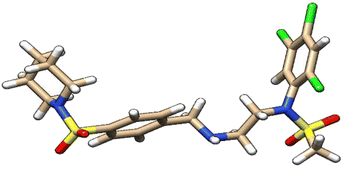
Synthesis of N-(2,4-dichlorophenyl)-N-(2-(4-(piperidin-1-ylsulfonyl)benzylamino)ethyl)methanesulfonamide (DCP). N-(2-Aminoethyl)-N-(2,4-dichlorophenyl)methanesulfonamide (0.34 g) was taken in a round-bottomed flask (150 mL) and dissolved into 5% DMF (15 mL). 1-(4-(Bromomethyl)phenylsulfonyl)piperidine (0.38 g) was added to it and stirred at room temperature for 10 hours. Lithium hydride (0.002 g) was also added as a catalyst. TLC (hexanes, acetate; 80
![[thin space (1/6-em)]](https://www.rsc.org/images/entities/char_2009.gif) :
:![[thin space (1/6-em)]](https://www.rsc.org/images/entities/char_2009.gif) 20) showed a single spot. The reaction mixture was quenched with chilled water, and the product precipitated, filtered, and dried.
20) showed a single spot. The reaction mixture was quenched with chilled water, and the product precipitated, filtered, and dried.
Synthesis of N-(2,4-chlorophenyl)-N-(2-(4-(morpholinosulfonyl)benzyla-mine)ethyl)methanesulfonamide (DCM). N-(2-Aminoethyl)-N-(2,4-chlorophenyl)methanesulfonamide (0.35 g) was taken in the round-bottomed flask (150 mL) and dissolved into 5% DMF (15 mL). 4-(4-(Bromomethyl)phenylsulfonyl)morpholine (0.4 g) was added to it and stirred at room temperature for 6 hours. Lithium hydride (0.002 g) was also added as a catalyst. TLC (hexanes, acetate; 80
![[thin space (1/6-em)]](https://www.rsc.org/images/entities/char_2009.gif) :
:![[thin space (1/6-em)]](https://www.rsc.org/images/entities/char_2009.gif) 20) showed a single spot. The reaction mixture was quenched with chilled water, and the product precipitated, filtered, and dried.
20) showed a single spot. The reaction mixture was quenched with chilled water, and the product precipitated, filtered, and dried.
Biological evaluations
HGF and AGS culture. A total of 10 healthy donors, who undergone to third molars extraction, signed the informed consent according to the Italian Law and to the Ethical Principles for Medical Research code including Human Subjects of the World Medical Association (Declaration of Helsinki). The project was approved by the Local Ethical Committee of the University of Chieti (Chieti, Italy, approval number. 1173, approved on 31/03/2016). Gingiva biopsies were rinsed in phosphate-buffered saline (PBS), placed in Dulbecco's modified Eagle's medium (DMEM), cut into smaller pieces, and cultured in DMEM, with 10% foetal bovine serum (FBS), 1% penicillin/streptomycin and 1% fungizone (all purchased from Merck Life Science, Milan, Italy). After 10 days of culture, fungizone was removed from the medium, and cells cultured until 5–8 passages. AGS human gastric adenocarcinoma cell line (ECACC 89090402, Merck Life Science, Milan, Italy) was cultured in Ham's F12 medium with 10% of FBS, 1% of penicillin/streptomycin, and 1% of L-glutamine (all purchased from Merck Life Science). Both cell cultures were maintained at 37 °C within an incubator in the presence of 5% (v/v) CO2.
HGF and AGS treatment. For each compound, a stock solution of 0.1 M was prepared using DMSO as a vehicle. Then, the stock solution was diluted in DMEM or Ham's F12 medium (for HGFs and AGS, respectively) to obtain intermediate solutions of 100 µM and final solutions of 50 and 10 µM for HGFs and 50 µM for AGS. To exclude DMSO cytotoxicity, the final concentration of DMSO within the culture medium was kept at 0.05%. The HGFs and AGS cells were seeded at 6700 and 8000 cells per well, in a 96 multiwell plate, respectively. After 24 h from seeding, the medium (DMEM and Ham's for HGFs and AGS, respectively) was replaced by a fresh one containing compounds at 10 and 50 µM for HGFs. In AGS culture newly synthesized compounds were administered at 50 µM. Treatments were maintained from 48 to 72 h within an incubator in a humified atmosphere in the presence of 5% (v/v) CO2 at 37 °C.
The selected compound was initially prepared as 10 mM DMSO stock solutions, and compound solutions with a series of increasing concentrations (2.4–1500 5-fold dilution) were applied to all four channels at a 30 µL min−1 flow rate at 25 °C. Sensorgrams were analysed using BIA evaluation software 3.0, and response unit difference (ΔRU) values at each concentration were measured during the equilibrium phase. All data were double referenced with both blank surface and zero compound concentration responses and fitted with the steady-state affinity equation below where y is the response, Ymax is the maximum response and x is the compound concentration.34 Refer to Appendix-D† for pH scouting.
Results and discussion
Computational studies
| S. no. | Molecule ID | Structure | DOCK 6 results | Molecular properties |
|---|---|---|---|---|
a milog![[thin space (1/6-em)]](https://www.rsc.org/images/entities/char_2009.gif) P: log P: log![[thin space (1/6-em)]](https://www.rsc.org/images/entities/char_2009.gif) P (octanol/water partition coefficient), TPSA: molecular polar surface area, MW: molecular weight, nON: number of hydrogen bond acceptors, nOHNH: number of hydrogen bond donors, nrotb: number of rotatable bonds. P (octanol/water partition coefficient), TPSA: molecular polar surface area, MW: molecular weight, nON: number of hydrogen bond acceptors, nOHNH: number of hydrogen bond donors, nrotb: number of rotatable bonds. |
||||
| 1 | ZINC000100685029 | 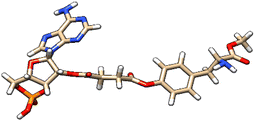 |
Grid score: −62.41 | milog![[thin space (1/6-em)]](https://www.rsc.org/images/entities/char_2009.gif) P: −1.11 P: −1.11 |
| DOCK rotatable bonds: 12 | TPSA: 239.57 | |||
| Molecular weight: 606.48 | natoms: 42 | |||
| Formal charge: 0.010 | MW: 606.49 | |||
| Grid VDW energy: −48.31 | nON: 17 | |||
| Grid ES energy: −14.10 | nOHNH: 5 | |||
| Internal energy repulsive: 17.97 | nrotb: 12 | |||
| Volume: 488.37 | ||||
| 2 | ZINC000005273907 | 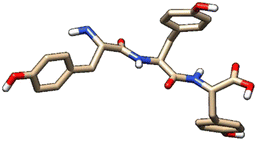 |
Grid score: −59.34 | milog![[thin space (1/6-em)]](https://www.rsc.org/images/entities/char_2009.gif) P: −0.87 P: −0.87 |
| DOCK rotatable bonds: 16 | TPSA: 182.20 | |||
| Molecular weight: 507.54 | natoms: 37 | |||
| Formal charge: 0.02 | MW: 507.54 | |||
| Grid VDW energy: −47.01 | nON: 10 | |||
| Grid ES energy: −12.32 | nOHNH: 8 | |||
| Internal energy repulsive: 15.78 | nrotb: 11 | |||
| Volume: 452.86 | ||||
| 3 | ZINC000003917816 | 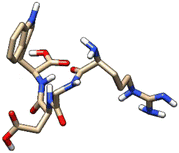 |
Grid score: −58.56 | milog![[thin space (1/6-em)]](https://www.rsc.org/images/entities/char_2009.gif) P: −4.31 P: −4.31 |
| DOCK rotatable bonds: 19 | TPSA: 265.61 | |||
| Molecular weight: 532.55 | natoms: 38 | |||
| Formal charge: −6.70 × 10⁻⁷ | MW: 532.56 | |||
| Grid VDW energy: −46.64 | nON: 15 | |||
| Grid ES energy: −11.92 | nOHNH: 12 | |||
| Internal energy repulsive: 17.74 | nrotb: 16 | |||
| Volume: 469.75 | ||||
| 4 | ZINC000101149671 | 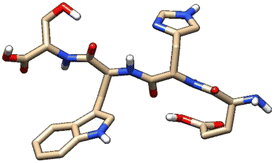 |
Grid score: −56.99 | milog![[thin space (1/6-em)]](https://www.rsc.org/images/entities/char_2009.gif) P: −4.48 P: −4.48 |
| DOCK rotatable bonds: 19 | TPSA: 252.62 | |||
| Molecular weight: 557.56 | natoms: 40 | |||
| Formal charge: 0.01 | MW: 557.56 | |||
| Grid VDW energy: −48.16 | nON: 15 | |||
| Grid ES energy: −8.83 | nOHNH: 10 | |||
| Internal energy repulsive: 15.16 | nrotb: 15 | |||
| Volume: 484.05 | ||||
| 5 | ZINC000101574832 | 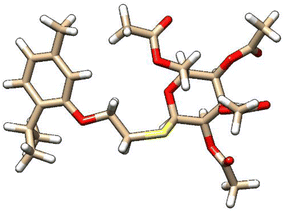 |
Grid score: −56.18 | milog![[thin space (1/6-em)]](https://www.rsc.org/images/entities/char_2009.gif) P: 3.99 P: 3.99 |
| DOCK rotatable bonds: 15 | TPSA: 123.69 | |||
| Molecular weight: 540.63 | natoms: 37 | |||
| Formal charge: −0.02 | MW: 540.63 | |||
| Grid VDW energy: −51.30 | nON: 10 | |||
| Grid ES energy: −4.88 | nOHNH: 0 | |||
| Internal energy repulsive: 33.20 | nrotb: 15 | |||
| Volume: 488.47 | ||||
| 6 | ZINC000224822442 | 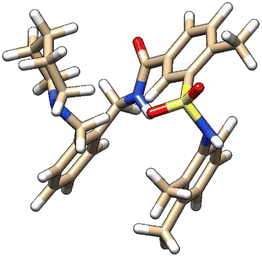 |
Grid score: −54.43 | milog![[thin space (1/6-em)]](https://www.rsc.org/images/entities/char_2009.gif) P: 5.14 P: 5.14 |
| DOCK rotatable bonds: 9 | TPSA: 78.50 | |||
| Molecular weight: 505.68 | natoms: 36 | |||
| Formal charge: −0.02 | MW: 505.68 | |||
| Grid VDW energy: −47.58 | nON: 6 | |||
| Grid ES energy: −6.85 | nOHNH: 2 | |||
| Internal energy repulsive: 37.15 | nrotb: 8 | |||
| Volume: 471.32 | ||||
| 7 | ZINC000224449889 | 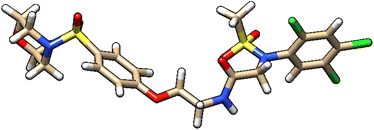 |
Grid score: −54.12 | milog![[thin space (1/6-em)]](https://www.rsc.org/images/entities/char_2009.gif) P: 3.75 P: 3.75 |
| DOCK rotatable bonds: 11 | TPSA: 122.33 | |||
| Molecular weight: 600.92 | natoms: 36 | |||
| Formal charge: 0.03 | MW: 600.93 | |||
| Grid VDW energy: −53.63 | nON: 10 | |||
| Grid ES energy: −0.48 | nOHNH: 1 | |||
| Internal energy repulsive: 17.71 | nrotb: 10 | |||
| Volume: 457.18 | ||||
| 8 | ZINC000224374291 | 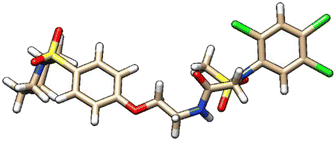 |
Grid score: −53.86 | milog![[thin space (1/6-em)]](https://www.rsc.org/images/entities/char_2009.gif) P: 4.82 P: 4.82 |
| DOCK rotatable bonds: 11 | TPSA: 113.09 | |||
| Molecular weight: 598.95 | natoms: 36 | |||
| Formal charge: 0.009 | MW: 598.96 | |||
| Grid VDW energy: −53.50 | nON: 9 | |||
| Grid ES energy: −0.35 | nOHNH: 1 | |||
| Internal energy repulsive: 16.58 | nrotb: 10 | |||
| Volume: 464.99 | ||||
| 9 | ZINC000224374456 | 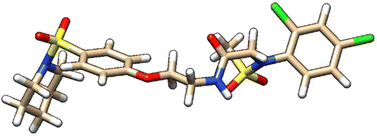 |
Grid score: −53.38 | milog![[thin space (1/6-em)]](https://www.rsc.org/images/entities/char_2009.gif) P: 4.21 P: 4.21 |
| DOCK rotatable bonds: 11 | TPSA: 113.09 | |||
| Molecular weight: 564.51 | natoms: 35 | |||
| Formal charge: −1.49 × 10⁻⁷ | MW: 564.51 | |||
| Grid VDW energy: −51.35 | nON: 9 | |||
| Grid ES energy: −2.03 | nOHNH: 1 | |||
| Internal energy repulsive: 45.04 | nrotb: 10 | |||
| Volume: 451.46 | ||||
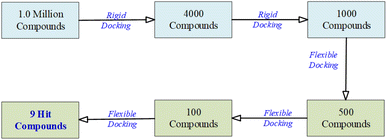
In the virtual screening process, the transition from an initial pool of 1000 compounds to a refined set of 9 hit compounds during the flexible docking stages involved a series of steps designed to identify compounds with progressively stronger binding affinities.
To accomplish this, flexibility was introduced by adjusting the number of orientations or poses during flexible docking. This adaptability further refined the selection from 1000 to 9 hit compounds. As the process advanced from 1000 to 500 to 100 compounds, the number of orientations or poses was increased to explore a broader conformational space. This approach facilitated a comprehensive evaluation of each compound's interactions with the NS3 protease receptor, capturing a wide range of binding modes.
The initial set of 1000 compounds, selected from the secondary rigid docking, underwent flexible docking using UCSF DOCK6's anchor and grow algorithm. Consistent parameters were applied to all compounds, with a focus on grid scores and binding affinities as the selection criteria. From this stage, compounds with the most favorable grid scores and binding affinities were identified. Those with the highest scores were considered for further refinement, resulting in the retention of the top 500 compounds.
Subsequently, a more detailed analysis of binding energies and receptor interactions was conducted for the top 500 compounds, maintaining the same docking parameters. This process allowed a focus on compounds with even stronger binding potential, leading to the selection of the top 100 compounds.
The top 100 compounds underwent intensive evaluation, using the same consistent docking parameters. A comprehensive analysis of their binding modes, energies, and interactions with the NS3 protease receptor was performed, ultimately resulting in the identification of the top nine compounds with the highest binding affinities, considered as the hit compounds.
Crystal structure of HCV NS3 protease
At the time of synopsis approval from the Board of Advance Studies and Research (BASR) dated 23rd April 2019, the crystal structure of HCV NS3 protease GT3a was not yet revealed. So, the homology model of HCV NS3 protease GT3a was constructed using SWISS-MODEL35 for computational studies. However, its structure was resolved by Timm, J. et al. and released by Protein DataBank on 10th Jun 2020 with PDB ID: 6P6S.36 However, its paper is not published to date. So, it became incumbent to compare the results with the crystal structure obtained against the modeled structure of NS3 protease. Hence, the structure and the docking results against the modeled protein were compared with the crystal structure.Comparison of crystal structure with the modelled protein
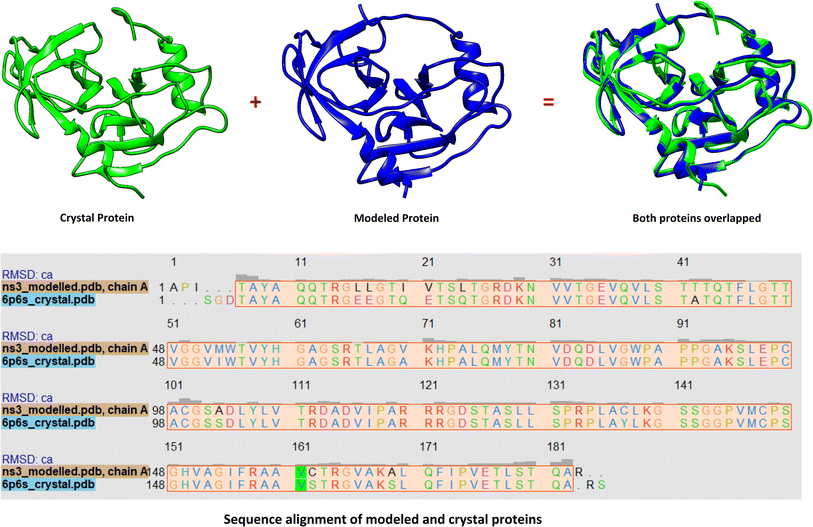
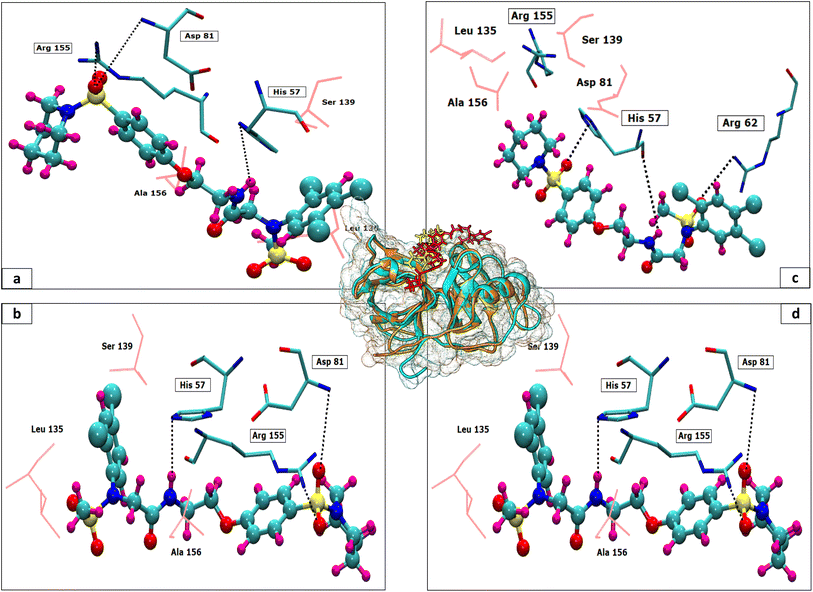
The 3D conformation of modeled NS3 protease and the recently reported crystal structure (PDB entry: 6P6S) exhibited similar coordinates, with an RMSD difference of 0.610 Å (Fig. 3). Furthermore, the sequence alignment of both proteins resulted in 100% sequence identity with an E-value of 2 × 10−145. The top hit compounds were also docked against the crystal structure of NS3 protease. The seven clinically validated reported compounds were also taken into consideration to assess the difference between the results of both proteins and the variation in results between the hit and the reported compounds (Table 2). Interestingly, under the same parameters, most of the hit compounds and the reported compounds exhibited better grid scores in the case of the modeled protein than that of the crystal structure. Except for a single compound, ZINC000101149671, the rest of the hit compounds exhibited a better grid score against the modeled protein than the crystal structure. Similarly, the clinically reported compounds, telaprevir, voxilaprevir, and simeprevir, demonstrated a better grid score, i.e., −50.90, −60.29, and −59.09 respectively, against the modeled protein compared to −49.79, −42.60, and −45.89 in the same order against the crystal structure. The compound Paritaprevir has almost the same grid score against both proteins (Table 2). Thus, the compound with a better grid score will have better binding with the target protein and better inhibitory potential. Furthermore, when the hit compounds and the clinically validated compounds (control) are compared, most of the hit compounds revealed better grid scores than the control compounds. In fact, the reported compounds, glecaprevir (−26.46), grazoprevir (−46.85), and boceprevir (−34.73), showed even lower grid scores than the hit compound with the lowest grid score i.e., −53.38 (Table 2). For a more detailed comparison, the top two hit compounds ZINC000224374291 and ZINC000224374456, are shown as docked poses into the active site of the modeled and template protein overlapping each other (Fig. 4). The docking score and intermolecular interaction of both compounds are given in detail in Table 3 and shown in Fig. 4. The catalytic triad residues, His57, Asp81, and Ser139, are predominant in the active site of both proteins along with binding groove residues, especially Arg155 and Ala156. The compound ZINC000224374291 makes three hydrogen bonds and three electrostatic interactions with the modeled protein as well as the crystal structure protein. The residues that are involved in hydrogen bonding are His57 (3.87 Å), Asp81 (5.00 Å), and Arg155 (2.87 Å) with the modeled protein. Similarly, the same residues form hydrogen bonds with the crystal protein with the bond length 5.00 Å, 5.21 Å, and 2.95 respectively. In the case of the compound, ZINC000224374456, there are three hydrogen bonds with the modeled protein and two bonds with the crystal structure protein. His57 is the dominant residue involved in hydrogen bonds. Ser139 and Ala156 of modeled protein are predominant in electrostatic interactions whereas Ser139 and Arg155 are major residues involved in electrostatic interactions in the case of crystal protein. The residue Leu135 is mainly responsible for van der Waals interactions for both the proteins (Table 3 and Fig. 4).| Molecule ID/name | Score of Modeled structure | Score of crystal structure |
|---|---|---|
| ZINC000100685029 | −62.41 | −59.62 |
| ZINC000005273907 | −59.34 | −52.02 |
| ZINC000003917816 | −58.56 | −63.77 |
| ZINC000101149671 | −56.99 | −58.79 |
| ZINC000101574832 | −56.18 | −50.33 |
| ZINC000224822442 | −54.43 | −48.15 |
| ZINC000224449889 | −54.12 | −48.30 |
| ZINC000224374291 | −53.86 | −50.07 |
| ZINC000224374456 | −53.38 | −50.13 |
| Paritaprevir | −55.25 | −55.62 |
| Glecaprevir | −26.46 | −44.46 |
| Grazoprevir | −46.85 | −64.67 |
| Telaprevir | −50.90 | −49.79 |
| Voxilaprevir | −60.29 | −42.60 |
| Simeprevir | −59.09 | −45.89 |
| Boceprevir | −34.73 | −46.79 |
| Molecule ID | DOCK6 score | Hydrogen bonds | Electrostatic interactions | Vdw interactions | ||
|---|---|---|---|---|---|---|
| Modelled protein | ZINC000224374291 | Grid score | −53.86 | Ser139 with trichloro-benzene ring | ||
| Grid VDW energy | −53.50 | His57 with amino group (3.87 Å) | Ala156 with carbonyl group | Leu135 with trichloro-benzene ring | ||
| Grid ES energy | −0.35 | Arg155 with sulfonamide (2.78 Å) | ||||
| Internal energy repulsive | 16.58 | |||||
| ZINC000224374456 | Grid score | −53.38 | His57 with amino group (2.82 Å) | Ser139 with trichloro-benzene ring | Leu135 with trichloro-benzene ring | |
| Grid VDW Energy | −51.35 | Asp81 with sulfonamide (3.76 Å) | Ala156 with carbonyl group | |||
| Grid ES energy | −2.03 | Arg155 with sulfonamide (2.59 Å) | ||||
| Internal energy repulsive | 45.04 | |||||
| Crystal protein | ZINC000224374291 | Grid score | −50.07 | |||
| Grid VDW energy | −45.42 | Ser139 with sulfonamide adjacent to piperidine ring | ||||
| Grid ES energy | −4.65 | Arg62 with sulfonamide (2.95 Å) | Arg155 with sulfonamide adjacent to piperidine ring | Leu135 with piperidine ring Ala156 with piperidine ring | ||
| Internal energy repulsive | 20.09 | |||||
| ZINC000224374456 | Grid score | −50.13 | Ser139 with sulfonamide adjacent to piperidine ring | |||
| Grid VDW energy | −44.66 | His57 with sulfonamide (3.02 Å) | Leu135 with piperidine ring Ala156 with piperidine ring | |||
| Grid ES energy | −5.46 | Ala133 with sulfonamide (2.95 Å) | Arg155 with sulfonamide adjacent to piperidine ring | |||
| Internal energy repulsive | 23.90 | |||||
Experimental studies
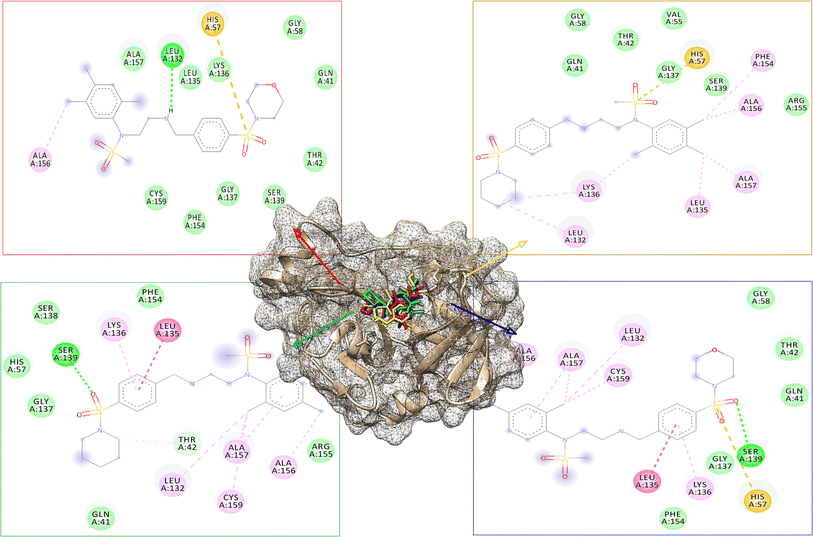
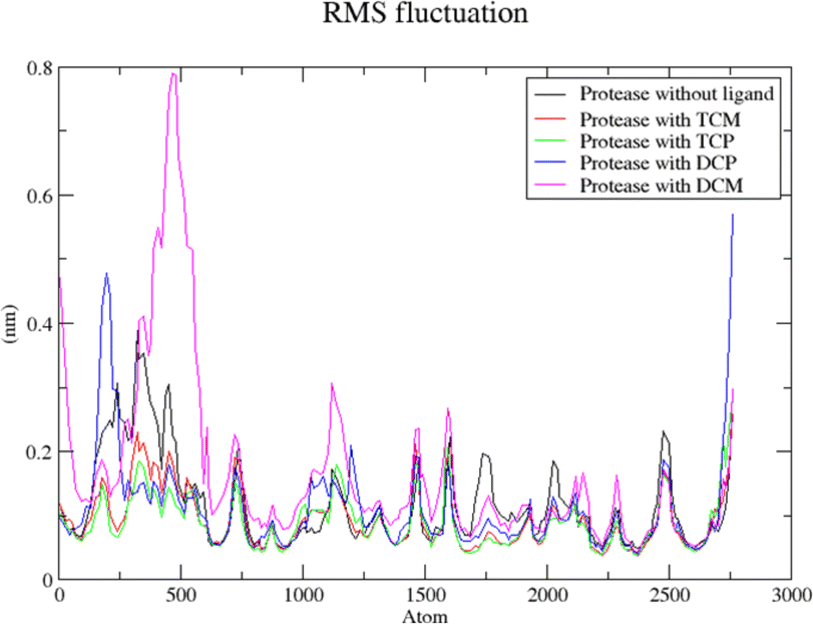
The modified compounds were re-evaluated against the modeled receptor and the crystal structure by performing their molecular docking, keeping the same parameters and conditions set for the hit compounds (Table 5). The intermolecular interactions between the modified hit compounds and the modeled protein are also depicted in Fig. 5. In the figure, Ser139 and His57 are identified as actively participating residues in the interactions between the protein and the hit compounds. Additionally, the Root Mean Square Fluctuation (RMSF) of the optimized compounds was calculated through MD simulations in the case of the modeled NS3 protease to further assess its flexibility inbound (complex with the hit compounds) and non-bound (single protein) (Fig. 6). The simulation result exhibit overall compactness in bound and non-bound form. More fluctuations were observed between the protein and compound DMC from atoms 300 to 600 and terminal residues in the case of compound DCP.
| Compound code | DOCK6 score of modelled NS3 GT3 | DOCK6 score of NS3 crystal structure |
|---|---|---|
| TCM | Grid score: −42.36 | Grid score: −45.45 |
| Grid VDW energy: −41.97 | Grid VDW energy: −45.06 | |
| Grid ES energy: −0.39 | Grid ES energy: −0.39 | |
| Internal energy repulsive: 14.18 | Internal energy repulsive: 10.30 | |
| TCP | Grid score: −43.11 | Grid score: −43.89 |
| Grid VDW energy: −42.14 | Grid VDW energy: −42.94 | |
| Grid ES energy: −0.97 | Grid ES energy: −0.94 | |
| Internal energy repulsive: 10.46 | Internal energy repulsive: 13.30 | |
| DCP | Grid score: −46.88 | Grid score: −43.11 |
| Grid VDW energy: −46.43 | Grid VDW energy: −42.43 | |
| Grid ES energy: −0.45 | Grid ES energy: −0.68 | |
| Internal energy repulsive: 13.60 | Internal energy repulsive: 18.54 | |
| DCM | Grid score: −45.77 | Grid score: −42.99 |
| Grid VDW energy: −45.62 | Grid VDW energy: −42.35 | |
| Grid ES energy: −0.14 | Grid ES energy: −0.63 | |
| Internal energy repulsive: 14.86 | Internal energy repulsive: 13.14 |
N-(2,4-Dichlorophenyl)-N-(2-((4-(morpholinosulfonyl)benzyl)amino)ethyl)methane sulfonamide (DCM)
 . The structure of DCM with the formula C20H25Cl2N3O5S2 is given above. It is solid, white in color, having a molecular weight of 520.49 g mol−1, a melting point of 125 °C, and is soluble in DMSO and chloroform. IR (cm−1) Vmax: 3256 (N–H), 2810 (Ar-H), 1336 (SO2 stretching), 1163 (C–N stretching), 1091 (C–O stretching); HRMS (m/z): [M + 1] 522.46 (13%), 522.06 (24%), 281.98 (68%), 240.07 (73%), 147.97 (64%), 91.05 (100.0%). Anal. calcd: C, 45.98; H, 4.82; N, 8.04; S, 12.27. Found: C, 46.02; H, 4.85; N, 8.06; S, 12.30. 1H NMR (400 MHz, acetone) δ 7.73–7.49 (m, 2H, H-3′ & H-5′), 7.43 (dd, 1H, J = 8.3, 0.5 Hz, H-6″), 7.35 (d, J = 2.4 Hz, 1H, H-3″), 7.17 (dd, J = 8.6, 2.4 Hz, 2H, H-2′ and H-6′), 6.98 (d, J = 8.6 Hz, 1H, H-5″), 3.92 (q, J = 7.1 Hz, 2H, CH2-9′), 3.60–3.43 (m, 4H, H-3, H-5), 2.77–2.70 (m, 4H, H-2 and H-6), 1.92 (dq, J = 4.5, 2.3 Hz, 2H, CH2-7′), 1.83 (s, 3H, CH3), 1.06 (t, J = 7.1 Hz, 2H, CH2-8′). The spectra of DCM are given in Appendix-C.†
N-(2-((4-(Morpholinosulfonyl)benzyl)amino)ethyl)-N-(2,4,5-trichlorophenyl)methane sulfonamide (TCM)
 . The fragment TCM with the formula C20H24Cl3N3O5S2 is given above. It is solid, brown in color, having a molecular weight of 522.47 g mol−1, a melting point of 95 °C, and is soluble in DMSO and chloroform. IR (cm−1) Vmax: 3251 (N–H), 2809 (Ar-H), 1337 (SO2 stretching), 1168 (C–N stretching), 1085 (C–O stretching); HRMS (m/z): [M+] 556.90 (13.0%), 315.60 (98%), 319.94 (3.5%), 240.07 (73%), 147.97 (64%), 91.05 (100.0%). Anal. calcd: C, 43.13; H, 4.34; N, 7.55; S, 11.52. Found: C, 43.16; H, 4.37; N, 7.58; S, 11.55. 1H NMR (400 MHz, acetone) δ 7.60 (dd, J = 8.5, 1.5 Hz, 2H, H-3′ & H-5′), 7.27 (dd, J = 7.9, 1.6 Hz, 2H, H-2′ & H-6′), 6.93 (dddd, J = 18.6, 8.2, 6.7, 1.4 Hz, 2H), 6.75 (t, J = 7.8 Hz, 1H), 6.62 (d, J = 8.1 Hz, 1H), 6.22 (dd, J = 7.4, 1.1 Hz, 1H), 5.24 (s, 2H), 2.89 (s, 14H), 2.06 (p, J = 1.8 Hz, 4H). The spectra of TCM are given in Appendix-C.†
N-(2,4-Dichlorophenyl)-N-(2-(4-(piperidin-1-ylsulfonyl)benzylamino)ethyl)methane sulfonamide (DCP)
 . The fragment DCP with the formula C21H27Cl2N3O4S2 is given above. It is solid, white in color, has a molecular weight of 520.49 g mol−1, a melting point of 125 °C, and is soluble in DMSO and chloroform. IR (cm−1) Vmax: 3277 (N–H), 2825 (Ar-H), 1334 (SO2 stretching), 1166 (C–N stretching), 1091 (C–O stretching); HRMS (m/z): [M + 1] 520.08 (13%), 519.08 (24%), 281.98 (68%), 238.09 (75%), 147.97 (64%), 91.05 (100.0%). Anal. calcd: C, 48.46; H, 5.23; N, 8.07; S, 12.32. Found: C, 48.50; H, 5.28; N, 8.12; S, 12.37. 1H NMR (400 MHz, acetone) δ 7.75–7.33 (m, 4H, H-3′, H-5′, H-3″ and H-6″), 7.17 (dd, J = 8.6, 2.4 Hz, 2H, H-2′, H-6′), 6.98 (d, J = 8.6 Hz, 1H, H-5″), 3.46 (s, 1H, H-7″), 2.72 (dt, J = 18.6, 6.8, 2.8 Hz, 4H, H-2 and H-6), 2.10–1.65 (m, 2H, H-4), 1.43 (p, J = 5.7 Hz, 2H, H-3 and H-5), 1.29 (d, J = 5.5 Hz, 2H, CH2-9′), 1.16 (s, CH3, 3H), 1.06 (d, J = 6.6 Hz, 2H, CH2-8′). The spectra of DCP are given in Appendix-C.†
N-(2-(4-(Piperidin-1-ylsulfonyl)benzylamino)ethyl)-N-(2,4,5-trichlorophenyl)methane sulfonamide (TCP)
 . The fragment TCP with the formula C21H26Cl3N3O4S2 is given above. It is solid, light brown in color, has a molecular weight of 554.94 g mol−1, a melting point of 153 °C, and is soluble in DMSO and chloroform. IR (cm−1) Vmax: 3189 (N–H), 2814 (Ar-H), 1325 (SO2 stretching), 1158 (C–N stretching), 1099 (C–O stretching); HRMS (m/z): [M+] 553.04 (15.0%), 315.59 (98%), 319.94 (3.5%), 238.32 (73%), 147.97 (64%), 91.05 (100.0%). Anal. calcd: C, 45.45; H, 4.72; N, 7.57; S, 11.56. Found: C, 45.50; H, 4.77; N, 7.62; S, 11.61. 1H NMR (400 MHz, DMSO) δ 7.71 (dd, J = 8.3, 6.6 Hz, 2H, H-3′ and H-5′), 7.62–7.52 (m, 2H, H-3″ and H-6″), 6.74–6.66 (m, 2H, H-2′ and H-6′), 4.55 (d, J = 6.0 Hz, 2H, CH2-9′), 4.03 (brs, 2H, CH2-7′), 3.62 (t, J = 4.7 Hz, 4H, H-2 and H-6), 3.16–3.10 (m, 2H, H-8′), 2.86 (q, J = 6.0 Hz, 4H, H-3 and H-5), 2.09 (s, 3H, CH3), 1.51–1.24 (m, 2H, H-4). The spectra of TCP are given in Appendix-C.†
Biological assay results
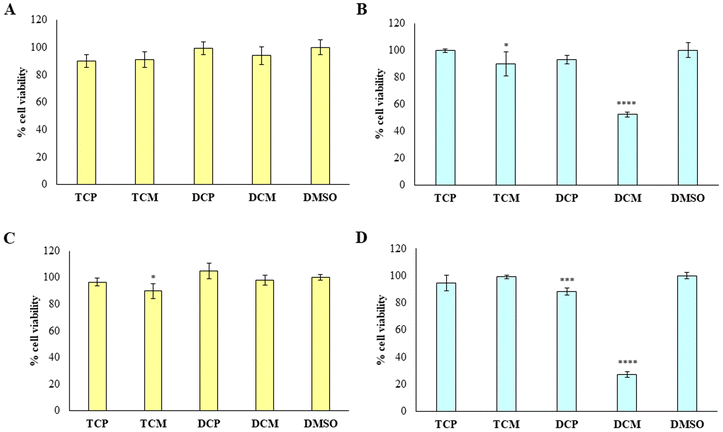
To provide the safety profile of these four promising compounds, firstly they have been tested on HGFs, at 10 and 50 µM for 48 h, comparing the results with the vehicle DMSO, assumed as control. The results reported in Fig. 7 demonstrated that at 10 µM, the four compounds didn't affect the cell viability of healthy cells, disregarding the substitution pattern, with respect to DMSO (Fig. 7A). At 50 µM (Fig. 7B), TCP and DCP show the same result, whereas a statistically significant reduction in cell viability is evidenced when TCM and DCM are administered with respect to DMSO, with a major extent for DCM (52% of cell viability), even if the cell viability rate never goes under 50%. Thus, for the four compounds, we can assume an IC50 > 50 µM at 48 h. After 72 h of treatment, when the newly synthesized compounds are administered at 10 µM, a lower viability level is recorded in the presence of TCM (89.9% of cell viability), while, TCP, DCP, and DCM do not reveal any significant modification of HGF viability with respect to control sample (DMSO) (Fig. 7C). At 50 µM the previous trend recorded after 48 h was confirmed (IC50 > 50 µM), evidencing a slight but statistically significant alteration of the non-cancerous cells' viability (IC50 ranging between 10 and 50 µM) after DCP and DCM administration (Fig. 7D).Then, the capability of the novel compounds to affect the viability of gastric adenocarcinoma AGS cell line at 50 µM (maximum concentration in the previous experiment after 48 (Fig. 8A) and 72 h (Fig. 8B) of treatment), has been determined. After 48 h of treatment, the cell viability percentage appears significantly reduced in the presence of TCP, DCP, and DCM compared to DMSO, with a major extent for DCM which leads to record an extremely low cell viability rate (5.7%). After 72 h of treatment, DCP still discloses a significant reduction of cell viability even if it is estimated to be of 96%, approximately. Conversely, DCM does not allow an AGS recovery considering that, after 72 h of treatment, the effect appears to be still strong keeping the cell viability level at very low percentages (6.8%). Thus, it can be argued that TCP, TCM, and DCP are well tolerated by AGS even if a slightly lower cell viability percentage with respect to HGFs (IC50 > 50 µM) can be highlighted. On the contrary, DCM exerts a marked and pronounced effect on tumoral cell viability with respect to healthy HGFs (IC50 < 50 µM). These results pinpoint how slight differences in the substitution pattern (the chlorine atom at position 5 in the morpholino series) could influence the selection of the administration dose to avoid unpleasant side effects.
Determination of dissociation equilibrium constant (KD) by SPR. SPR technique is an efficient biophysical method for the determination of affinity and kinetics of synthesized compounds with target proteins. The terms in SPR are a little different from conventional terminology. The ligand refers to the interactant attached to the sensor surface while the analyte is referred to as the interactant present in the sample solution injected over the surface. There are a number of coupling methods available for SPR studies depending on the target analyte and ligand.
In the presented study, we first tried the amine coupling method adopted from the Hyun Lee work.37 The amine coupling method did not work for our Hepatitis C Virus (HCV-1a) NS3 protease/helicase immunodominant region protein (aa 1356–1459, GST tag). As the used ligand was not stable enough to support amine coupling. After amine coupling, we tried the GST coupling method for the SPR study of one of the hits TCM. It is important to find suitable immobilization pH prior to immobilization. For the two different PH buffers (sodium acetate buffer pH −5.0 and pH 4.5) were used. The response (RU) was dropped at a lower pH so the immobilization buffer of pH 5.0 was proceeded for immobilization. The sensorgram begins flattening out after the covalent coupling, which may contribute to the robustness of the assay. The graphs of pH scouting are given in Appendix-D.†
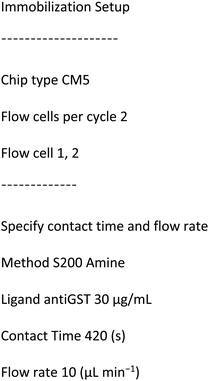
Following parameters were set for immobilization wizard:
The theoretical Rmax value calculated is 54.78 from 1864.2 RU, MWA 556.91 Da, MWL 37900 Da and SM 2. The Rmax value was calculated by using following equation:
![[thin space (1/6-em)]](https://www.rsc.org/images/entities/char_2009.gif) :
:![[thin space (1/6-em)]](https://www.rsc.org/images/entities/char_2009.gif) 2), RU = immobilized amount.
2), RU = immobilized amount.
Single-cycle runs were used for small molecule binding analysis. The buffer used to prepare the protein samples was HBS-EP (20 mM HEPES, 150 mM NaCl, 10 mM MgCl2, 0.01% Tween 20, pH = 7.4). For runs with small molecules, an additional 1% DMSO was added for solubility. GST capture kit conditions (Cytiva catalog number BR100223) were used to capture anti-GST antibody on both the sample and reference cells (7 min immobilization, 10 µL min−1 flow rate). Both surfaces had high-affinity sites capped with an additional 3 min of GST flowed over (5 µg mL−1 concentration, 5 µL min−1 flow rate) followed by regeneration (10 mM glycine, pH = 2.2). On the subtractive reference surface, GST was immobilized (10 µg mL−1, 5 µL min−1, 5 min). On the sample surface, GST-tagged HCV was immobilized in a similar fashion (10 µg mL−1, 5 µL min−1, 5 min). The wizard parameters for single-cell kinetics are given in Appendix-E.†
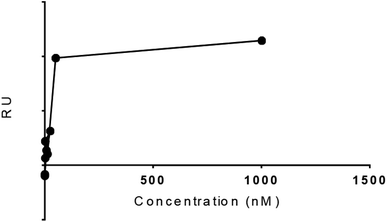
The experimental Rmax of TCM as function time was found 8.1 in FC 2–1 and KD value 1.01 × 10⁻¹¹. The five concentrations 2.4, 12, 60, 300, and 1500![[thin space (1/6-em)]](https://www.rsc.org/images/entities/char_2009.gif) µM were formed for TCM to study the dose–response curve as shown (Fig. 9), the following curve shows the increase in response with sample concentration till 50 nM with RU 39.4 and keep increasing on higher concentration. These results gave encouragement to explore the other hits for the SPR binding and kinetics study. The dose response should be optimized further for more data points.
µM were formed for TCM to study the dose–response curve as shown (Fig. 9), the following curve shows the increase in response with sample concentration till 50 nM with RU 39.4 and keep increasing on higher concentration. These results gave encouragement to explore the other hits for the SPR binding and kinetics study. The dose response should be optimized further for more data points.
Conclusion
The computational chemistry, medicinal chemistry, and bioinformatics approaches have been employed to find protease inhibitors. This interdisciplinary methodology has enabled to analyze the problem under the wider scope. The study has revealed that theoretical results are corroborated by experimental findings. The molecular dynamics and pharmacokinetics studies revealed that the hit compounds ZINC000224449889, ZINC000224374291, and ZINC000224374456 and the derivative of ZINC000224374456 are potential drug contenders against HCV NS3 protease genotype 3a. The optimized compounds namely TCP, TCM, and DCP displayed a safe profile of cell viability (HGFs versus AGS) up to 50 µM, whereas DCM should be administered at lower concentrations.We got the limited time facility for SPR and TCM was selected for SPR studies to evaluate the binding and kinetics of the compounds against GST-HCV NS/34A protein. The group was able to purchase NS3/4A 1b GST tag HCV protein while NS3/4A 3b genotype is not available as an isolated recombinant protein for assay. SPR assay was developed for HCV by hit and trial method. It was found that the GST capture approach is effective for the HCV SPR assay. There is a need for the availability of our target genotype recombinant polyprotein for further exploration of hits for target-specific studies. Preliminary SPR results demonstrated that TCM was bound in 1![[thin space (1/6-em)]](https://www.rsc.org/images/entities/char_2009.gif) :
:![[thin space (1/6-em)]](https://www.rsc.org/images/entities/char_2009.gif) 1 binding mode with the target protein and was found effective at 50 nM concentration. We aim to run SPR assays of other hits on the availability of SPR facility in future.
1 binding mode with the target protein and was found effective at 50 nM concentration. We aim to run SPR assays of other hits on the availability of SPR facility in future.
Institutional review board statement
The study was conducted in accordance with the Declaration of Helsinki and was approved by the Local Ethical Committee of the University of Chieti-Pe-scara (Chieti, Italy, approval number. 1173, approved on 31/03/2016).Author contributions
Rashid Hussain: conceptualization; methodology; formal analysis; investigation; data curation; writing – original draft preparation; computational studies, preliminary synthesis. Zulkarnain Haider: writing, synthesis, characterization, investigation. Hira Khalid and Simone Carradori: writing – review and editing; project design and management, characterization; supervision, investigation; SPR studies. M. Qaiser Fatmi: review and editing; supervision. Susi Zara and Amelia Cataldi: cell-based assays.Conflicts of interest
None.Acknowledgements
IT department of Forman Christian College (A Chartered University), Lahore Pakistan, for cloud computing facility. Department of Medicinal Chemistry, University of Minnesota, Twin Cities, USA for high-resolution NMR and SPR facilities.References
- Q. L. Choo, G. Kuo, a J. Weiner, L. R. Overby, D. W. Bradley and M. Houghton, Science, 1989, 244, 359–362 CrossRef CAS PubMed.
- K. Mohd Hanafiah, J. Groeger, A. D. Flaxman and S. T. Wiersma, Hepatology, 2013, 57, 1333–1342 CrossRef PubMed.
- C. Ferri, M. Sebastiani, D. Giuggioli, M. Colaci, P. Fallahi, A. Piluso, A. Antonelli and A. L. Zignego, World J. Hepatol., 2015, 7, 327–343 CrossRef PubMed.
- I. Rusyn and S. M. Lemon, Cancer Lett., 2014, 345, 210–215 CrossRef CAS PubMed.
- S. M. Borgia, C. Hedskog, B. Parhy, R. H. Hyland, L. M. Stamm, D. M. Brainard, M. G. Subramanian, J. G. McHutchison, H. Mo, E. Svarovskaia and S. D. Shafran, J. Infect. Dis., 2018, 218, 1722–1729 CrossRef.
- D. B. Smith, J. Bukh, C. Kuiken, A. S. Muerhoff, C. M. Rice, J. T. Stapleton and P. Simmonds, https://talk.ictvonline.org/ictv_wikis/flaviviridae/w/sg_flavi/56/hcv-classification.
- K. Hara, M. M. Rivera, C. Koh, S. Sakiani, J. H. Hoofnagle and T. Heller, J. Clin. Microbiol., 2013, 03344 Search PubMed.
- J. Gentzsch, C. Brohm, E. Steinmann, M. Friesland, N. Menzel, G. Vieyres, P. M. Perin, A. Frentzen, L. Kaderali and T. Pietschmann, PLoS Pathog., 2013, 9, e1003355 CrossRef CAS PubMed.
- R. Bartenschlager, F.-L. Cosset and V. Lohmann, J. Hepatol., 2010, 53, 583–585 CrossRef PubMed.
- M. E. Major and S. M. Feinstone, Hepatology, 1997, 25, 1527–1536 CrossRef CAS PubMed.
- C. M. Taylor, Q. Wang, B. A. Rosa, S. C.-C. Huang, K. Powell, T. Schedl, E. J. Pearce, S. Abubucker and M. Mitreva, PLoS Pathog., 2013, 9, e1003505 CrossRef CAS.
- T. U. Chae, S. Y. Choi, J. W. Kim, Y.-S. Ko and S. Y. Lee, Curr. Opin. Biotechnol., 2017, 47, 67–82 CrossRef CAS PubMed.
- M. R. Riaz, G. M. Preston and A. Mithani, ACS Synth. Biol., 2020, 9, 1069–1082 CrossRef CAS.
- A. Grakoui, D. W. McCourt, C. Wychowski, S. M. Feinstone and C. M. Rice, J. Virol., 1993, 67, 2832–2843 CrossRef CAS.
- A. E. Gorbalenya, A. P. Donchenko, E. V Koonin and V. M. Blinov, Nucleic Acids Res., 1989, 17, 3889–3897 CrossRef CAS PubMed.
- C. Failla, L. Tomei and R. De Francesco, J. Virol., 1994, 68, 3753–3760 CrossRef CAS PubMed.
- M. U. Ashraf, K. Iman, M. F. Khalid, H. M. Salman, T. Shafi, M. Rafi, N. Javaid, R. Hussain, F. Ahmad, S. Shahzad-Ul-Hussan, S. Mirza, M. Shafiq, S. Afzal, S. Hamera, S. Anwar, R. Qazi, M. Idrees, S. A. Qureshi and S. U. Chaudhary, Med. Res. Rev., 2019, 39, 1091–1136 CrossRef CAS PubMed.
- R. Hussain, H. Khalid and M. Q. Fatmi, J. Comput. Biophys. Chem., 2021, 20, 631–639 CrossRef CAS.
- R. Hussain, H. Khalid and M. Q. Fatmi, Pure Appl. Chem., 2022, 1–10 Search PubMed.
- A. Śledź Pawełand Caflisch, Curr. Opin. Struct. Biol., 2018, 48, 93–102 CrossRef PubMed.
- M. Umer and M. Iqbal, World J. Gastroenterol., 2016, 22, 1684–1700 CrossRef CAS PubMed.
- A. Ece, J. Biomol. Struct. Dyn., 2020, 38, 565–572 CrossRef CAS PubMed.
- L. Llorach-Pares, A. Nonell-Canals, M. Sanchez-Martinez and C. Avila, Mar. Drugs, 2017, 15, 366 CrossRef PubMed.
- K. Chan, N. Frankish, T. Zhang, A. Ece, A. Cannon, J. O'Sullivan and H. Sheridan, J. Pharm. Pharmacol., 2020, 72, 927–937 CrossRef CAS PubMed.
- A. Maryam, R. R. Khalid, S. C. Vedithi, E. C. E. Abdulilah, S. S. Ç\inaro\uglu, A. R. Siddiqi and T. L. Blundell, Comput. Struct. Biotechnol. J., 2020, 18, 1625–1638 CrossRef CAS.
- M. A. Alagöz, Z. Özdemir, M. Uysal, S. Carradori, M. Gallorini, A. Ricci, S. Zara and B. Mathew, Pharmaceuticals, 2021, 14, 183 CrossRef PubMed.
- K.-B. Li, Bioinformatics, 2003, 19, 1585–1586 CrossRef CAS PubMed.
- G. N. Ramachandran, C. Ramakrishnan and V. Sasisekharan, J. Mol. Biol., 1963, 7, 95–99 CrossRef CAS PubMed.
- T. Sterling and J. J. Irwin, J. Chem. Inf. Model., 2015, 55, 2324–2337 CrossRef CAS PubMed.
- W. J. Allen, T. E. Balius, S. Mukherjee, S. R. Brozell, D. T. Moustakas, P. T. Lang, D. A. Case, I. D. Kuntz and R. C. Rizzo, J. Comput. Chem., 2015, 36, 1132–1156 CrossRef CAS PubMed.
- D. Van Der Spoel, E. Lindahl, B. Hess, G. Groenhof, A. E. Mark and H. J. C. Berendsen, J. Comput. Chem., 2005, 26, 1701–1718 CrossRef CAS.
- W. Kulig, M. Pasenkiewicz-Gierula and T. Róg, Data Brief, 2015, 5, 333–336 CrossRef PubMed.
- F. Jiang, C.-Y. Zhou and Y.-D. Wu, J. Phys. Chem. B, 2014, 118, 6983–6998 CrossRef CAS PubMed.
- D. J. Wood, S. Korolchuk, N. J. Tatum, L.-Z. Wang, J. A. Endicott, M. E. M. Noble and M. P. Martin, Cell Chem. Biol., 2019, 26, 121–130 CrossRef CAS PubMed.
- T. Schwede, J. Kopp, N. Guex and M. C. Peitsch, Nucleic Acids Res., 2003, 31, 3381–3385 CrossRef CAS PubMed.
- RCSB PDB – 6P6S: HCV NS3/4A protease domain of genotype 3a in complex with glecaprevir, https://www.rcsb.org/structure/6P6S, (accessed 13 September 2023) Search PubMed.
- J. Ren, I. Ojeda, M. Patel, M. E. Johnson and H. Lee, Bioorg. Med. Chem. Lett., 2019, 29, 2349–2353 CrossRef CAS PubMed.
Footnote |
| † Electronic supplementary information (ESI) available. See DOI: https://doi.org/10.1039/d3ra04622b |
| This journal is © The Royal Society of Chemistry 2023 |

