 Open Access Article
Creative Commons Attribution 3.0 Unported Licence
Study on the preparation and properties of Sn–0.7Cu–xBi alloy
Zhou Shenggang†
,
Zhang Yi†,
Duan Jihao,
Yue Anyu and
Cao Yong *
*
College of Materials Science and Engineering, Kunming University of Science and Technology, 121 Street, Wenchang Road 68, Kunming, 650093, China. E-mail: caoyong@kmust.edu.cn
First published on 4th December 2023
Abstract
This study investigated the impact of different bismuth (Bi) contents on the mechanical properties, melting point, and corrosion resistance of tin–copper (Sn–Cu) series alloys (Sn–0.7Cu). Furthermore, Sn–0.7Cu–xBi alloys with different Bi contents (x = 0, 3, 6, 9, 12, 15 wt%) were prepared through a traditional casting process. The composition and microstructure of the alloy were characterized via X-ray diffraction (XRD) and Scanning electron microscopy (SEM). The impact of Bi on the mechanical properties, melting point, and corrosion resistance of Sn–0.7Cu alloy was analyzed, reaching a peak at 12 wt% Bi. Furthermore, beyond this concentration, the mechanical properties of the alloy exhibited a decline. The corrosion resistance of Sn–0.7Cu–xBi alloys increased with increasing Bi content. However, when the Bi content was >12 wt%, owing to the aggregation of Bi in the alloy, the corrosion resistance of the alloy decreased.
1. Introduction
The development and application of solder alloys have consistently captured the attention of researchers. The properties of an alloy significantly influence its utility and lifespan. In traditional solder alloys, the widespread use of tin–lead (Sn–Pb) alloy in electronic, mechanical, construction, and various other fields is attributable to the excellent performance of Pb in solder. However, the chemical toxicity of Pb limits its application, making the exploration and development of Pb-free solder a prevailing trend.1To date, extensive research has been actively conducted on Pb-free alloys, particularly focusing on the corrosion resistance, mechanical properties, and physical characteristics of binary, ternary, and multicomponent Pb-free solder alloys like Sn–Cu, Sn–Ag, and Sn–Zn.2–7 Among these, the Sn–Cu series Pb-free alloy emerges as a promising material to replace Pb-based alloys due to its lower cost, reduced melting temperature, enhanced electrical conductivity, and ductility compared with the Sn–Ag and Sn–Zn systems.8–10 Nevertheless, an excess of Cu content in Sn–Cu series Pb-free alloys leads to the formation of coarse crystals, adversely affecting wettability and mechanical strength. In subsequent studies, the Sn-0.7Cu alloy, characterized by low-Cu content, lower cost, and excellent thermal fatigue properties, has garnered widespread attention.11,12 However, this binary alloy exhibits drawbacks such as poor wetting and mechanical properties, necessitating improvement through the addition of trace elements such as bismuth (Bi), nickel (Ni), indium (In), and others.13 For example, Yang et al. elucidated the impact of rare earth elements such as cerium (Ce), Ag, and Bi on the wetting and mechanical properties of Sn–Cu–Ni Pb-free solder.14 The addition of these elements has demonstrated a certain degree of improvement in alloy properties, indicating the positive effect of elements such as Bi on the mechanical properties.
Nevertheless, despite advancements in alloy composition, the progress of corrosion poses potential risks to personal safety and environmental health.15 Consequently, solder materials must exhibit significant corrosion resistance to ensure high connection reliability. At present, research on the corrosion resistance of solder is ongoing.16 For example, Gao et al. investigated the corrosion behavior of Sn–0.75Cu solder in 3.5 wt% NaCl solution, revealing the formation of pits on the solder surface.15 Similarly, Dheeraj et al. examined the corrosion phenomenon of Sn–9Zn–xCu solder alloy in 3.5 wt% NaCl solution, discussing the possible causes of Zn corrosion products and proposing accurate mechanisms.17 Studies have shown that the addition of Bi to Sn–0.7Cu alloy affects the electrochemical performance of the alloy to a certain extent, with limited research in this area.
Notably, no systematic study has been conducted on the influence of varying Bi concentrations (0, 3, 6, 9, 12, and 15 wt%) in Sn–0.7Cu on the mechanical properties, corrosion resistance, and other comprehensive properties of Sn–0.7Cu–xBi alloys. Therefore, this study aimed to explore the effect of adding Bi on the structure, melting characteristics, mechanical properties, and corrosion resistance of Sn–0.7Cu–xBi alloy. Additionally, the corrosion state and mechanism in a 3.5% NaCl solution were analyzed.
2. Materials and methods
2.1. Alloy preparation
Six types of Sn–0.7Cu–xBi alloys with different Bi content were synthesized using Sn, Bi, and Cu (purity > 99.99%). The alloy compositions are shown in Table 1. In this experiment, the alloy was prepared via the traditional casting process. Initially, the raw materials were immersed in 1 mol L−1 hydrochloric acid for 5–10 min to eliminate oxide films. Afterward, the materials were thoroughly rinsed and dried for subsequent use. Subsequently, the dried Sn–Cu alloy was placed into a porcelain crucible and then heated to 350 °C for melting in a well-type resistance furnace under protective gas.18 Bi was then introduced into the molten alloy, stirred every 15 min, and a specific amount of covering agent (KCl + LiCl) was evenly sprinkled on the surface for coverage. The mixture was kept warm for 1 hour under argon protection.19 Finally, the metal mixture, cooled to 300 °C, was poured into a graphite mold preheated at 150 °C and allowed to cool at room temperature to obtain the desired shape.| Alloy | Code | Density (g cm−3) | |
|---|---|---|---|
| Measured | Calculated | ||
Sn![[thin space (1/6-em)]](https://www.rsc.org/images/entities/char_2009.gif) : :![[thin space (1/6-em)]](https://www.rsc.org/images/entities/char_2009.gif) Cu = 99.3 Cu = 99.3![[thin space (1/6-em)]](https://www.rsc.org/images/entities/char_2009.gif) : :![[thin space (1/6-em)]](https://www.rsc.org/images/entities/char_2009.gif) 0.7 0.7 |
S1 | 7.108 | 7.290 |
Sn![[thin space (1/6-em)]](https://www.rsc.org/images/entities/char_2009.gif) : :![[thin space (1/6-em)]](https://www.rsc.org/images/entities/char_2009.gif) Cu Cu![[thin space (1/6-em)]](https://www.rsc.org/images/entities/char_2009.gif) : :![[thin space (1/6-em)]](https://www.rsc.org/images/entities/char_2009.gif) Bi = 96.3 Bi = 96.3![[thin space (1/6-em)]](https://www.rsc.org/images/entities/char_2009.gif) : :![[thin space (1/6-em)]](https://www.rsc.org/images/entities/char_2009.gif) 0.7 0.7![[thin space (1/6-em)]](https://www.rsc.org/images/entities/char_2009.gif) : :![[thin space (1/6-em)]](https://www.rsc.org/images/entities/char_2009.gif) 3 3 |
S2 | 7.278 | 7.346 |
Sn![[thin space (1/6-em)]](https://www.rsc.org/images/entities/char_2009.gif) : :![[thin space (1/6-em)]](https://www.rsc.org/images/entities/char_2009.gif) Cu Cu![[thin space (1/6-em)]](https://www.rsc.org/images/entities/char_2009.gif) : :![[thin space (1/6-em)]](https://www.rsc.org/images/entities/char_2009.gif) Bi = 93.3 Bi = 93.3![[thin space (1/6-em)]](https://www.rsc.org/images/entities/char_2009.gif) : :![[thin space (1/6-em)]](https://www.rsc.org/images/entities/char_2009.gif) 0.7 0.7![[thin space (1/6-em)]](https://www.rsc.org/images/entities/char_2009.gif) : :![[thin space (1/6-em)]](https://www.rsc.org/images/entities/char_2009.gif) 6 6 |
S3 | 7.395 | 7.404 |
Sn![[thin space (1/6-em)]](https://www.rsc.org/images/entities/char_2009.gif) : :![[thin space (1/6-em)]](https://www.rsc.org/images/entities/char_2009.gif) Cu Cu![[thin space (1/6-em)]](https://www.rsc.org/images/entities/char_2009.gif) : :![[thin space (1/6-em)]](https://www.rsc.org/images/entities/char_2009.gif) Bi = 90.3 Bi = 90.3![[thin space (1/6-em)]](https://www.rsc.org/images/entities/char_2009.gif) : :![[thin space (1/6-em)]](https://www.rsc.org/images/entities/char_2009.gif) 0.7 0.7![[thin space (1/6-em)]](https://www.rsc.org/images/entities/char_2009.gif) : :![[thin space (1/6-em)]](https://www.rsc.org/images/entities/char_2009.gif) 9 9 |
S4 | 7.448 | 7.463 |
Sn![[thin space (1/6-em)]](https://www.rsc.org/images/entities/char_2009.gif) : :![[thin space (1/6-em)]](https://www.rsc.org/images/entities/char_2009.gif) Cu Cu![[thin space (1/6-em)]](https://www.rsc.org/images/entities/char_2009.gif) : :![[thin space (1/6-em)]](https://www.rsc.org/images/entities/char_2009.gif) Bi = 87.3 Bi = 87.3![[thin space (1/6-em)]](https://www.rsc.org/images/entities/char_2009.gif) : :![[thin space (1/6-em)]](https://www.rsc.org/images/entities/char_2009.gif) 0.7 0.7![[thin space (1/6-em)]](https://www.rsc.org/images/entities/char_2009.gif) : :![[thin space (1/6-em)]](https://www.rsc.org/images/entities/char_2009.gif) 12 12 |
S5 | 7.494 | 7.521 |
Sn![[thin space (1/6-em)]](https://www.rsc.org/images/entities/char_2009.gif) : :![[thin space (1/6-em)]](https://www.rsc.org/images/entities/char_2009.gif) Cu Cu![[thin space (1/6-em)]](https://www.rsc.org/images/entities/char_2009.gif) : :![[thin space (1/6-em)]](https://www.rsc.org/images/entities/char_2009.gif) Bi = 84.3 Bi = 84.3![[thin space (1/6-em)]](https://www.rsc.org/images/entities/char_2009.gif) : :![[thin space (1/6-em)]](https://www.rsc.org/images/entities/char_2009.gif) 0.7 0.7![[thin space (1/6-em)]](https://www.rsc.org/images/entities/char_2009.gif) : :![[thin space (1/6-em)]](https://www.rsc.org/images/entities/char_2009.gif) 15 15 |
S6 | 7.569 | 7.582 |
2.2. Microstructural morphology and mechanical properties test
To observe the microstructure of the composite alloy, the melted alloy was cut into small squares (10 × 10 × 3 mm), polished successively with 600 #, 1000 #, 1500 #, 2000 #, and 2500 # water abrasive paper, and then polished with alumina polishing powder (0.5 μ particle size) until the alloy surface was so smooth as possible. After polishing, the alloy was subjected to ultrasonic cleaning for 30 min. Microstructure and morphology were observed via Scanning electron microscopy (SEM, Nova Nano), and element content and distribution were analyzed via Energy-dispersive X-ray energy spectrometry (EDS).Then, an X-ray diffractometer (XRD-7000) was used for phase analysis of the alloy to obtain its phase composition. Cu-Kα and 2θ/θ scanning modes were employed to characterize the deposition patterns within the range of 20–80°, with a scanning speed of 6° min−1. The measured XRD data were imported into Jade software and compared with standard cards to identify the phase composition of the alloy and a comparative analysis was conducted with the EDS results.
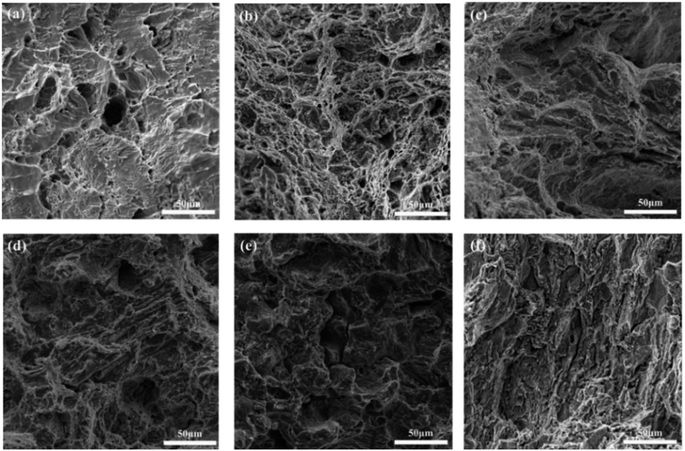
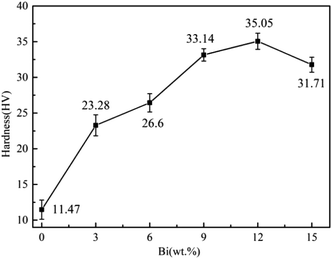
The Vickers hardness tester was employed to test the hardness value of the alloy under a specified load (F = 9.8 N). Additionally, a universal testing machine (SLFL-100KN) was utilized to conduct tensile tests at room temperature, generating stress–strain curves. The morphology of fracture surfaces was characterized using SEM.
Via differential scanning calorimetry (TGA/DSC/1600LF) in the temperature range of 25–300 °C under atmospheric nitrogen conditions with a flow rate of 20 ml min−1, and a heating rate is 10 °C min−1.
2.3. Electrochemical corrosion test
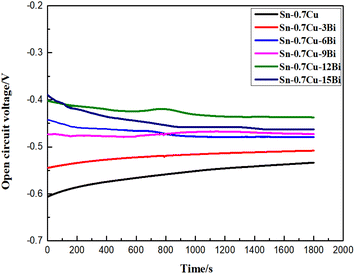
Electrochemical testing (CS2350H) of Sn–0.7Cu–xBi alloy was conducted using a classic three-electrode system. A 3.5 wt% NaCl solution served as the corrosion test solution. The previously polished Sn–0.7Cu–xBi alloy, connected using wires and sealed with epoxy resin, was used as the working electrode. A platinum electrode with an equivalent test area served as the auxiliary electrode, and a saturated calomel electrode was the reference electrode, forming a three-electrode system. Furthermore, before electrochemical impedance spectroscopy (EIS) measurement, an open circuit potential (OCP) test of 1800 s was conducted to confirm the stability of the working surface electrode. The polarization scanning range for this test was –1 V–1 V, with a scanning rate of 0.5 mV s−1,15,17 to obtain the potentiodynamic polarization curve of the alloy sample. Similarly, using CS Studio5 software, the polarization curve was fitted to obtain the self-correction potential (Ecorr) and self-correction current density (jcorr). An alternating current impedance test was conducted within the range of 0.01–100 kHz. After the test, appropriate equivalent circuits were selected using ZismDemo3.30d software for fitting and analyzing EIS data. Thus, electrochemical testing, SEM, EDS, and XRD were used to analyze the electrochemical corrosion morphology, elemental distribution, and phase composition of the alloy.3. Results and discussion
3.1. Microstructure and EDS analysis
Fig. 1 illustrates the microstructure and morphology of Sn–0.7Cu–xBi alloys with different Bi contents. Fig. 1(a) depicts the microstructure and morphology of Sn–0.7Cu alloy, where scattered dark black tissues were distributed on the gray Sn matrix. These dark black tissues corresponded to the intermetallic compound Cu6Sn5,18 as inferred from the binary phase diagram of Sn–Cu. Subsequently, figures (Fig. 1(b–f)) revealed significant alterations in the microstructure of the Sn–0.7Cu–xBi alloys due to the incorporation of Bi. The Bi-containing alloys exhibited a distinct Sn–Bi structure morphology, comprising white Bi phases and gray Sn solid solution with a lamellar distribution.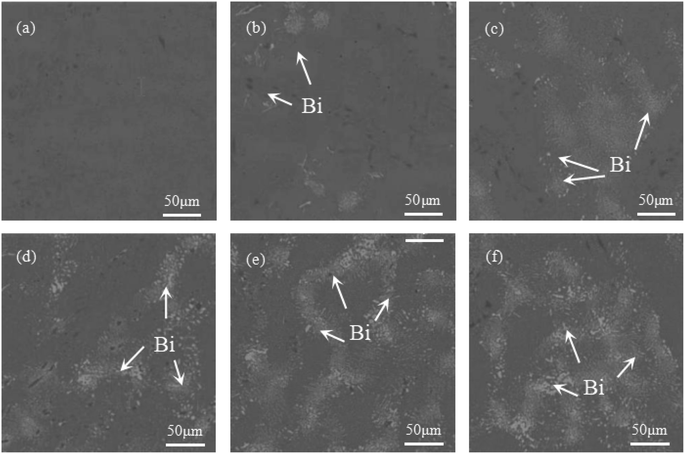 | ||
| Fig. 1 Microstructure and morphology of Sn–0.7Cu–xBi alloy: (a) Sn–0.7Cu; (b) Sn–0.7Cu–3Bi; (c) Sn–0.7Cu–6Bi; (d) Sn–0.7Cu–9Bi; (e) Sn–0.7Cu–12Bi; (f) Sn–0.7Cu–15Bi. | ||
In a comparative analysis of microstructures in Fig. 1(b), (d), and (f), it was observed that when the Bi content in the alloy was 3 wt%, there was only a small amount of fine Bi phase on the surface of the Sn matrix. At this time, Bi strengthened the second phase of the alloy and significantly improved the properties of the alloy. At 9 wt% Bi content, a uniform distribution of fine Bi phase with a fine needle-like pattern structure was observed, leading to further enhancement of alloy properties through dispersion strengthening. However, as the Bi content increases to 15 wt%, the limited solubility of Bi in Sn resulted in the precipitation of a large amount of Bi phase on the Sn base surface. This led to the coarsening and segregation of Bi, ultimately diminishing the alloy properties.
To further analyze the alloy element composition, an energy spectrum analysis was conducted on Sn–0.7Cu–12Bi alloy with 12 wt% Bi. Fig. 2 (1) revealed that the mass fraction of Sn in the alloy was 86.9 wt%, the mass fraction of Bi was 12.4 wt%, and the mass fraction of Cu was 0.7 wt%. This confirmed the uniform distribution of alloy elements during the refining process. Additionally, the energy spectrum analysis of Fig. 2(a) indicated that Sn was primarily distributed in the Sn-rich phase, while Cu was predominantly present in Cu6Sn5 intermetallic compounds.14 Furthermore, the addition of 12 wt% Bi resulted in the accumulation of pure Bi precipitates on the Sn phase surface, evenly distributed throughout the microstructure.
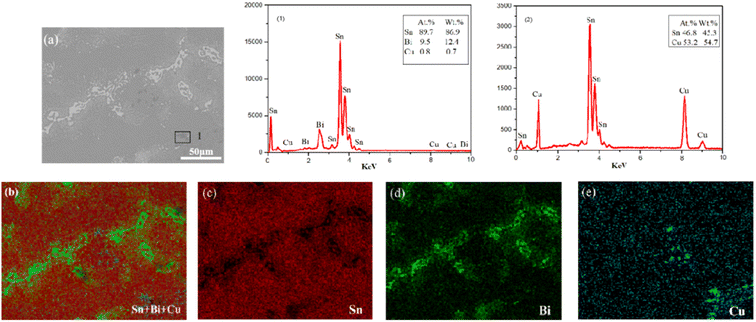 | ||
| Fig. 2 EDS elemental mapping analysis of Sn–0.7Cu–12Bi alloy: (b) Sn + Bi + Cu; (c) Sn; (d) Bi; (e) Cu. | ||
3.2. XRD analysis
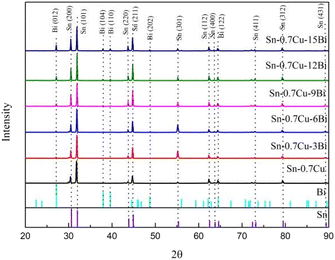
To determine the element composition of Sn–0.7Cu–xBi alloy, XRD analysis, and EDS analysis were conducted on alloys with different Bi contents. Fig. 3 shows the XRD results of alloys with different Bi contents. In Fig. 3, only the peak of the Sn phase was detected for Sn–0.7Cu, while with the addition of Bi, diffraction peaks of Bi phases became wider and higher, indicating the presence of Bi-rich phases. Alam et al. found that the addition of Bi to Sn–0.7Cu formed a Bi phase in Sn, and no new compounds were formed.18 The XRD diffraction patterns revealed that owing to the low amount of Cu in the alloy, there was no corresponding diffraction peak of the Cu. The XRD results confirmed the existence of Sn-rich and Bi-rich phases in Sn–0.7Cu–xBi alloy, consistent with phase diagram predictions for Sn–Bi–Cu alloy. The weak diffraction peaks of the formed Cu6Sn5 phase were not evident in the XRD patterns.143.3. Mechanical properties
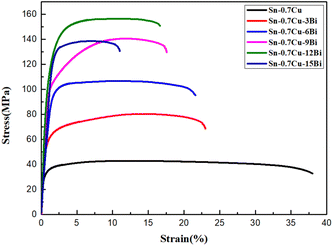
| Sample | Yield strength (MPa) | Tensile strength (MPa) | Elongation (%) |
|---|---|---|---|
| Sn–0.7Cu | 29.2 | 42.97 | 37.61 |
| Sn–0.7Cu–3Bi | 48.9 | 80.39 | 23.44 |
| Sn–0.7Cu–6Bi | 91.8 | 105.41 | 22.13 |
| Sn–0.7Cu–9Bi | 95.9 | 140.57 | 17.58 |
| Sn–0.7Cu–12Bi | 100 | 156.24 | 17.18 |
| Sn–0.7Cu–15Bi | 98.4 | 137.51 | 11.74 |
3.4. Melting properties test
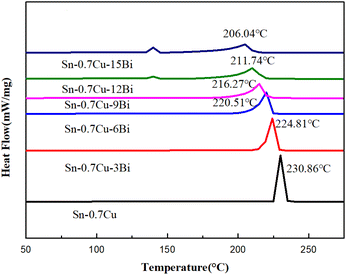
To study the effect of Bi content on the melting properties of the Sn–0.7Cu alloy, the melting properties of all six types of alloys were measured using DSC. Fig. 7 depicts the DSC curve of Sn–0.7Cu–xBi alloy. Some melting performance parameters and calculated melting range were obtained from the DSC curve (Table 3). In Fig. 7, it was evident that the Sn–0.7Cu–xBi alloy was non-eutectic. Unlike eutectic alloys, the melting process of non-eutectic alloys occurred within a specific melting range, rather than completing the solid–liquid transformation at a single point. When the Bi content in the alloy was <6 wt%, a solitary endothermic peak at 225 °C was observed on the DSC curve. However, when the Bi content exceeded 6 wt%, a weak endothermic peak emerged at 140 °C. Additionally, the previous peak and endothermic area peak increased with increased Bi content. According to the Sn–Bi binary phase diagram, this phenomenon was attributable to the segregation of the Bi portion, forming a solid solution with the matrix Sn at 140 °C, resulting in the formation of a small number of eutectic phases.| Alloy | Liquidus 1 (°C) | Melting point 1 (°C) | Solidus 1 (°C) | Liquidus 2 (°C) | Melting point 2 (°C) | Solidus 2 (°C) | Melting range (°C) |
|---|---|---|---|---|---|---|---|
| Sn–0.7Cu | — | — | — | 227.15 | 230.86 | 233.27 | 4.3 |
| Sn–0.7Cu–3Bi | — | — | — | 218.94 | 224.81 | 227.30 | 6.08 |
| Sn–0.7Cu–6Bi | 139.05 | 139.56 | 140.49 | 212.27 | 220.51 | 223.13 | 8.58 |
| Sn–0.7Cu–9Bi | 139.06 | 139.68 | 140.72 | 206.32 | 216.27 | 220.16 | 11.51 |
| Sn–0.7Cu–12Bi | 139.07 | 139.82 | 140.81 | 199.11 | 211.74 | 216.37 | 14.83 |
| Sn–0.7Cu–15Bi | 138.98 | 140.05 | 141.18 | 191.85 | 206.04 | 210.59 | 18.50 |
Furthermore, the DSC curve results indicated that the addition of Bi element had minimal effect on the small peak melting point of the alloy (Table 3). The small peak melting point of the Sn–0.7Cu–6Bi alloy was only 0.49 °C lower than that of the Sn–0.7Cu–15Bi alloy. This indicated that the melting point of the eutectic phase was relatively stable and slightly affected by the Bi content. Nevertheless, the melting point of the alloy, the melting point, solidus, and liquidus of Sn–0.7Cu alloy significantly decreased with the increase of Bi element content. The melting point decreased from 230.86 °C in the initial Sn–0.7Cu alloy to 206.04 °C in the Sn–0.7Cu–15Bi alloy, reducing 10.75%. Shen et al. also reported that adding Bi lowers the melting point of the Sn–Cu solder alloy.12 The low melting point nature of Bi, as a fusible alloy, led to the formation of a low melting point phase with Sn upon Bi addition, resulting in a continuous decrease in the melting point of the alloy. Further comparison of the melting range revealed an increase with higher Bi content.
3.5. Electrochemical corrosion performance test
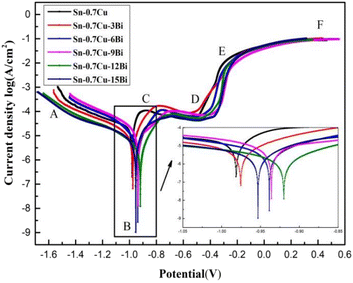
Furthermore, upon fitting the Tafel curve, the corrosion parameters of Sn–0.7Cu–xBi alloy were obtained (Table 4). Table 4 shows that the self-corrosion potential of Sn–0.7Cu–xBi alloy reached −0.92 V when the addition of Bi element was 12 wt%. From the perspective of corrosion thermodynamics, the higher the self-corrosion potential of an alloy, the smaller its corrosion tendency, indicating that the alloy was more stable and less susceptible to corrosion in a 3.5 wt% NaCl solution. However, this alone does not truly reflect the corrosion resistance of the alloy. In terms of alloy corrosion kinetics, the self-corrosion current density reflected the degree of corrosion in the NaCl solution. A lower self-corrosion current density corresponds to a slower corrosion rate. Table 4 demonstrates that at 12 wt% Bi, the alloy exhibited the lowest self-corrosion current density, 5.132 × 10⁻⁶. The polarization resistance (Rp) of the alloy supported this, with the higher polarization resistance observed at 12 wt% Bi, indicating superior corrosion resistance. Compared with pure Sn–0.7Cu alloy, the corrosion resistance of Sn–0.7Cu–12Bi alloy was significantly improved. In summary, the analysis indicated that adding an appropriate amount of Bi (<12 wt%) to the alloy enhanced grain refinement and dispersion strengthening, preventing corrosion erosion. This addition was beneficial to improve the corrosion resistance of the alloy. However, when the Bi content was >12 wt%, the coarsening of Bi elements intensified galvanic corrosion, selectively corroding the Sn matrix, leading to decreased corrosion resistance.
| Sample | Ecorr (mV) | jcorr (A cm−2) | Rp (Ω cm2) |
|---|---|---|---|
| Sn–0.7Cu | −981.25 | 3.465 × 10⁻⁵ | 3.276 × 10³ |
| Sn–0.7Cu–3Bi | −975.59 | 2.401 × 10⁻⁵ | 4.263 × 10³ |
| Sn–0.7Cu–6Bi | −938.55 | 1.464 × 10⁻⁵ | 4.869 × 10³ |
| Sn–0.7Cu–9Bi | −936.28 | 1.116 × 10⁻⁵ | 4.597 × 10³ |
| Sn–0.7Cu–12Bi | −920.08 | 5.132 × 10⁻⁶ | 12.012 × 10³ |
| Sn–0.7Cu–15Bi | −953.35 | 2.089 × 10⁻⁵ | 7.935 × 10³ |
| Sample | Rs (Ω cm2) | CPE | n | Rct (Ω cm2) |
|---|---|---|---|---|
| Sn–0.7Cu | 7.42 | 3.76 × 10⁻⁵ | 0.89 | 2.93 × 10⁴ |
| Sn–0.7Cu–3Bi | 8.69 | 3.44 × 10⁻⁵ | 0.91 | 4.65 × 10⁴ |
| Sn–0.7Cu–6Bi | 7.88 | 2.02 × 10⁻⁵ | 0.88 | 1.11 × 10⁵ |
| Sn–0.7Cu–9Bi | 7.39 | 1.61 × 10⁻⁵ | 0.86 | 1.76 × 10⁵ |
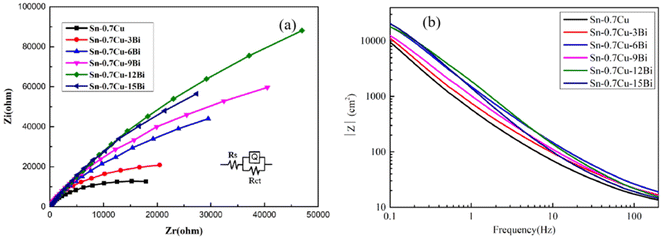
| Sn–0.7Cu–12Bi | 13.73 | 2.28 × 10⁻⁵ | 0.81 | 5.08 × 10⁵ |
| Sn–0.7Cu–15Bi | 7.19 | 1.34 × 10⁻⁵ | 0.82 | 3.67 × 10⁵ |
However, when the added Bi exceeded the solid solubility in Sn, Rct tended to decrease. Excessive Bi was therefore detrimental to the corrosion resistance of Sn–0.7Cu–xBi alloy. Similarly, Li et al. reported that an excess of Bi reduced the corrosion resistance of Sn–Cu alloy.13 This was attributable to the agglomerated Bi accumulation on the surface of Sn, which aggravated the pitting corrosion and reduced the corrosion resistance of the alloy.
| O2 + 2H2O = 4OH− + 4e− | (1) |
| 2H2O = 2OH− + H2 + 2e− | (2) |
The anodic reaction mainly involved the dissolution of active metals. Because the content of Cu in the alloy was low, Bi as the second phase in the alloy was still pure in the single phase. Therefore, the anodic reaction was the dissolution of Sn. Thermodynamically, Sn oxide was readily formed, making Sn hydroxide dehydrate to form Sn oxide.24–27 The specific reaction process was as follows:
| Sn + 2OH− = Sn(OH)2 + 2e− | (3) |
| Sn(OH)2 = SnO + H2O | (4) |
| Sn(OH)2 + 2OH− = Sn(OH)4 + 2e− | (5) |
| Sn(OH)4 = SnO2 + 2H2O | (6) |
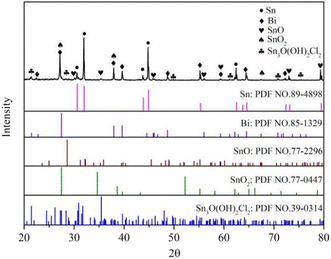
From Fig. 11, it was evident that the corrosion products of Sn–0.7Cu–xBi alloy after electrochemical corrosion exhibited diffraction peaks of Sn3O (OH)2Cl2 phase in addition to SnO and SnO2 phases, consistent with the results findings of Jaiswal et al.28 The chemical reaction equation is as follows:29,30
| 3Sn + 4OH− + 2Cl− = Sn3O(OH)2Cl2 + H2O + 6e− | (7) |
Therefore, the XRD analysis indicated that the corrosion products of the composite alloy mainly consisted of three compounds: SnO, SnO2, and Sn3O(OH)2Cl2.
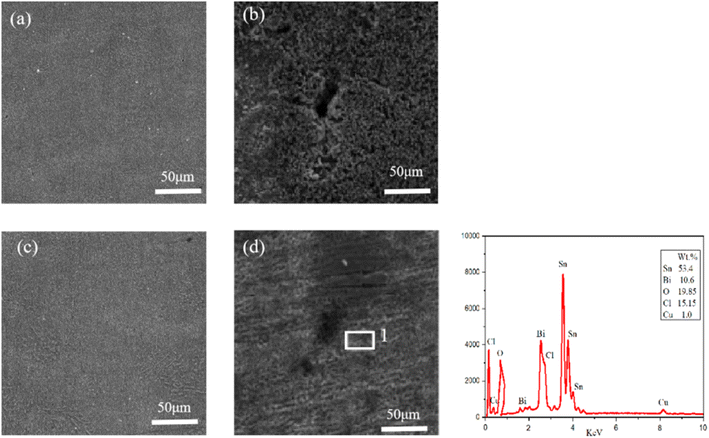
SEM tests were conducted on the electrochemical corrosion Sn–0.7Cu–xBi alloy, with Sn–0.7Cu alloy and Sn–0.7Cu–12Bi alloy serving as examples. The corrosion morphology, as shown in Fig. 12, revealed that the surface morphology of Sn–0.7Cu alloy was mainly composed of large flake and feather corrosion products. The surface was relatively loose, porous, and uneven in size, with a low stacking density. This indicated that the corroded surface only delayed corrosion, offering weak protection. However, Sn–0.7Cu–12Bi alloy exhibited a surface composed of small, uniform, and dense corrosion products, effectively restraining surface corrosion and providing strong protection. Both alloys have undergone localized corrosion, namely pore corrosion. The Sn–0.7Cu alloy exhibited larger and deeper corrosion pores compared with the Sn–0.7Cu–12Bi alloy. These pores served as channels for corrosive solutions, directly impacting the protective effect of corrosion products. Moreover, larger pores were prone to detachment, resulting in poor corrosion performance. This underscored the superior corrosion resistance of the Sn–0.7Cu–12Bi alloy. The EDS diagram at point 1 of Sn–0.7Cu–12Bi alloy indicated that the surface of the corroded alloy was composed of five elements: Sn, Bi, O, Cl, and Cu. The relatively high percentage of Sn was attributable to its significant proportion in the alloy. Despite the dissolution of Sn at the anode during electrochemical corrosion, a large portion of Sn remained uncorroded. Additionally, combining literature and XRD results, it was concluded that the corrosion products were composed of three compounds: SnO, SnO2, and Sn3O(OH)2Cl2, with the flake and feather-shaped corrosion products resulting from the corrosion of Sn.31
4. Conclusion
This study investigated the impact of Bi addition on the microstructure, mechanical properties, melting properties, and corrosion resistance of Sn–0.7Cu alloy. The conclusions drawn from the study are as follows:(1) The addition of an appropriate amount of Bi to Sn–0.7Cu alloy improved its overall properties due to the second-phase strengthening and dispersion strengthening. However, an excess of Bi led to supersaturation, coarsened segregation, and reduced alloy properties. The Sn–0.7Cu–xBi alloy was mainly composed of an Sn-rich phase, a Bi phase, and a small quantity of Cu6Sn5 intermetallic compounds.
(2) The addition of Bi to Sn–0.7Cu alloy played a significant role in grain refinement and dispersion strengthening, increasing the yield strength and tensile strength of the alloy. The tensile strength ranged from 42.97 MPa in Sn–0.7Cu alloy to 156.24 MPa in Sn–0.7Cu–12Bi alloy. Nevertheless, Sn–0.7Cu–15Bi alloy decreased due to the segregation and coarsening of supersaturation Bi in the alloy. The hardness of Sn–0.7Cu–12Bi alloy reached its maximum value at 35.05 HV. However, the addition of Bi significantly reduced the fracture elongation of the alloy and deteriorated its plasticity, with increasing Bi content. The fracture elongation decreased from 37.61% to 11.74%.
(3) The increased Bi content in the alloy led to a continuous decrease in the melting point of Sn–0.7Cu–xBi alloy, accompanied by an expansion of the melting range.
(4) Electrochemical corrosion testing revealed that Sn–0.7Cu–12Bi alloy exhibited superior corrosion resistance with the highest OCP, leading to a self-corrosion potential of −0.92 V. They exhibited the lowest self-corrosion current density of 5.13 × 10⁻⁶ and the highest Rct value of 5.08 × 10⁵. Conversely, pure Sn–0.7Cu alloy displayed the poorest corrosion resistance in a 3.5 wt% NaCl solution. Consequently, the addition of Bi significantly enhanced the corrosion resistance of Sn–0.7Cu alloy. Furthermore, XRD and EDS analyses identified three main corrosion products in the composite alloy: SnO, SnO2, and Sn3O(OH)2Cl2.
(5) In summary, Sn–0.7Cu–12Bi alloy exhibited excellent comprehensive properties.
Data availability
All data included in this study are available upon request by contact with the corresponding author.Author contributions
Methodology and writing-review and editing, SGZ; validation, writing-original draft, data curation, visualization, YZ; conceptualization, JHD; Resources and investigation, AYY; supervision and project administration, YC.Conflicts of interest
The authors declare that they have no known competing financial interests or personal relationships that could have appeared to influence the work reported in this paper.Acknowledgements
The authors would like to thank the financial supports for this work was provided by the regional fund of the national natural science foundation of China (52161024).References
- Y. Y. Zhang, On the development of Sn-Bi alloy solder, China Sci. Technol. Information, 2014, 492, 71–72 Search PubMed.
- B. Cui, et al., Exploring the role of indium on the microstructure evolution and interface bonding behavior of brazing diamond abrasive with modified Cu-Sn-Ti, Diamond Relat. Mater., 2023, 136, 110068 CrossRef CAS.
- Y. Cui, et al., Nucleation and growth of Ag3Sn in Sn-Ag and Sn-Ag-Cu solder alloys, Acta Mater., 2023, 249, 118831 CrossRef CAS.
- Y. H. Wei, et al., Effects of minor alloying with Ge and In on the interfacial microstructure between Zn–Sn solder alloy and Cu substrate, J. Alloys Compd., 2020, 831, 154812 CrossRef CAS.
- B. W. Shen, et al., Research Progress of New Low-temperature lead-free Welder, Precious Met., 2022, 43, 42–54 CAS.
- F. J. Wang, et al., Wettability, Interfacial Behavior and Joint Properties of Sn-15Bi Solder, J. Electron. Mater., 2019, 48, 6835–6848 CrossRef CAS.
- H. R. Kotadia, S. H. Mannan and A. Das, Influence of Zn Concentration on Interfacial Intermetallics During Liquid and Solid State Reaction of Hypo and Hypereutectic Sn-Zn Solder Alloys, J. Electron. Mater., 2019, 48, 2731–2736 CrossRef CAS.
- K. K. Xu, et al., Research Progress of Sn-Zn Bread, Mater. Mech. Eng., 2020, 44, 1–5+32 Search PubMed.
- B. X. Hao, X. Q. Li and H. Lin, Microstructure and properties of lead-free solder joints with Cu substrates, Weld. Technol., 2019, 48, 63–66 Search PubMed.
- J. L. Fan, et al., Research Progress of Micro-Alloying Sn-Cu Based Lead-Free Solders, Mater. Rep., 2018, 32, 3774–3779 Search PubMed.
- M. Zhao, L. Zhang and M. Y. Xiong, Research progress and development trend of Sn-Cu System, Mater. Rep., 2019, 33, 2467–2478 Search PubMed.
- H. Z. Huang, et al., Effect of adding Bi and P on the alloy properties of Sn-0.7Cu lead-free brder, Mater. Rep., 2016, 30, 104–108 Search PubMed.
- Q. Li, et al., Characterization of Low-Melting-Point Sn-Bi-In Lead-Free Solders, J. Electron. Mater., 2016, 45, 5800–5810 CrossRef CAS.
- F. Yang, et al., Research progress of Sn-Cu-Ni based electronic interconnection materials, Electron. Compon. Mater., 2016, 35, 1–6 Search PubMed.
- Y. F. Gao, et al., Electrochemical corrosion of Sn-0.75Cu solder joints in NaCl solution, T. Nonferr. Metal. Soc., 2012, 22, 977–982 CrossRef CAS.
- M. Ragab and M. A. Bedair, The effect of permanent magnet stirring on the corrosion resistance of Sn-2.0Ag-0.5Cu-2Zn solder alloys in NaCl solution, Mater. Chem. Phys., 2023, 302, 127774 CrossRef CAS.
- D. Jaiswal, S. Kumar and C. K. Behera, Electrochemical behavior of Sn-9Zn-xCu solder alloy in 3.5 wt% NaCl solution at room temperature, Mater. Today Commun., 2022, 33, 104627 CrossRef CAS.
- S. N. Alam, N. Jindal and N. Naithani, Effect of addition of Cu on the properties of eutectic Sn-Bi solder alloy, Mater. Sci.-Pol., 2019, 37, 212–224 CrossRef CAS.
- F. W. Zhang, et al., Sn-30Bi-0.5Cu Microorganization and mechanical properties of low temperature lead-free brder, Chin. J. of Nonferrous Met., 2009, 19, 1782–1788 CAS.
- H. A. Jaffery, et al., Electrochemical corrosion behavior of Sn-0.7Cu solder alloy with the addition of bismuth and iron, J. Alloys Compd., 2019, 810 Search PubMed.
- D. Qi, et al., Corrosion characteristics of Sn-20Bi-xCu-yIn solder in 3.5% NaCl solution, Nonferrous Met. Soc., 2023, 33, 1827–1838 CrossRef CAS.
- D. Jaiswal, et al., Electrochemical behaviour of lead-free Sn-0.7Cu-xIn solders alloys in 3.5 wt% NaCl solution, J. Mater. Sci.: Mater. Electron., 2021, 32, 23371–23384 CrossRef CAS.
- W. R. Osório, et al., Electrochemical behavior of a lead-free Sn-Cu solder alloy in NaCl solution, Corros. Sci., 2014, 80, 71–81 CrossRef.
- X. Y. Li, et al., Effects of the melt state on the microstructure of a Sn-3.5% Ag solder at different cooling rates, Appl. Surf. Sci., 2012, 258, 5677–5682 CrossRef CAS.
- H. Z. Huang, et al., Effects of sulfur addition on the wettability and corrosion resistance of Sn-0.7Cu lead-free solder, Microelectron. Reliab., 2017, 74, 15–22 CrossRef CAS.
- H. Wang, et al., Evaluation of cooling rate on electrochemical behavior of Sn–0.3Ag–0.9Zn solder alloy in 3.5 wt% NaCl solution, J. Mater. Sci.: Mater. Electron., 2015, 26, 11–22 CrossRef CAS.
- N. K. Liyana, et al., Effect of Zn incorporation on the electrochemical corrosion properties of SAC105 solder alloys, J. Mater. Sci.: Mater. Electron., 2019, 30, 7415–7422 CrossRef CAS.
- D. Jaiswal, et al., Electrochemical behaviour of lead-free Sn-In-Al solders alloys in 3.5 wt.% NaCl solution, Mater. Today: Proc., 2022, 57, 187–193 CAS.
- M. N. Wang, et al., Effects of microstructure and temperature on corrosion behavior of Sn-3.0Ag-0.5Cu lead-free solder, J. Mater. Sci., 2012, 23, 148–155 CAS.
- M. Liu, et al., The electrochemical corrosion behavior of Pb–free Sn–8.5Zn–XCr solders in 3.5 wt% NaCl solution, Mater. Chem. Phys., 2015, 168, 27–34 CrossRef CAS.
- Q. Q. Song, et al., The electrochemical corrosion behavior of Sn58Bi-XCr composite solder, Mater. Chem. Phys., 2023, 295, 126990 CrossRef CAS.
Footnote |
| † Shenggang Zhou and Yi Zhang contributed equally to this work. |
| This journal is © The Royal Society of Chemistry 2023 |

