 Open Access Article
Caught in the act: real-time observation of the solvent response that promotes excited-state proton transfer in pyranine†
Claudius
Hoberg
 a,
Justin J.
Talbot
 b,
James
Shee
 b,
Thorsten
Ockelmann
a,
Debasish
Das Mahanta
 a,
Fabio
Novelli
 a,
Martin
Head-Gordon
 bc and
Martina
Havenith
 *a
*a
aLehrstuhl für Physikalische Chemie II, Ruhr-Universität Bochum, 44780 Bochum, Germany. E-mail: martina.havenith@rub.de
bDepartment of Chemistry, University of California, Berkeley, California 94720, USA
cChemical Sciences Division, Lawrence Berkeley National Laboratory, Berkeley, California 94720, USA
First published on 16th March 2023
Abstract
Photo-induced excited-state proton transfer (ESPT) reactions are of central importance in many biological and chemical processes. Identifying mechanistic details of the solvent reorganizations that facilitate proton transfer however, is challenging for current experimental and theoretical approaches. Using optical pump THz probe (OPTP) spectroscopy and molecular dynamics simulations, we were able to elucidate the ultrafast changes in the solvation environment for three derivatives of pyranine: the photoacid HPTS, the methoxy derivative MPTS, and the photobase OPTS. Experimentally, we find damped oscillations in the THz signal at short times and our simulations enable their assignment to vibrational energy transfer beatings between the photoexcited chromophore and nearby solvent molecules. The simulations of HPTS reveal strikingly efficient sub-ps energy transfer into a particular solvent mode, that is active near 4 THz, and which can provide the requisite energy required for solvent reorganization promoting proton transfer. Similar oscillations are present in the THz signal for all three derivatives, however the signal is damped rapidly for HPTS (within 0.4 ps) and more slowly for MPTS (within 1.4 ps) and OPTS (within 2.0 ps). For HPTS, we also characterize an additional phonon-like propagation of the proton into the bulk with a 140 ps period and an 83 ps damping time. Thermalization of the solvent occurs on a time scale exceeding 120 ps.
1 Introduction
Due to the importance of photo-induced excited-state proton transfer (ESPT) reactions in many technological, chemical, and biological processes, numerous time-resolved studies have examined the mechanism of proton transfer from a photoacid into a bulk liquid such as water.1 In such environments, ESPT is one of the fastest reactions in chemistry occurring on a time scale of t < 150 fs, where it is believed to follow a three-step mechanism.2 In this proposed mechanism, the acid–base contact pair first needs to be formed followed by a subsequent rearrangement of the solvent environment enabling transfer of the proton from the photoacid into the bulk.2 The kinetics underlying this mechanism are ultimately controlled by reorganization of the photoacid's solvation environment which either promotes or obstructs the proton transfer event.3–8A prototypical model system of ESPT into bulk water is the photoacid 8-hydroxypyrene-1,3,6-trisulfonate (HPTS), also known as pyranine. HPTS is highly soluble in water, photostable, and has a quantum yield close to unity. Proton transfer occurs most readily in HPTS after optical excitation (λmax = 403 nm) as the pKa drops from 7.2 in the ground state to 0.4 in the excited state.9 Previous studies of aqueous HPTS have suggested that the initial stage of ESPT is controlled by a reversible, solvent-controlled dissociation inside the first solvent shell followed by diffusion of the proton into the bulk.10 Interestingly, it is the solvent's vibrational fluctuations and rearrangements that are proposed to play essential roles in forming the correct hydrogen bond configuration and polarization required to facilitate proton transfer.11 While the initial and final steps of the ESPT reaction can be detected from changes in the UV/VIS or IR spectrum of the photoacid or photobase,12 mechanistic details about the solvent rearrangements, as well as the representative time scales of the onset of protonation are still very much a matter of debate.13
The experimental consensus from fs–ps fluorescence and IR studies, which probe sensitive changes of the pyranine photoacid or conjugate base, propose three representative time constants for proton transfer.14 The shortest time constant reported is 0.3 ps or less while the longest time constant (80–100 ps) reflects a diffusion-assisted proton migration into the bulk. The intermediate process has a time constant of 2–3 ps, long enough for solvent rearrangement to be possible, and has been hypothesized to correspond to one the following: (a) the reorganization of the surrounding water molecules to form a water wire;15 (b) the transition involving a slow charge transfer process;16 (c) the formation of ion–contact pairs;14 or (d) the hydration of the proton “in flight” between the acid and the base.17 Despite the importance of a detailed understanding of ESPT in HPTS, unambiguous evidence for definitive assignments of the sub-ps and 2–3 ps time constants has yet to be provided.
In order to shed light on these elementary yet debated processes, we present new data in the low frequency range obtained by directly probing the solvent. Frequency-resolved optical-pump THz-probe (OPTP) spectra are presented, which identify time constants ranging from 0.4 to >120 ps with unprecedented resolution. In order to interpret the short-time constants, we have constructed an ab initio model of the vibrational energy transfer dynamics based on a local fragment partitioning. Comparisons are made with the methoxy derivative MPTS, which has an electronic structure similar to HPTS but does not undergo proton transfer, and the photobase OPTS. Spectroscopic oscillations on the picosecond timescale are observed, and our simulations suggest that they correspond to energy transfer beatings mediated by coupled vibrational modes between the chromophore and first-shell solvent molecules. We hypothesize that this subsequent solvent reorganization sets the stage for efficient proton transfer in HPTS. While the OPTP signal of all three chromophores exhibit oscillations that are eventually damped, the damping occurs much more quickly in HPTS (<0.5 ps) resulting in a biexponentially decaying signal.
We then proceed to characterize the longer timescales extracted from the OPTP fit. Complete energy transfer to the solvent manifests as a gradual thermalization with a time constant of 120 ps. This assignment is corroborated by electronic structure calculations, which reveal a correlation between the total decrease in the transmitted THz amplitude (or increase in absorption) and the calculated energy difference between the Franck–Condon region and the minimum on the excited-state potential energy surface. Furthermore, we find direct evidence of a phonon-like propagation through the bulk solvent with a time constant of ∼80 ps, consistent with the proton diffusion time previously assigned. Additionally, we identify the mechanistic details and the relevant time scales that facilitate the ESPT event in HPTS which was guided by the following questions:
(1) Does the short-time THz frequency response correspond to beating of the chromophore with the first hydration shell and when will a possible coherent motion be damped?
(2) If the first hydration shell dynamics are coherent, to what extent are the motions local rather than delocalized over the solvent network?
(3) What role do these low-frequency solvent reorganizations play in facilitating the proton transfer event in HPTS?
In an attempt to answer these questions, we present a combination of the experimental OPTP spectra with mechanistic insights from theory where we are able to resolve and interpret the various time scales of ESPT in HPTS from the sub-ps to >O(100)ps.
2 Methods
2.1 Experimental setup
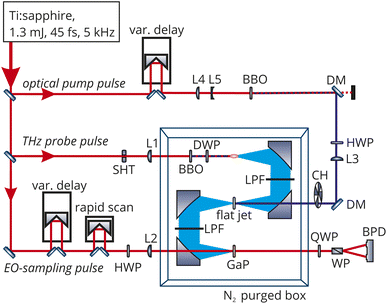
THz spectroscopy is a sensitive probe of changes in solvent structure and has been employed to elucidate mechanistic details about the solvation of the Eigen or Zundel complexes,18 ion hydration,19 and protonation.20 While the combination of THz spectroscopy with an optical pump has been extensively used for solid state samples, only very few studies have been performed on liquids. First in a study on betaine and p-nitroaniline in m-dichlorobenzene,21 the OPTP signal was described by a single exponentially growing bleach (6.9 ps) which the authors assigned to a bulk diffusive dielectric solvation time and an exponentially decaying oscillation with a period 8.3 ps and a decay of 2.0 ps. The signal was attributed to nuclear motions from librational modes localized near the solute. In aqueous solution, the only OPTP measurements recorded so far have been on deprotonated Coumarin 343 solvated in water where the signal was fit to a single exponential decay with a time constant of 10 ps.22 In order to improve upon this resolution, we have built an OPTP spectrometer with a time resolution of 90 fs and a sensitivity for measuring relative changes in electric field amplitude better than 5 × 10⁻⁵. This allows us to follow ultrafast solvent rearrangements in real time, even in the case of small changes.An overview of the optical setup is given in Fig. 1. An amplified Ti:Sapphire laser source (SolsticeAce, SpectraPhysics) was used, providing 45 fs pulses centered around 800 nm with an energy of 1.2 mJ per pulse at a repetition rate of 5 kHz. About 20% of the energy was used for the optical pump pulse. The pump pulse was frequency-doubled in a β-BBO crystal (thickness: 200 μm) yielding pulses centered at 400 nm. Another 75% of the pulse energy was used to generate the THz probe pulse. This pulse was focused through a 100 μm thick β-BBO crystal and a true zero-order dual-wavelength waveplate (0° at 400 nm, 90° at 800 nm) into air. At the focus, the fundamental and second harmonics produce an air-filament that emits THz radiation with a conical profile and linear polarization (see Fig. S13†). The process of THz emission from two-color filaments has been described in detail before.23–25
In the experiments reported here, we used two-color air-filamentation to generate short (190 fs full-width at half maximum), broadband THz probe pulses spanning 0.5–10 THz (17–334 cm−1) with an intensity maximum around 1–2 THz (33–67 cm−1). The pump-pulse energy was set to 10 μJ and the THz probe-pulse energy was measured to be 10 nJ (Ophir RM9-THz power meter). 90° off-axis parabolic mirrors in an 8f-geometry were used to collimate and focus the THz beam. The THz beam path was purged with nitrogen gas to reduce absorption by water vapor which allowed recording of the spectrum in the frequency range between 20–400 cm−1 (see Fig. S14†). A low-pass filter after the first and third parabolic mirror was used to clean the THz pulse from any residual optical radiation. The optical pump pulse and THz probe pulse were collinearly overlapped in a free-flowing, liquid flat-jet with a sheet thickness of about 100 μm (see Fig. S15 and S16†). This avoids any artifacts related to cuvette window materials and ensures a fresh sample for every laser pulse. Furthermore, it prohibits local heating effects due to the fast flow rate. All experiments were performed at 22 °C. The center of the flat-jet sheet was carefully positioned at the focus of the THz beam. The THz E-field was detected via electro-optic sampling in a double-layer 200 μm thick 〈110〉 gallium phosphide (GaP) crystal contacted with a 1 mm 〈100〉 GaP crystal, using either step-scanning or a rapid-scanning technique.26
The optical pump pulse was chopped, and the difference in the THz electric field amplitude between the pump-on and pump-off states was recorded at different pump delays. The instrument time resolution is 90 fs, as determined by recording the THz response upon optical excitation of electron–hole pairs in a high-resistivity silicon sample.26 The stability of the system enables long measurement times (typically 10 h). This setup is able to detect changes in the THz field amplitude smaller than 5 × 10⁻⁵ in liquid samples. As shown in Fig. S12,† no OPTP signal was observed in the case of a bulk water sample thus excluding systematic errors in the signal due to heating or ionization.
2.2 Molecular dynamics simulations
In order to simulate the time scales characteristic of the onset of proton transfer in these systems, an ab initio bilinearly-coupled harmonic oscillator model was developed that included all vibrational degrees of freedom (VDOF) between the chromophore and the solvent subsystems. The vibrational energy transfer was simulated by propagating classical molecular dynamics on the first-excited S1(ππ*) electronic state of each system assuming a second-order truncated potential energy surface | (1) |
The forces acting on each fragment-localized mode are obtained after applying Newton's equation of motion to the potential energy function shown in eqn (1). This is equivalent to solving the following set of second-order coupled differential equations
 | (2) |
![[H with combining tilde]](https://www.rsc.org/images/entities/i_char_0048_0303.gif) denotes the Hessian matrix now expressed in the local fragment basis and Qj is a normal mode VDOF. Since the Hessian matrix is symmetric, the solution to eqn (2) can be obtained by diagonalization
denotes the Hessian matrix now expressed in the local fragment basis and Qj is a normal mode VDOF. Since the Hessian matrix is symmetric, the solution to eqn (2) can be obtained by diagonalization | (3) |
 | (4) |
The time dependence of the fragment-localized chromophore and solvent modes, can be expressed as a linear combination of the normal modes
 | (5a) |
 | (5b) |
Evaluating the potential energy function in eqn (1) requires ground and first-excited state geometry optimizations and Hessian calculations on each of the three chromophore-water models: HPTS, MPTS, and OPTS. Following Walker et al.,3 a picosolvent was constructed from eight explicit water molecules in each system and the optimizations were initialized with the water molecules near the unique functional groups. Bulk water effects were implicitly included in the simulations via a polarizable continuum model (PCM) with a dielectric constant of 78.39, dramatically reducing the isomer configuration space as compared to explicit bulk solvent. Eight water molecules were chosen for a picosolvent surrounding the chromophores which is, of course, a crude approximation to a full hydration shell embedding. Such a small picosolvent was chosen as a drastically simplified model since this was both computationally feasible and intuitively the first hydration shell should interact strongest with the hydrophilic sulfonate, O− and O–H groups. Additionally, this model was tested by expanding the picosolvent to twelve water molecules which resulted in vibrational couplings similar to the eight-water cluster albeit with an artificial distortion of the planar structure (see ESI Section 5†). Kohn–Sham density functional theory (DFT) was used for geometry optimizations and ground-state (S0) calculations. Linear-response, time-dependent DFT within the adiabatic approximation (TDDFT) was employed to model the first-excited singlet states (S1, ππ*). The B3LYP/def2-SV(P) level of theory was used for all calculations as this model resulted in calculated vertical excitation and emission energies that are in good agreement with the experimental absorption and fluorescence energies (ESI Section 2†). All electronic structure calculations were performed with the Q-Chem software package.27
For all three chromophore-water models, two molecular dynamics simulations were performed to identify the representative time scales for hydrogen-bond rearrangements and to identify specific fragment-localized modes that are most active during the vibrational energy transfer. The first simulation involved initializing positions and momenta directly from a harmonic oscillator Wigner distribution on the ground electronic state potential energy surface at 298 K. After projecting the Wigner sampled positions and momenta onto Qj, 100 trajectories were allowed to propagate via the equations of motion provided in eqn (5) with a 4.84 fs time step for 300 ps. The underlying frequencies were calculated after time averaging the resultant trajectories and computing the Fourier transform of the position autocorrelation functions. The second simulation involved initializing the position of single fragment-localized modes on each of the three chromophores. Only fragment-localized modes with a harmonic frequency less than 6 THz were initialized which resulted in ≈20 of the lowest-frequency modes being included in each system (ESI Section 4†). The initialization was accomplished by setting the real component of Cchr,A = 1 and the imaginary component of Cchr,A = 0. The single trajectories, one for each mode, were then propagated viaeqn (5) with the same 4.84 fs time step for 300 ps. All molecular dynamics simulations used in-house code outside of Q-Chem with the Fourier transforms performed using Matlab.
3 Results
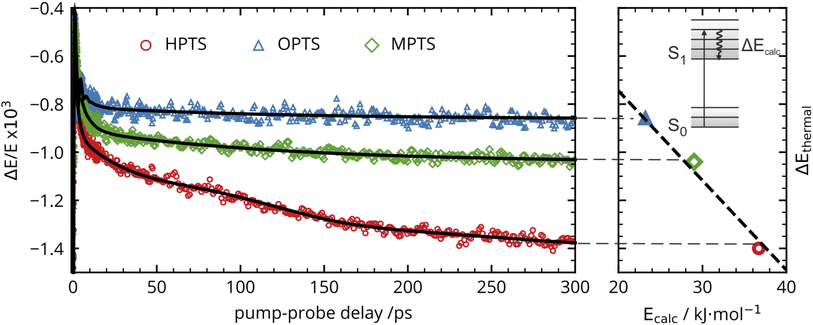
The OPTP traces of HPTS, OPTS, and MPTS are shown in Fig. 2 where each chromophore was solvated in a 20 mM aqueous solution. The change in peak amplitude of the transmitted THz electric field (ΔE) as a function of pump-probe delay time (t) is shown after normalization to the signal at t = 0 ps (denoted as ΔE/E in the figure). Since the time scales for nuclear rearrangement of the photoacid or solvent shell are appreciably longer, the instantaneous change in the OPTP transient (<0.1 ps) ΔE/E can be directly attributed to an electronic response after photoexcitaiton. The instantaneous signal (<0.2 ps) was analyzed, as well as the long-lasting response which, as expected, scales linearly with the pump fluence. In all three systems, we observed a long lasting (t > 300 ps) decrease in ΔE/E, however the normalized value of the transmitted THz field amplitude at 300 ps, ΔEthermal, is solute specific.The change in THz field amplitude at 300 ps was found to be linearly correlated with the Stokes shifts calculated with TDDFT which corresponds to vibrational relaxation from the S0 Franck–Condon geometry after vertical excitation to the S1(ππ*) electronic state, as shown in the right panel of Fig. 2. The calculated values, denoted as Ecalc, are 22.8, 29.2, and 36.6 kJ mol−1 for OPTS, MPTS, and HPTS, respectively. The details of these calculations along with the changes in electron density upon photoexcitation are provided in the ESI.† The frequency-resolved spectrum recorded at 300 ps resembles the spectrum of liquid water that is heated by ca. 0.6 °C.† Thus, the normalized change in the transmitted electric field strength ΔEthermal is indicative of a long-timescale thermalization process since it is linearly correlated with the energy transmitted to the solvent.
There are notable differences in the OPTP traces of HPTS, MPTS, and OPTS that are evident within the first 15 ps of the experiment as shown in Fig. 3. Surprisingly, in addition to the expected long-time relaxation response, an initial oscillation is observed for MPTS and OPTS (see Fig. 3(b) and (c)) which resembles the amplitude variation of a damped harmonic oscillator, and has not been reported before when probing the time-resolved spectrum of the photoacid itself. To investigate the origin of this oscillation further, the time constants from the OPTP traces were extracted after fitting the short-time signals to the following function
 | (6) |
SE1(t) + SE2(t) = a1![[thin space (1/6-em)]](https://www.rsc.org/images/entities/char_2009.gif) e−t/τ1 + a2 e−t/τ1 + a2![[thin space (1/6-em)]](https://www.rsc.org/images/entities/char_2009.gif) e−t/τ2 + ΔEthermal e−t/τ2 + ΔEthermal | (7) |
 | (8) |
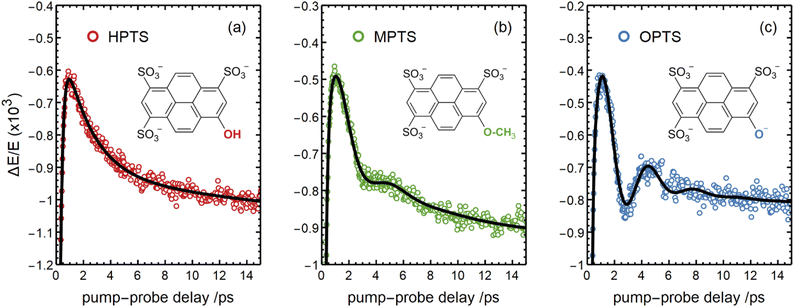 | ||
| Fig. 3 The OPTP signals shown in Fig. 2 at pump-probe delay times between 0 ps and 15 ps. The data were obtained from aqueous solutions of (a) HPTS, (b) MPTS, and (c) OPTS. The structures of each chromophore are shown in the inset of each panel. | ||
Select fit parameters are summarized in Table 1 with further details of the fit, including a full list of fit parameters, provided in the ESI.† The long-time response is well described by two exponential relaxation processes with time constants τ1 = 5.4 ps, which is present only for MPTS and OPTS, and τ2 = 120 ps which is present for all three chromophores. The time constant of 5.4 ps is the same order of magnitude as the 10 ps response for coumarin and the time constant τD = 8.2 ps reported by Ahmed et al.22 Thus, we attribute this relaxation to a macroscopic dipole relaxation of water molecules beyond the first shell. In HPTS, the proton transfer opens up other relaxation channels which are more efficient at obscuring the Debye relaxation. The second time scale of τ2 = 120 ps represents the irreversible energy transfer into the bulk solvent, i.e. the time scale of thermalization. Since this process is diffusion limited, τ2 is the same for HPTS, MPTS, and OPTS. When HPTS is solvated in D2O however, τ2 is increased from 120 ps to 150 ps.† The kinetic isotope effect (KIE 150/120 = 1.17) is comparable to an energy transfer either via Debye relaxation (KIE: 1.25) or diffusion where the isotope ratio of the self-diffusion coefficients is 1.22.
| ω 0/ps−1 | T/ps | 1/δ/ps | ΔEthermal × 103 | ESPT | |
|---|---|---|---|---|---|
| HPTS | 1.52 | 4.1 | 0.38 | −1.47 | ✓ |
| MPTS | 1.58 | 4.0 | 1.4 | −1.04 | ✗ |
| OPTS | 1.91 | 3.3 | 2.0 | −0.85 | ✗ |
For the short-time response, the fitted undamped vibrational periods are remarkably similar across all three chromophores (T = 4.1 ps for HPTS, T = 4.0 ps for MPTS, and T = 3.3 ps for OPTS). The similarity of periods and the corresponding undamped angular frequencies (ω0) for HPTS, MPTS, and OPTS suggests that the underlying oscillations result from related pathways of vibrational energy transfer after photoexcitation of the chromophore. The damping time (1/δ), however, is much smaller in HPTS (0.4 ps) as compared to those of both MPTS and OPTS, and results in an overdamped oscillation (δ > ω0).
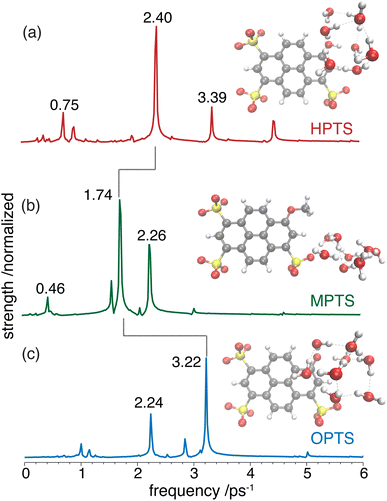
To interpret the various time constants fit from the experimental OPTP signal, we performed molecular dynamics simulations using a relatively simple, yet ab initio, model of vibrational energy transfer between the chromophore and the explicit solvent network. The time-dependent populations were computed as the norm over each fragment's complex coefficients
 | (9a) |
 | (9b) |
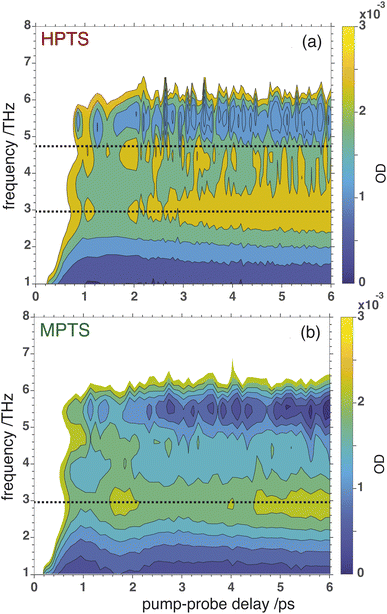
OPTP spectroscopy is sensitive to changes in the frequency range between 1–7 THz. In bulk liquid water the most pronounced spectral feature is reported at ≈6 THz which corresponds to low-frequency, hindered translational VDOF that makes and breaks the hydrogen-bond network.28 In bulk water, a local or first hydration shell response is centered in the frequency range between 150–200 cm−1 (5–7 THz), whereas a concerted mode involving the first and second hydration shells is probed around 80 cm−1 (≈3 THz). In order to assign the oscillations observed here to specific solvent rearrangements, time-domain traces (in the window: from −0.75 ps to +0.75 ps, in steps of 20 fs) were recorded for HPTS and MPTS which yielded time-resolved spectra via Fourier transformation. The pump and probe time delays were shifted such that the arrival time of the pump-pulse remains the same for each point in the time-domain.29 The optical densities (OD) in the time frame from 1 to 6 ps are shown in Fig. 5. For HPTS, there are two maxima in this window (the dashed lines at 4.8 and 3 THz) while for MPTS we observe a fairly broad peak centered around 3 THz (see ESI Fig. S22†). The time-resolved spectroscopic signatures observed here are red-shifted when compared with liquid water which is also observed for other solutes and is due to a perturbation of the solvent's internal hydrogen-bond environment.30 In previous studies on equilibrated solvated ions we have dissected the THz spectrum. In those studies, we concluded that in the frequency range between 1.5 and 7 THz the dominant contribution to the signal stems from the autocorrelation part, including the self term of the ion and its cross-correlations with water molecules in the first and second shell, respectively.31
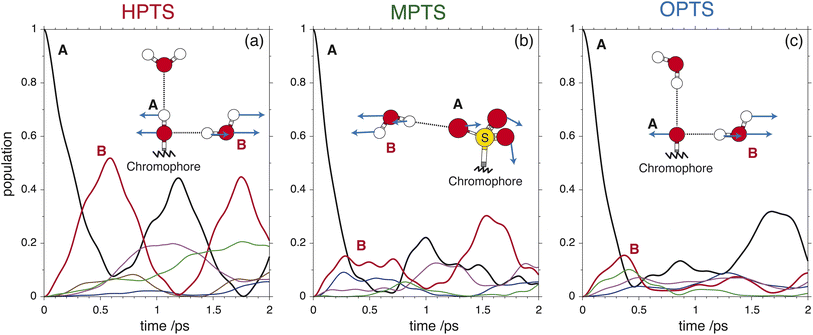
To glean physical insights into how the electronic structure of the chromophore may perturb the solvent's hydrogen-bond environment, simulations were performed where single fragment-localized modes were initialized and the dynamics were monitored as vibrational energy flowed back and forth between the chromophore and the picosolvent cages. The resultant population dynamics were analyzed (see ESI Section 4†) and specific modes were selected that displayed significant population transfer indicating strong coupling between the chromophore and water subsystem. The population dynamics of these selected modes are shown in Fig. 6. The populations shown are representative of the beating of vibrational energy transfer that oscillates between the chromophore and the solvent subsystems. In a more advanced treatment where additional atomistic solvent shells would be included, the vibrational energy transfer could further permeate throughout the water network where it is suspected that these beating oscillations would be damped just as observed in the experimental OPTP signals.
In HPTS (see Fig. 6(a)), the population of the selected chromophore mode decays rapidly with nearly 90% transferring before 1 ps. The chromophore mode is an out-of-plane symmetric skeletal bend where the O–H bending motion makes and breaks the in-plane hydrogen bond with the solvent. In the sub 1 ps time frame the vibrational energy is primarily transferred to a single solvent mode which incurs nearly 50% of the population before beating. This solvent mode corresponds primarily to a side-on modulation of the hydrogen bond equatorial to the O–H group on the chromophore. In MPTS (see Fig. 6(b)), the activated chromophore mode corresponds to an out-of-plane symmetric skeletal bend with an internal rotation of the SO3 group nearest to the methyl terminal. The population transfer is even more rapid when compared with HPTS with nearly 90% transferring before 0.5 ps, however, the solvent response is far more dispersed in MPTS with no single mode incurring more than ≈20% of the population before beating. In MPTS, the solvent mode with the most population corresponds to a hydrogen bond breaking between an exterior water in the picosolvent and an oxygen on the SO3 group. The energy transfer from the solute skeletal mode into the first hydration shell is more indirect when compared with HPTS. A similar time scale for relaxation was observed in the Raman spectrum by Fang et al.32 Finally, the activated mode that couples strongest in OPTS (see Fig. 6(c)) is very similar in structure to the active mode in HPTS, i.e. an out-of-plane symmetric skeletal and oxygen terminal bend. The population of this mode in OPTS decays much more rapidly than HPTS in comparison with nearly 90% of the population transferring before only 0.5 ps. The solvent response however, is far more dispersed with no single solvent mode gaining more than 20% population. The most active solvent mode (≈20% by 0.5 ps) corresponds to an equatorial hydrogen-bond breaking with the oxygen functional group which moves in a similar fashion to the identified solvent mode in HPTS. As will be argued, the relatively efficient and more complete sub-ps energy transfer from solute to solvent vibrational modes in HPTS can enable the requisite solvent rearrangements which prime the system for rapid proton transfer, consistent with the more rapid damping of the THz signal.
4 Discussion
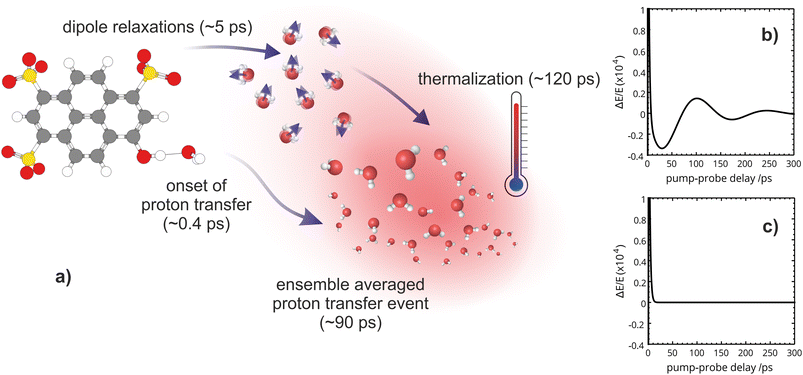
Our OPTP experiments are able to directly monitor the solvent response to photoexcitation in real-time, from 0.2 to 300 ps. Combining our experimental and theoretical results, we now propose a detailed molecular mechanism of aqueous excited state proton transfer in HPTS, summarized in Fig. 7.A fast initial response, with a time constant of <0.2 ps, arises from the near-instantaneous redistribution of electron density upon photoexcitation. This is observed for all three chromophores – the photoacid HPTS along with the methylated and photobase derivatives. Corresponding attachment and detachment electron density plots are shown in the ESI.†
While our molecular dynamics simulations do not directly elucidate the ESPT event, we have obtained unprecedented insight into the ultrafast vibrational energy exchange which is believed to govern the kinetics of ESPT. In particular, Walker et al. proposed that the degree of solvent rearrangement required to form an optimally oriented water wire determines the timescale of rattling or delocalization of the proton in ESPT, which can range from 100 fs to 3 ps depending on the initial solvent configuration.3 Our ab initio vibrational dynamics simulations predict that photoexcited HPTS could undergo fairly efficient population transfer, in 0.6–0.7 ps, from a chromophore to a solvent mode involving waters in the immediate vicinity of the OH group provided sufficient energy is funneled into that VDOF. We hypothesize that this influx of energy into the solvent enables its reorganization to a water-wire-like configuration (which very well might be characterized by the 2–3 ps time constant previously reported in the literature) which primes the system for one-way energy transfer through ESPT. Such a process is likely responsible for the observed sub-ps damping of the short-time OPTP signal oscillations in HPTS.
From the OPTP signal fit, we have extracted a Debye relaxation time constant (τ1) of 5.4 ps which we attribute to dipole relaxations of water molecules beyond the first solvent shell. Furthermore, we suggest that the 120 ps exponential relaxation shown in the OPTP data can be attributed to thermalization of the bulk solvent which is consistent with static electronic structure calculations. Beyond 100 ps, the THz probe effectively acts as a “THz thermometer” and is a quantitative measure of the energy released by relaxation from the Franck–Condon region along the first-excited potential energy surface (ESI Section 6†). This is confirmed by the frequency resolved OPTP spectrum recorded at 300 ps, see Fig. S9,† which almost resembles an equilibrated solvent spectrum with a temperature increase of 0.6 °C.
When tracking the solvent response of HPTS for 150 ps via OPTP, an additional oscillatory behavior is observed where the long-time OPTP amplitude after subtraction of the dominant exponential decrease in signal due to thermalization is shown. In HPTS, the signal displays small, yet reproducible deviations from an exponential decay. These oscillations can be better described after including a second damped harmonic oscillation SDH2 with a vibrational period, T2 = 140 ps and a damping constant, δ2 = 0.012 ps−1, which corresponds to a time constant of 1/δ2 ≈ 83 ps, into the fitting function shown in eqn (6). Interestingly, for MPTS and OPTS, thermalization alone is sufficient to describe the long-time response (see ESI Section 7 and 9†).
Within the first ps of the experiment, the OPTP laser probes exclusively the response of the photoacid to the first solvent shell. In contrast and over longer time scales (10–100 ps), the proton can migrate to the second shell and diffuse finally into the bulk. While in the first 5 ps, an oscillation is prominent with a period of T = 4 ps, the long-term oscillation period (T = 140 ps) is a factor of 35 larger. This may be rationalized as follows: assuming a simplified model of a spherical non-polarizable solute molecule solvated in a solvent with a single Debye relaxation process which is described by a continuum model, the following relation between the longitudinal relaxation time, τs, for reorientation of an electric field of a created dipole on short time scales, and the Debye relaxation time of the fully solvated dipole, in a spherical cavity, τD holds33
 | (10) |
5 Conclusions
In summary, the solvent response of HPTS and two derivatives after photoexcitation has been uncovered over a range of timescales, from sub-ps to 300 ps, via a combination of OPTP spectroscopy, molecular dynamics simulations, and electronic structure calculations. The rather surprising observation of an oscillation in the experimental OPTP signal has been assigned, with the help of a simple theoretical model, to vibrational beatings which, when undamped, correspond to energy transfer between the photoexcited chromophore and the water solvent. Through a comparison of the Fourier transformed OPTP traces and the simulated population dynamics, fragment-localized modes were identified that make and break hydrogen bonds between the chromophore and solvent subsystems which mediates vibrational energy transfer. The time scales for this vibrational energy transfer in HPTS are in line with the theoretical studies examining the main nuclear relaxation that is reported to occur within 0.5 ps.36 Compared to MPTS and OPTS, efficient coupling between solute and solvent VDOF, as seen in HPTS, increases the rate of vibrational energy transfer by a factor of 4–5 as observed by the increased damping time. Remarkably, the damped oscillations in HPTS suggest that efficient energy transfer stops the oscillatory mode within the first cycle; whereas for MPTS we observe an oscillation up to 4 ps.While admittedly the theoretical model presented here doesn't fully elucidate the proton transfer event, we propose that the onset of protonation is triggered by rapid solvent reorganization driven by the population of a VDOF that makes and breaks the intermolecular hydrogen bond network. Thus, the experimentally measured short-time frequency response could arise from a vibrational energy transfer beating between the chromophore and first hydration shell. To support this, the undamped angular frequencies (ω0, reported in Table 1) that were fit to the transient OPTP traces are similar to the frequencies extracted from our simple ab initio model of vibrational energy transfer. The results presented here suggest that, at least in the short time dynamics, vibrational energy transfer is localized on the hydrophilic groups and the first hydration shell as probed in the response around 5 THz. Since the influx of vibrational energy is localized, it could be used to prime the solvent (through further nuclear rearrangements) for the proton transfer event. Until now experiments have not had sufficient resolution to probe the ultrafast solvent rearrangements that facilitate such a process. At longer time scales, the major contribution stems from the THz mode centered around 3 THz (ascribed to a correlated mode) and finally approaches a thermally equilibrated sample at 300 ps.
The results presented here demonstrate the exceptional sensitivity which can be reached with OPTP, which enables monitoring in detail the solvent response and the propagation of vibrational energy from a photoexcited intermediate into a bulk solvent. In combination with simulations designed to predict the mechanistic details of vibrational energy transfer, these techniques go beyond the solute perspective and map the effect of the reaction on the surrounding solvent to reveal details that were partly or even fully hidden when focusing solely on observables tagged to the photoacid or its conjugate base.
Data availability
All computational and experimental data have been provided in the main text and the ESI.†Author contributions
C. H., M. H., J. J. T., J. S., and M. H.-G. conceived of the project. The OPTP measurements and data collection was performed by C. H., T. O., and D. D. M. with F. N. providing helpful discussions. C. H. and T. O. performed the experimental data analysis. The molecular dynamics modeling and simulations were conceived by J. J. T., J. S., and M. H.-G. The initial manuscript was written by C. H., M. H., J. J. T., J. S., and M. H.-G. and all authors participated in reviewing and editing. M. H. and M. H.-G. were responsible for funding acquisition.Conflicts of interest
There are no conflicts to declare.Acknowledgements
The authors thank P. Nürnberger, G. Schwaab, A. Walker, and R. Glaves for helpful discussions. M. H. received financial support from the Cluster of Excellence RESOLV (EXC 2033-390677874) funded by the Deutsche Forschungsgemeinschaft (DFG, German Research Foundation) and by the ERC Advanced Grant 695437 (THz Calorimetry). T. O. was supported by the Research Training Group “Confinement-controlled Chemistry” under Grant GRK 2376-331085229 from the DFG. J. J. T. J. S. and M. HG were supported by the Director, Office of Science, Office of Basic Energy Sciences of the US Department of Energy under contract no. DE-AC02-05CH11231, and acknowledge additional support from CALSOLV. J. S. acknowledges funding from the National Institute of General Medical Sciences of the National Institutes of Health under award number F32GM142231. This research used computational resources of the National Energy Research Scientific Computing Center, a DOE Office of Science User Facility supported by the Office of Science of the U.S. Department of Energy under Contract No. DE-AC02-05CH11231. We thank P. Balzerowski for his contributions to the set-up of OPTP.References
- E. Pines, D. Huppert and N. Agmon, J. Chem. Phys., 1988, 88, 5620–5630 CrossRef CAS.
- M. Rini, B.-Z. Magnes, E. Pines and E. T. Nibbering, Science, 2003, 301, 349–352 CrossRef CAS PubMed.
- A. R. Walker, B. Wu, J. Meisner, M. D. Fayer and T. J. Martínez, J. Phys. Chem. B, 2021, 125, 12539–12551 CrossRef CAS PubMed.
- H. Ishikita and K. Saito, J. R. Soc., Interface, 2014, 11, 20130518 CrossRef PubMed.
- T. J. Day, U. W. Schmitt and G. A. Voth, J. Am. Chem. Soc., 2000, 122, 12027–12028 CrossRef CAS.
- C. T. Wolke, J. A. Fournier, L. C. Dzugan, M. R. Fagiani, T. T. Odbadrakh, H. Knorke, K. D. Jordan, A. B. McCoy, K. R. Asmis and M. A. Johnson, Science, 2016, 354, 1131–1135 CrossRef CAS PubMed.
- J. D. Herr, J. Talbot and R. P. Steele, J. Phys. Chem. A, 2015, 119, 752–766 CrossRef CAS PubMed.
- U. Raucci, M. G. Chiariello and N. Rega, J. Chem. Theory Comput., 2020, 16, 7033–7043 CrossRef CAS PubMed.
- K. Smith, K. Kaufmann, D. Huppert and M. Gutman, Chem. Phys. Lett., 1979, 64, 522–527 CrossRef CAS.
- J. Pérez-Lustres, F. Rodriguez-Prieto, M. Mosquera, T. Senyushkina, N. Ernsting and S. Kovalenko, J. Am. Chem. Soc., 2007, 129, 5408–5418 CrossRef PubMed.
- R. Simkovitch, S. Shomer, R. Gepshtein and D. Huppert, J. Phys. Chem. B, 2015, 119, 2253–2262 CrossRef CAS PubMed.
- O. F. Mohammed, J. Dreyer, B.-Z. Magnes, E. Pines and E. T. J. Nibbering, ChemPhysChem, 2005, 6, 625–636 CrossRef CAS PubMed.
- T. Kumpulainen, B. Lang, A. Rosspeintner and E. Vauthey, Chem. Rev., 2017, 117, 10826–10939 CrossRef CAS PubMed.
- P. Leiderman, L. Genosar and D. Huppert, J. Phys. Chem. A, 2005, 109, 5965–5977 CrossRef CAS PubMed.
- B. J. Siwick and H. J. Bakker, J. Am. Chem. Soc., 2007, 129, 13412–13420 CrossRef CAS PubMed.
- N. Agmon, J. Phys. Chem. A, 2005, 109, 13–35 CrossRef CAS PubMed.
- W. Liu, Y. Wang, L. Tang, B. G. Oscar, L. Zhu and C. Fang, Chem. Sci., 2016, 7, 5484–5494 RSC.
- D. Decka, G. Schwaab and M. Havenith, Phys. Chem. Chem. Phys., 2015, 17, 11898–11907 RSC.
- G. Schwaab, F. Sebastiani and M. Havenith, Angew. Chem., Int. Ed., 2019, 58, 3000–3013 CrossRef CAS PubMed.
- F. Sebastiani, C. Y. Ma, S. Funke, A. Bäumer, D. Decka, C. Hoberg, A. Esser, H. Forbert, G. Schwaab and D. Marx, et al. , Angew. Chem., Int. Ed., 2021, 60, 3768–3772 CrossRef CAS PubMed.
- R. McElroy and K. Wynne, Phys. Rev. Lett., 1997, 79, 3078 CrossRef CAS.
- S. Ahmed, A. Pasti, R. J. Fernández-Terán, G. Ciardi, A. Shalit and P. Hamm, J. Chem. Phys., 2018, 148, 234505 CrossRef PubMed.
- D. J. Cook and R. M. Hochstrasser, Opt. Lett., 2000, 25, 1210 CrossRef CAS PubMed.
- X. Xie, J. Dai and X. C. Zhang, Phys. Rev. Lett., 2006, 96, 1–4 Search PubMed.
- T. Bartel, P. Gaal, K. Reimann, M. Woerner and T. Elsaesser, Opt. Lett., 2005, 30, 2805 CrossRef CAS PubMed.
- C. Hoberg, P. Balzerowski and M. Havenith, AIP Adv., 2019, 9, 035348 CrossRef CAS PubMed.
- E. Epifanovsky, A. T. Gilbert, X. Feng, J. Lee, Y. Mao, N. Mardirossian, P. Pokhilko, A. F. White, M. P. Coons and A. L. Dempwolff, et al. , J. Chem. Phys., 2021, 155, 084801 CrossRef CAS PubMed.
- M. Heyden, J. Sun, S. Funkner, G. Mathias, H. Forbert, M. Havenith and D. Marx, Proc. Natl. Acad. Sci. U. S. A., 2010, 107, 12068–12073 CrossRef CAS PubMed.
- M. C. Beard, G. M. Turner and C. A. Schmuttenmaer, Phys. Rev. B: Condens. Matter Mater. Phys., 2000, 62, 15764 CrossRef CAS.
- S. Pezzotti, F. Sebastiani, E. P. van Dam, S. Ramos, V. Conti Nibali, G. Schwaab and M. Havenith, Angew. Chem., Int. Ed., 2022, 61, e202203893 CrossRef CAS PubMed.
- P. Schienbein, G. Schwaab, H. Forbert, M. Havenith and D. Marx, J. Phys. Chem. Lett., 2017, 8, 2373–2380 CrossRef CAS PubMed.
- T. D. Krueger, S. A. Boulanger, L. Zhu, L. Tang and C. Fang, Struct. Dyn., 2020, 7, 024901 CrossRef CAS PubMed.
- B. Bagchi and B. Jana, Chem. Soc. Rev., 2010, 39, 1936–1954 RSC.
- T.-H. Tran-Thi, T. Gustavsson, C. Prayer, S. Pommeret and J. T. Hynes, Chem. Phys. Lett., 2000, 329, 421–430 CrossRef CAS.
- G. Donati, A. Petrone, P. Caruso and N. Rega, Chem. Sci., 2018, 9, 1126–1135 RSC.
- M. G. Chiariello and N. Rega, J. Phys. Chem. A, 2018, 122, 2884–2893 CrossRef CAS PubMed.
Footnote |
| † Electronic supplementary information (ESI) available. See DOI: https://doi.org/10.1039/d2sc07126f |
| This journal is © The Royal Society of Chemistry 2023 |

