 Open Access Article
Creative Commons Attribution 3.0 Unported Licence
Manifestation of the interplay between spin–orbit and Jahn–Teller effects in Au25 superatom UV-Vis fingerprint spectra†
Can
Liao
a,
Manzhou
Zhu
 *b,
De-en
Jiang
 *c and
Xiaosong
Li
 *a
*a
aDepartment of Chemistry, University of Washington, Seattle, WA 98195, USA. E-mail: xsli@uw.edu
bDepartment of Chemistry and Center for Atomic Engineering of Advanced Materials, Anhui University, China. E-mail: zmz@ahu.edu.cn
cDepartment of Chemical and Biomolecular Engineering, Vanderbilt University, Nashville, TN 37235, USA. E-mail: de-en.jiang@vanderbilt.edu
First published on 11th April 2023
Abstract
Atomically precise nanoclusters play an important role in nanoscale catalysis, photonics, and quantum information science. Their nanochemical properties arise from their unique superatomic electronic structures. As the flagship of atomically precise nanochemistry, the Au25(SR)18 nanocluster exhibits tunable spectroscopic signatures that are sensitive to the oxidation state. This work aims to unravel the physical underpinnings of the spectral progression of Au25(SR)18 nanocluster using variational relativistic time-dependent density functional theory. The investigation will focus on the effects of superatomic spin–orbit coupling, its interplay with Jahn–Teller distortion, and their manifestations in the absorption spectra of Au25(SR)18 nanoclusters of different oxidation states.
The Au25(SR)18 nanocluster is the flagship of atomically precise nanochemistry.1 Over one thousand papers have been published about it and its derivatives since its identification in 2005 (ref. 2) and structure determination in 2008.1,3–7 However, the influence of spin–orbit coupling (SOC) over different oxidation states of the Au25(SR)18 nanocluster has not been fully understood, despite it being the most studied cluster in the field and recent attempts.8–11 SOC plays an important role in the electronic structure and properties of molecules and materials, especially for heavier elements such as Au. The inclusion of SOC in ab initio calculations of ground and excited state nanomaterials has not been routinely pursued due to the high computational cost. This challenge has prevented a full understanding of some of the most studied nanosystems.
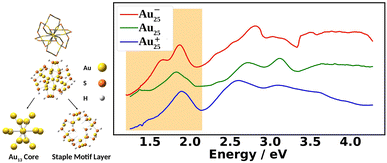
Fig. 1 shows the experimental UV-Vis absorption spectra of Au25(SR)18 nanoclusters (abbreviated as Au25) at three different oxidation states. The differences among them can clearly be seen. The low energy region from 1.2 eV to 2.0 eV, known as the fingerprint band, corresponds mainly to the transitions between frontier orbitals: the double peak in Au25− changes to an asymmetric band in neutral Au25 with further blue-shifts in Au25+.12–15 The frontier orbitals of Au25 can be well-understood in the absence of SOC by the superatomic complex model:16 Au25− being an 8-electron system with a superatomic electron configuration of (1S)2(1P)6, with 1D orbitals being the LUMO. Although the double peaks of Au25− were explained by the SOC splitting of the 1P orbitals based on two-component time-dependent density functional theory (2C-TDDFT),8 the role of SOC in the neutral and cationic spectra remains unexplored.
Another consideration is the interplay between geometry and electronic structure as a result of SOC. Jahn–Teller distortion plays a crucial role in the electronic structure of metal nanoclusters including ligand-protected metal clusters.15,17,18 It is well-known that filling degenerate or near-degenerate orbitals with unpaired electrons is met by geometric distortions that lower the nanocluster symmetry and break orbital degeneracies. Metal nanoclusters tend to not follow Hund's rule since the energy lowered by Jahn–Teller distortion can be greater than that by Hund's spin–spin coupling. This perspective is paramount to understanding the evolution of the UV-Vis fingerprint band with respect to charge. As the nanocluster oxidizes from anionic (−1) to neutral (0) and cationic (+1) oxidation states, the superatomic orbital electron configuration changes from 1P6 to 1P5 and 1P4, respectively, presenting a clear opportunity for Jahn–Teller distortion to act. Indeed, the Jahn–Teller effects have been shown to be present in Au25 which can be further manipulated to tune its redox properties.15,19
The goal of the present work is, therefore, to fully understand the role of SOC in the fingerprint absorption band at 1.2 eV to 2.0 eV for the −1, 0, and +1 oxidation states of the Au25(SR)18 nanocluster and to correlate the SOC-induced electron structure modulation with Jahn–Teller distortion. Au25(SH)18 was used as a model in the study to reduce computational cost since it has been shown that optical properties in this energy region are insensitive to ligand choice.12,20,21 All calculations were performed using a developmental version of the Gaussian electronic structure package.22 Two-component time-dependent density functional theory calculations were performed using the PBE0,23,24 functional with the relativistic CRENBL25–29 effective core potential (ECP) including SOC and its complementary basis set for Au and S atoms. See ESI† for more details.
Fig. 2 compares the simulated spectra with the experiment for the three different oxidation states of Au25. The low energy satellite peak at 1.64 eV was labeled as α1 and the main peak at 1.91 eV was labeled as α2 in Fig. 2a for the anionic cluster. Upon oxidation of the anion to the neutral nanocluster, the satellite peak lowered in intensity and was red-shifted to 1.43 eV, labeled as β1 in Fig. 2b. Broadening of the main peak was observed along with a slight red-shift to 1.82 eV, labeled as β3 in Fig. 2b. β3 exhibited a low energy tail with significant intensity at 1.58 eV that connects β1 and β3, labeled as β2 in Fig. 2b. β3 also exhibited a high energy shoulder, labeled β4. Further oxidation to the cationic state resulted in the disappearance of the low energy satellite peak along with a blue-shift of the main peak to 1.89 eV, labeled γ2. The low-energy tail remains at 1.70 eV and is labeled γ1. The high energy shoulder of the main peak is no longer present in the experimental spectrum, but remains in the simulated spectrum. Overall, one can see an excellent agreement between the simulations and the experimental spectra for the three different charge states.
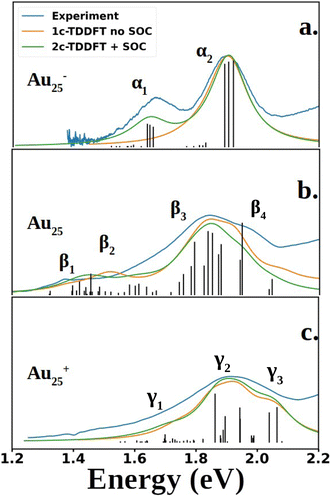 | ||
| Fig. 2 Experimental and computed spectra of Au25(SR)18. The excited states obtained from 2C-TDDFT are plotted as black lines. Spectra were generated by applying Lorentzian broadening to the excited states with a half-width at half max of 0.07 eV. The anion spectrum (a) is compared to the experimental spectrum of Au25(C6H13)18− (SCH6H13: 1-hexanethiolate), reproduced from data obtained from Ramakrishna et al.30 The neutral (b) and cation (c) spectra are compared to experimental spectra of Au25(SPET)18 and Au25(SPET)18+ respectively. All spectra were recorded at 78 K. The computed neutral spectrum was red-shifted by 0.11 eV to align with the experimental spectrum. | ||
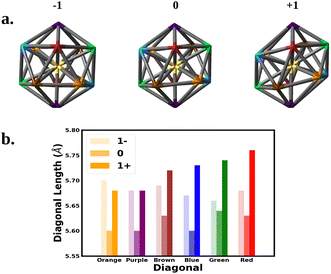
We next correlate the change in the optical absorption spectra to the change in the geometry of the Au25 nanocluster as the charge is varied, with a focus on SOC electronic structure. We note that Jahn–Teller distortion in Au25 nanoclusters has been correlated to experimental optical absorption and voltammograms.15,18,31Fig. 3 shows the change in the nanocluster Au13 core geometry and diagonal lengths for each oxidation state. The anion core was nearly a perfect icosahedron. The slight imperfections left the core with a Th symmetry rather than the Ih symmetry expected of a perfect icosahedron. Oxidation of the anion to the neutral nanocluster resulted in a distortion of the core lowering its symmetry to Ci. The distortion appeared as a tilting of the 10 equatorial triangular faces of the icosahedron caused by the increase in bond angles between the purple, blue, and orange diagonals. In addition, every diagonal decreased in length leading to an overall shrinking of the core. Much greater distortion was observed when oxidized to the cation. The symmetry of the cation core remained Ci but the symmetry deviated further from icosahedron. The equatorial tilting of the icosahedron became much more pronounced as the bond angles between the purple, blue, and orange diagonals further increased. The length of each diagonal also increased with most diagonals surpassing their anionic lengths.
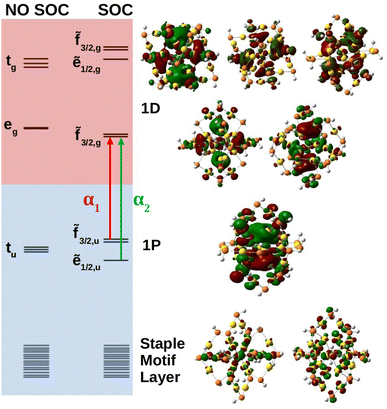
Molecular orbital analysis is necessary in the characterization of the absorbance spectra. Fig. 4 shows the anionic MO diagram calculated with and without SOC along with visualization of the superatomic orbitals. The highest occupied and unoccupied orbitals are the 1P and 1D, respectively. The 1P orbitals generally have the same appearance but lie on different axes. The 1D superatomic orbitals were more diverse in their appearance including having a dz2 or “four-leaf clover” center. Because superatomic orbitals can be identified with molecular orbitals, molecular symmetry dictates how atomic spin–orbit coupling collectively manifests in superatomic orbitals.
The anion superatomic orbitals split in the same manner as atomic orbitals in a Th field as shown in Fig. 4. Double group symmetry is used in the discussion of molecular orbitals under SOC. Irreducible representations (irrep) of the double symmetry is denoted with a tilde. In the discussion of orbital degeneracies, we take the perspective of spin-orbitals (e.g., a non-relativistic hydrogen 2p manifold is a six-fold degeneracy). Without SOC, the 1D superatomic orbitals split into tg and eg while the 1P superatomic orbitals remain degenerate transforming as tu. With SOC, the tg manifold splits into a doubly degenerate ẽ1/2,g and a four-fold degeneracy ![[f with combining tilde]](https://www.rsc.org/images/entities/char_0066_0303.gif) 3/2,g while the eg manifold remains as a four-fold degeneracy (re-designated as
3/2,g while the eg manifold remains as a four-fold degeneracy (re-designated as ![[f with combining tilde]](https://www.rsc.org/images/entities/char_0066_0303.gif) 3/2,g under double group theory). The tu manifold splits into a four-fold degeneracy
3/2,g under double group theory). The tu manifold splits into a four-fold degeneracy ![[f with combining tilde]](https://www.rsc.org/images/entities/char_0066_0303.gif) 3/2,u and a doubly degenerate ẽ1/2,u. The relativistic field splitting was consistent with the predictions of double group theory. Below the 1P superatomic orbitals was a dense region with orbitals delocalized onto the staple motif layer. It was observed that these orbitals do play a key role in the neutral and cationic spectra within the fingerprint region.
3/2,u and a doubly degenerate ẽ1/2,u. The relativistic field splitting was consistent with the predictions of double group theory. Below the 1P superatomic orbitals was a dense region with orbitals delocalized onto the staple motif layer. It was observed that these orbitals do play a key role in the neutral and cationic spectra within the fingerprint region.
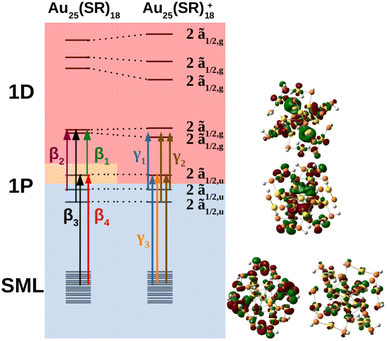
The MO diagram of the neutral and cationic nanoclusters with SOC are shown in Fig. 5 (see ESI† for MO diagrams without SOC). The driver of Jahn–Teller distortion was the removal of electrons from the former 1P ![[f with combining tilde]](https://www.rsc.org/images/entities/char_0066_0303.gif) 3/2,u manifold that breaks the spherical symmetry of the 1P shell. The nanocluster symmetry for both oxidation states lowered to Ci to break the partially filled
3/2,u manifold that breaks the spherical symmetry of the 1P shell. The nanocluster symmetry for both oxidation states lowered to Ci to break the partially filled ![[f with combining tilde]](https://www.rsc.org/images/entities/char_0066_0303.gif) 3/2,u degeneracy. The neutral cluster experienced minor distortion since the destabilized 1P was still singly occupied. This was reflected in the reminiscence of the large energy gap between the former 1D
3/2,u degeneracy. The neutral cluster experienced minor distortion since the destabilized 1P was still singly occupied. This was reflected in the reminiscence of the large energy gap between the former 1D ![[f with combining tilde]](https://www.rsc.org/images/entities/char_0066_0303.gif) 3/2,g and ẽ1/2,g manifolds, resembling Th orbital splitting. The distortion was much greater for the cation since the depopulated 1P can further destabilize without raising overall energy. The 1D superatomic orbitals further separate closing the large energy gap. In both oxidation states, the 1P degeneracy was broken.
3/2,g and ẽ1/2,g manifolds, resembling Th orbital splitting. The distortion was much greater for the cation since the depopulated 1P can further destabilize without raising overall energy. The 1D superatomic orbitals further separate closing the large energy gap. In both oxidation states, the 1P degeneracy was broken.
Shown in Fig. 2 are the experimental and simulated spectra for the three oxidation states of Au25. The most straightforward spectrum is the anionic spectrum shown in Fig. 2a. The anion spectrum consisted of two peaks, α1 and α2. The orbital excitations responsible for α1 and α2 were 1P ẽ1/2,u → 1D ![[f with combining tilde]](https://www.rsc.org/images/entities/char_0066_0303.gif) 3/2,g and 1P
3/2,g and 1P ![[f with combining tilde]](https://www.rsc.org/images/entities/char_0066_0303.gif) 3/2,u → 1D
3/2,u → 1D ![[f with combining tilde]](https://www.rsc.org/images/entities/char_0066_0303.gif) 3/2,g, respectively. From the density of state point of view, α2, arising from four-fold degenerate
3/2,g, respectively. From the density of state point of view, α2, arising from four-fold degenerate ![[f with combining tilde]](https://www.rsc.org/images/entities/char_0066_0303.gif) 3/2,u orbitals, should have a higher intensity than α1, which arises from two-fold degenerate ẽ1/2,u orbitals. However, this is not the case in experiment nor our calculations. Spin projection of 2C-TDDFT results shows that the excited states responsible for α2 are comprised mostly of singlet character whereas those responsible for α1 are comprised mostly of triplet character, as shown in Table 1. Given that the ground state is a closed-shell singlet, the discrepancy in peak intensities is clearly due to the spin selection rule (ΔS = 0).
3/2,u orbitals, should have a higher intensity than α1, which arises from two-fold degenerate ẽ1/2,u orbitals. However, this is not the case in experiment nor our calculations. Spin projection of 2C-TDDFT results shows that the excited states responsible for α2 are comprised mostly of singlet character whereas those responsible for α1 are comprised mostly of triplet character, as shown in Table 1. Given that the ground state is a closed-shell singlet, the discrepancy in peak intensities is clearly due to the spin selection rule (ΔS = 0).
| Peak | Excited state | % triplet | % singlet |
|---|---|---|---|
| α1 | 1 | 74.91% | 25.09% |
| 2 | 67.22% | 32.78% | |
| 3 | 76.65% | 23.35% | |
| α2 | 1 | 34.03% | 65.97% |
| 2 | 26.37% | 73.63% | |
| 3 | 37.74% | 72.26% |
The neutral nanocluster spectrum is shown in Fig. 2b. Many more excited states were responsible for the neutral spectrum than for the anionic spectrum. The features β1 and β2 were direct consequences of Jahn–Teller distortion. Recall that Jahn–Teller distortion breaks the ![[f with combining tilde]](https://www.rsc.org/images/entities/char_0066_0303.gif) 3/2,u degeneracy into a stabilized doubly-occupied 1P and a destabilized singly-occupied 1P. Orbital excitations from the destabilized singly-occupied 1P to the lowest two 1D gave rise to β1. Orbital excitations from the stabilized doubly-occupied 1P to the lowest two 1D gave rise to β2. Along with excitations between superatomic orbitals, the vacancy in 1P opened opportunities for the low energy orbitals delocalized onto the staple motif layer (SML) to excite into the core-localized 1P, suggesting possible ligand–metal charge transfer (LMCT) in the fingerprint region. Mixing of these orbital excitations were pervasive in the excited states throughout the spectrum. Along with orbital excitations from the lowest 1P to the lowest two 1D, SML → 1P LMCT excitations also contributed to electronic transitions that form β3. The rise of SML → 1P LMCT excitations with considerable oscillator strength also led to the broadening of β3 and the rise of β4. Because ligands in the theoretical model differ from experiment (R = SH as opposed to SPET), it is reasonable for the theoretical spectrum to disagree with experiment at β4.
3/2,u degeneracy into a stabilized doubly-occupied 1P and a destabilized singly-occupied 1P. Orbital excitations from the destabilized singly-occupied 1P to the lowest two 1D gave rise to β1. Orbital excitations from the stabilized doubly-occupied 1P to the lowest two 1D gave rise to β2. Along with excitations between superatomic orbitals, the vacancy in 1P opened opportunities for the low energy orbitals delocalized onto the staple motif layer (SML) to excite into the core-localized 1P, suggesting possible ligand–metal charge transfer (LMCT) in the fingerprint region. Mixing of these orbital excitations were pervasive in the excited states throughout the spectrum. Along with orbital excitations from the lowest 1P to the lowest two 1D, SML → 1P LMCT excitations also contributed to electronic transitions that form β3. The rise of SML → 1P LMCT excitations with considerable oscillator strength also led to the broadening of β3 and the rise of β4. Because ligands in the theoretical model differ from experiment (R = SH as opposed to SPET), it is reasonable for the theoretical spectrum to disagree with experiment at β4.
The simulated cation spectrum is shown in Fig. 2c. With the depletion of the highest 1P, β1 was not present in the cationic spectrum, resulting in a single broad peak, labeled γ2, and a low energy tail, labeled γ1. Excitations between the middle 1P and the two lowest 1D along with SML → 1P LMCT excitations were observed in γ1. The high intensity excited state at 1.82 eV that constitutes γ2 also consists mainly of excitations between the middle 1P and the two lowest 1D. The rest of the excited states that constitute γ2 were from orbital excitations between the lowest 1P and the two lowest 1D along with SML → 1P LMCT. The blue-shift of the main peak compared to the neutral spectrum arose from further destabilization of the depleted 1P. Such destabilization increased the energy of excited states involving SML → 1P LMCT, leading to a blue-shift of the main peak. The lack of high intensity excited states at γ3 due to a minimal ligand caused the theoretical spectrum to exhibit a high energy shoulder instead of a single broad peak encompassing both γ2 and γ3, as seen in experiment.
Conclusion
Herein, relativistic 2C-TDDFT with a variational treatment of SOC was employed to investigate the physical underpinnings behind the spectral progression of the Au25 nanocluster UV-Vis absorption spectrum as it oxidizes from −1 to 0 and +1 oxidation states. In addition to reproducing absorption spectra with high accuracy, the effect of the interplay between spin–orbit and Jahn–Teller distortion was carefully analyzed. To our knowledge, this was the first study to provide a thorough picture of the Au25 nanocluster relating SOC, Jahn–Teller distortion, and spectroscopic characteristics.Data availability
Data are available from the corresponding authors upon request.Author contributions
X. Li, D. Jiang, and M. Zhu conceived the project; C. Liao performed the computational study and data analysis; M. Zhu conducted experiments; X. Li was responsible for acquisition of funding; all authors contributed to the development of the manuscript.Conflicts of interest
There are no conflicts to declare.Acknowledgements
The study of spin–orbit effect in molecular spectroscopy is supported by the Air Force Office of Scientific Research (grant no. FA9550-21-1-0344). Computations were facilitated through the use of advanced computational, storage, and networking infrastructure provided by the shared facility supported by the University of Washington Molecular Engineering Materials Center (DMR-1719797) via the Hyak supercomputer system.References
- X. Kang, H. Chong and M. Zhu, Au25(SR)18: The Captain of the Great Nanocluster Ship, Nanoscale, 2018, 10, 10758–10834 RSC.
- Y. Negishi, K. Nobusada and T. Tsukada, Glutathione-Protected Gold Clusters Revisited: Bridging the Gap between Gold(I)-Thiolate Complexes and Thiolate-Protected Gold Nanocrystals, J. Am. Chem. Soc., 2005, 127, 5261–5270 CrossRef CAS PubMed.
- M. W. Heaven, A. Dass, P. S. White, K. M. Holt and R. W. Murray, Crystal Structure of the Gold Nanoparticle [N(C8H17)4][Au25(SCH2CH2Ph)18], J. Am. Chem. Soc., 2008, 130, 3754–3755 CrossRef CAS PubMed.
- J. Akola, M. Walter, R. L. Whetten, H. Häkkinen and H. Grönbeck, On the Structure of Thiolate-Protected Au_25, J. Am. Chem. Soc., 2008, 130, 3756–3757 CrossRef CAS PubMed.
- M. Zhu, C. M. Aikens, F. J. Hollander, G. C. Schatz and R. Jin, Correlating the Crystal Structure of A Thiol-Protected Au25 Cluster and Optical Properties, J. Am. Chem. Soc., 2008, 130, 5883–5885 CrossRef CAS PubMed.
- J. F. Parker, C. A. Fields-Zinna and R. W. Murray, The Story of a Monodisperse Gold Nanoparticle: Au25L18, Acc. Chem. Res., 2010, 43, 1289–1296 CrossRef CAS PubMed.
- Y. Cao, T. Chen, Q. Yao and J. Xie, Diversification of Metallic Molecules through Derivatization Chemistry of Au25 Nanoclusters, Acc. Chem. Res., 2021, 54, 4142–4153 CrossRef CAS PubMed.
- D.-e. Jiang, M. Kühn, Q. Tang and F. Weigand, Superatomic Orbitals under Spin–Orbit Coupling, J. Phys. Chem. Lett., 2014, 5, 3286–3289 CrossRef CAS PubMed.
- J. C. Gonzalez and A. Muñoz Castro, Doping the Superatom with p-Elements: The Role of p-Block Endohedral Atoms in Bonding and Optical Properties of E@Au24(SR)_18 (E = Si, Ge, Sn, and Pb) from Relativistic DFT Calculations, J. Phys. Chem. C, 2016, 120, 27019–27026 CrossRef.
- F. Alkan, A. Muñoz Castro and C. M. Aikens, Relativistic DFT Investigation of Electronic Structure Effects Arising from Doping the Au25 Nanocluster with Transition Metals, Nanoscale, 2017, 9, 15825–15834 RSC.
- F. Gam, D. Paez-Hernandez, R. Arratia-Perez, C. Liu, S. Kahlal, J.-Y. Saillard and A. Muñoz Castro, Coinage Metal Superatomic Cores: Insights into Their Intrinsic Stability and Optical Properties from Relativistic DFT Calculations, Chem.–Eur. J., 2017, 23, 11330–11337 CrossRef CAS PubMed.
- Y. Negishi, N. K. Chaki, Y. Shichibu, R. L. Whetten and T. Tsukuda, Origin of Magic Stability of thiolated Gold Clusters: A Case Study on Au25(SC6H13)18, J. Am. Chem. Soc., 2007, 129, 11322–11323 CrossRef CAS PubMed.
- M. Zhu, W. T. Eckenhoff, T. Pintauer and R. Jin, Conversion of Anionic [Au25(SCH2CH2Ph)18]-Cluster to Charge Neutral Cluster via Air Oxidation, J. Phys. Chem. C, 2008, 112, 14221–14224 CrossRef CAS.
- S. Antonello, N. V. Perera, M. Ruzzi, J. A. Gascón and F. Maran, Interplay of Charge State, Lability, and Magnetism in the Molecule-like Au25(SR)18 Cluster, J. Am. Chem. Soc., 2013, 135, 15585–15594 CrossRef CAS PubMed.
- M. A. Tofanelli, K. Salorinne, T. W. Ni, S. Malola, B. Newell, B. Phillips, H. Häkkinen and C. J. Ackerson, Jahn-Teller Effects in Au25(SR)18, Chem. Sci., 2016, 7, 1882–1890 RSC.
- M. Walter, J. Akola, O. Lopez-Acevedo and H. Häkkinen, A Unified View of Ligand-Protected Hold Clusters as Superatom Complexes, Proc. Natl. Acad. Sci. U. S. A., 2008, 105, 9157–9162 CrossRef CAS PubMed.
- M. Kim, Q. Tang, A. V. N. Kumar, K. Kwak, W. Choi, D.-e. Jiang and D. Lee, Dopant-Dependent Electronic Structures Observed for M2Au36(SC6H13)24 Clusters (M = Pt, Pd), J. Phys. Chem. Lett., 2018, 9, 982–989 CrossRef CAS PubMed.
- K. Kwak and D. Lee, Electrochemistry of Atomically Precise Metal Nanoclusters, Acc. Chem. Res., 2019, 52, 12–22 CrossRef CAS PubMed.
- S. Wang, L. Tang, G. Cai, Z. Yin, Y. Li, L. Xiong, X. Kang, J. Xuan, Y. Pei and M. Zhu, Ligand Modification of Au25 Nanoclusters for Near-Infrared Photocatalytic Oxidative Functionalization, J. Am. Chem. Soc., 2022, 144, 3787–3792 CrossRef CAS PubMed.
- C. M. Aikens, Geometric and Electronic Structure of Au25(SPHX)18− (X = H, F, Cl, Br, CH3, and OCH3), J. Phys. Chem. Lett., 2010, 1, 2594–2599 CrossRef CAS.
- M. De Nardi, S. Antonello, D.-e. Jiang, F. Pan, K. Rissanen, M. Ruzzi, A. Venzo, A. Zoleo and F. Maran, Gold Nanowired: A Linear (Au25)n Polymer from Au25 Molecular Clusters, ACS Nano, 2014, 8, 8505–8512 CrossRef CAS PubMed.
- M. J. Frisch, G. W. Trucks, H. B. Schlegel, G. E. Scuseria, M. A. Robb, J. R. Cheeseman, G. Scalmani, V. Barone, G. A. Petersson, H. Nakatsuji, X. Li, M. Caricato, A. V. Marenich, J. Bloino, B. G. Janesko, R. Gomperts, B. Mennucci, H. P. Hratchian, J. V. Ortiz, A. F. Izmaylov, J. L. Sonnenberg, D. Williams-Young, F. Ding, F. Lipparini, F. Egidi, J. Goings, B. Peng, A. Petrone, T. Henderson, D. Ranasinghe, V. G. Zakrzewski, J. Gao, N. Rega, G. Zheng, W. Liang, M. Hada, M. Ehara, K. Toyota, R. Fukuda, J. Hasegawa, M. Ishida, T. Nakajima, Y. Honda, O. Kitao, H. Nakai, T. Vreven, K. Throssell, J. A. Montgomery, J. E. Peralta, F. Ogliaro, M. J. Bearpark, J. J. Heyd, E. N. Brothers, K. N. Kudin, V. N. Staroverov, T. A. Keith, R. Kobayashi, J. Normand, K. Raghavachari, A. P. Rendell, J. C. Burant, S. S. Iyengar, J. Tomasi, M. Cossi, J. M. Millam, M. Klene, C. Adamo, R. Cammi, J. W. Ochterski, R. L. Martin, K. Morokuma, O. Farkas, J. B. Foresman and D. J. Fox, Gaussian Development Version Revision I.11+ Search PubMed.
- M. Ernzerhof and G. E. Scuseria, Assessment of the Perdew-Burke-Ernzerhof exchange-correlation functional, J. Chem. Phys., 1999, 110, 5029–5036 CrossRef CAS.
- C. Adamo and V. Barone, Toward reliable density functional methods without adjustable parameters: The PBE0 model, J. Chem. Phys., 1999, 110, 6158–6169 CrossRef CAS.
- L. F. Pacios and P. A. Christiansen, Ab Initio Relativistic Effective Potentials with Spin-orbit Operators. I. Li through Ar, J. Chem. Phys., 1984, 82, 2664–2671 CrossRef.
- R. B. Ross, J. M. Powers, T. Atashroo, W. C. Ermler, L. A. LaJohn and P. A. Christiansen, Ab Initio Relativistic Effective Potentials with Spin-orbit Operators. IV. Cs through Rn, J. Chem. Phys., 1990, 93, 6654–6670 CrossRef CAS.
- D. Feller, The Role of Databases in Support of Computational Chemistry Calculations, J. Comput. Chem., 1996, 17, 1571–1586 CrossRef CAS.
- K. L. Schuchardt, B. T. Didier, T. Elsethagen, L. Sun, V. Gurumoorthi, J. Chase, J. Li and T. L. Windus, Basis Set Exchange: A Community Database for Computational Sciences, J. Chem. Inf. Model., 2007, 47, 1045–1052 CrossRef CAS PubMed.
- B. P. Pritchard, D. Altarawy, B. Didier, T. D. Gibson and T. L. Windus, New Basis Set Exchange: An Open, Up-to-Date Resource for the Molecular Sciences Community, J. Chem. Inf. Model., 2019, 59, 4814–4820 CrossRef CAS PubMed.
- M. S. Devadas, S. Bairu, H. Qian, E. Sinn, R. Jinn and G. Ramakrishna, Temperature-Dependent Optical Absorption Properties of Monolayer-Protected Au25 and Au38 Clusters, J. Phys. Chem. Lett., 2011, 2, 2752–2758 CrossRef CAS.
- K. Kwak, Q. Tang, M. Kim, D.-e. Jiang and D. Lee, Interconversion between Superatomic 6-Electron and 8-Electron Configurations of M@Au24(SR)18 Clusters (M = Pd, Pt), J. Am. Chem. Soc., 2015, 137, 10833–10840 CrossRef CAS PubMed.
Footnote |
| † Electronic supplementary information (ESI) available. See DOI: https://doi.org/10.1039/d3sc00944k |
| This journal is © The Royal Society of Chemistry 2023 |

