 Open Access Article
Impact of electrolyte decomposition products on the electrochemical performance of 4 V class K-ion batteries†
Tomooki
Hosaka
 ,
Tatsuo
Matsuyama
,
Ryoichi
Tatara
,
Tatsuo
Matsuyama
,
Ryoichi
Tatara
 ,
Zachary T.
Gossage
 and
Shinichi
Komaba
 *
*
Department of Applied Chemistry, Tokyo University of Science, Shinjuku, Tokyo 162-8601, Japan. E-mail: komaba@rs.tus.ac.jp
First published on 12th July 2023
Abstract
In the pursuit of long-life K-ion batteries (KIBs), half-cell measurements using highly reactive K metal counter electrodes are a standard practice. However, there is increasing evidence of electrolyte decomposition by K metal impacting electrode performance. Herein, we systematically explored the K metal-treated electrolytes KPF6, KN(SO2F)2 (KFSA), and their combination in ethylene carbonate/diethyl carbonate (EC/DEC), referred to as K-KPF6, K-KFSA, and K-KPF6:KFSA, respectively, after storage in contact with K metal. Through mass spectrometry analysis, we identified significant formation of carbonate ester-derived decomposition products such as oligocarbonates for K-KPF6, while K-KFSA predominantly generates anions combining FSA− with the solvent structures. Using three-electrode cells, we delineated the positive effects of the K-KFSA and K-KPF6:KFSA electrolytes on graphite negative electrode performance and the negative impact of oligocarbonates in K-KPF6 on K2Mn[Fe(CN)6] positive electrodes. The interactions between the decomposition products and the electrodes were further evaluated using density functional theory calculations. Full cell measurements using K-KPF6:KFSA showed an improved energy density and capacity retention of 78% after 500 cycles compared with an untreated electrolyte (72%). Hard X-ray photoelectron spectroscopy indicated the incorporation of the FSA-derived structures into the solid electrolyte interphase at graphite, which was not observed in K metal-free cells. Overall, this work indicates further complexities to consider in KIB measurements and suggests the potential application of decomposition products as electrolyte additives.
Introduction
K-ion batteries (KIBs) are developing into a promising competitor to Li-ion batteries (LIBs) with voltages approaching 4 V, good positive and negative electrode capacities, and long cycle lifetimes.1,2 At the same time, KIBs can be constructed without the use of the scarce or expensive metals commonly found in LIBs including Li, Co, and Cu.1,3,4 They instead utilize low-cost, earth abundant elements for their positive electrode materials, including Fe, Mn, and C, but still rely on graphitic or hard carbon materials for their negative electrodes. Furthermore, the use of a K+ electrolyte is amenable with Al current collectors, which normally reacts to form alloy phases with Li+ at a lower potential. Although significant progress has been made toward developing long cycle life KIBs, researchers continue to look for improved electrode materials5–8 and optimize electrolytes9,10 to attain further improved performance.In studies of new electrode materials and electrolytes for KIBs, a common practice is to conduct a test in a half-cell configuration where composite electrodes of positive or negative electrode materials are paired with a highly reactive K metal counter electrode. The presence of K metal has been reported to alter both the electrochemical performance and interface chemistry of the working electrode via migration of electrolyte decomposition products across the cell.11–13 Indeed, our group has reported significant differences in the irreversible capacities between half- and full cells when using both positive and negative electrodes.14,15 Even when using the same batch of electrodes, we have observed full cells that perform more poorly than their half-cell counterparts. Furthermore, we have reported improvements in full-cell performance when using potassium bis(fluorosulfonyl)amide (KFSA)-based electrolytes that were pretreated by soaking with K metal.14,15 Our first report proposed that a reduction in water content from 43 ppm to 10 ppm via K-metal treatment could be responsible for improving electrochemical properties.14 However, we also observed a significant improvement in the electrochemical performance of the full cell upon K-metal treatment when using an ionic liquid with a sufficiently low initial water content (13 ppm), even though the K-metal treatment had a small impact on the water content (9 ppm after treatment).15 While some improvements may be related to K metal consuming residual water content in the electrolyte, the generation of soluble decomposition products formed by the reaction with K metal is also plausible, as others have discussed.16 To date, the identification of such soluble decomposition products and knowledge on how they impact KIB performance remain limited.
In this study, we systematically evaluated the electrolyte decomposition products formed between K metal and electrolytes prepared with KPF6, KFSA or the combined salts (K(PF6)0.75(FSA)0.25) dissolved in ethylene carbonate/diethyl carbonate (EC/DEC).17,18 After storing the electrolytes with K metal for 7 days, we tested the impact of each electrolyte on the cycling performance of positive electrodes containing Prussian blue analogues (K2Mn[Fe(CN)6]) and graphite negative electrodes. Overall, we observed improved performance when using pretreated KFSA and K(PF6)0.75(FSA)0.25 electrolytes, and negative effects upon pretreating the KPF6 electrolyte. To further identify the decomposition products of each electrolyte, we utilized gas chromatography-mass spectrometry (GC-MS) and liquid chromatography-mass spectrometry (LC-MS). Our analyses agreed with previous studies14,19,20 and indicated that KFSA helped hinder solvent decomposition, while significantly higher contents of carbonate ester-derived decomposition products were generated in the KPF6/EC/DEC electrolyte. The reductive decomposition potentials of the electrolytes and their identified decomposition products were further evaluated using density functional theory (DFT) calculations. The SEI composition and thickness of the cycled graphite electrodes were characterized using hard X-ray photoelectron spectroscopy (HAXPES) analysis.
Results and discussion
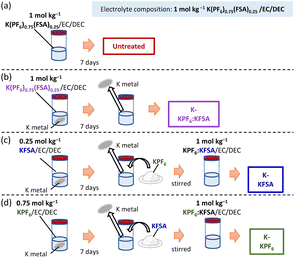
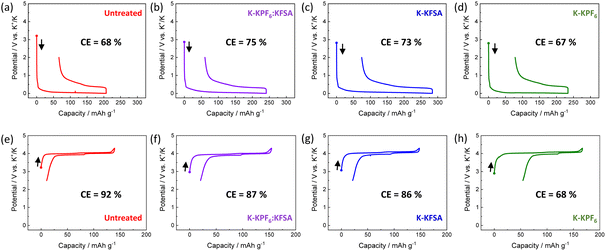
To investigate the impact of degradation products on KIB performance, we prepared electrolytes containing KPF6, KFSA or K(PF6)0.75(FSA)0.25 dissolved in EC/DEC. We stored 2 mL of each electrolyte in contact with four freshly cut K metal disks with a diameter of 15 mm for 7 days (Fig. 1a–d). Thereafter, the K metal was removed, and all the concentration and composition of electrolytes were adjusted to 1 mol kg−1 K(PF6)0.75(FSA)0.25/EC/DEC by adding either KFSA or KPF6, as seen in Fig. 1b–d. We denote the obtained electrolytes based on their treatment by K metal (e.g. K-KPF6, K-KFSA, etc., Fig. 1b–d). As seen in Fig. 2a–d, we tested the charge–discharge behavior of graphite in each of the electrolytes using a three-electrode cell with a K2Mn[Fe(CN)6] counter and a Ag/Ag+ reference isolated by a ceramic frit (Fig. S1†). We chose graphite due to its relatively high density of 2.3 g cm−3, theoretical capacity of 279 mA h g−1 for KC8 and low potential for K+ insertion.9,21,22 In the first cycle, the cells containing an untreated electrolyte exhibited a low reversible capacity (150 mA h g−1) and coulombic efficiency (CE) of 68% (Fig. 2a). For cells containing the K-KPF6:KFSA (Fig. 2b) and K-KFSA (Fig. 2c) electrolytes, higher reversible capacities (>180 mA h g−1) and CEs (>73%), and less cell polarization were observed. Likewise, the capacities were also improved in three-electrode cell measurements using a K metal counter electrode and the untreated KPF6:KFSA electrolyte (Fig. S2†). As in previous studies, decomposition of the electrolyte impurities (e.g. water) at the K metal seemed to improve the electrolyte and cell performance.12,14,15,19 However, the K-KPF6 cell did not improve the CE or cell polarization, and only showed a modest increase in the discharge capacity (Fig. 2d). The water content of the untreated 1 mol kg−1 K(PF6)0.75(FSA)0.25/EC/DEC and K-KPF6:KFSA electrolytes were in the range of 10–15 ppm and 5–10 ppm, respectively, which were measured by Karl Fischer titration. It should be noted that despite the careful drying of the electrolyte salts, the influence of water could not be completely eliminated due to the difficulty in controlling such contamination and quantitative measurements. Nevertheless, water/impurity removal by K metal could not fully explain the improved performances for K-KFSA and K-KPF6:KFSA because all the electrolytes were of similar composition and purity. Therefore, we speculate that the decomposition products from KFSA reacted with K metal led to the improved performance, while different products formed between the KPF6 electrolyte and K metal did not strongly impact the graphite electrode.Following the same procedure, we tested the impact of the K metal-treated electrolytes on the electrochemical performance of K2Mn[Fe(CN)6] positive electrodes (Fig. 2e–h). Prussian blue analogues (PBAs) are a favorable choice for the positive electrode since they can be prepared with scalable low-cost methods and materials and exhibit good electrode performance due to their open structure supporting the diffusion of large K+ ions.23–26 For this cell, we again used a Ag/Ag+ reference electrode, but switched to an excess activated carbon electrode for the counter. As seen in Fig. 2e, the cell filled with the untreated KPF6:KFSA electrolyte showed a reasonable initial reversible capacity of approximately 130 mA h g−1 and a high CE of 92%. Two plateaus were observed at 3.9 V and 4.0 V vs. K+/K, in line with previous reports on K2Mn[Fe(CN)6].24,26,27 The cells containing K-KPF6:KFSA (Fig. 2f) and K-KFSA (Fig. 2g) showed similar initial reversible capacities of ∼130 mA h g−1 but slightly lower CEs (86–87%) compared with the untreated electrolyte. On the other hand, the K-KPF6 electrolyte strongly impacted the K2Mn[Fe(CN)6] cell, exhibiting the poorest performance with the lowest reversible capacity (110 mA h g−1) and CE (67.5%) (Fig. 2h). Poor performance was also observed when using a K metal counter electrode with the untreated, 1 mol kg−1 K(PF6)0.75(FSA)0.25 electrolyte (Fig. S3†). While the decomposition products of the KPF6 electrolyte did not have a strong impact on the graphite electrode, they appeared to produce a notable negative effect on the performance of K2Mn[Fe(CN)6].20,28
To identify the electrolyte decomposition products, we utilized gas chromatography-mass spectrometry (GC-MS) and liquid chromatography-mass spectrometry (LC-MS). Fig. 3 displays the total ion current (TIC) chromatogram of GC-MS for untreated, K-KPF6:KFSA, K-KPF6, and K-KFSA electrolytes. The two major peaks, which are shown in all the electrolytes at the retention times of 3.35 min and 10.84 min, were assigned to DEC and EC (electron ionization (EI)-MS spectra are provided in Fig. S4 and S5†). The TIC chromatogram of K-KPF6 showed three additional peaks at retention times of 13.2 min (#1), 16.1 min (#2), and 18.6 min (#3). In contrast, the K-KFSA and K-KPF6:KFSA showed only one additional peak at 13.2 min that was low in intensity, indicating more effective passivation of the K metal surface and a lower production of decomposition products. We estimated the chemical structures for each of the three products (#1–3) using fragments from EI-MS spectra (Fig. S6–S8†) and molecular weights determined by chemical ionization (CI)-MS, combined with results obtained from LC-MS in positive mode (Fig. S9 and Table S1†). Peaks #1-3 had masses of 206, 250, and 294, which we assigned to oligocarbonates of C8H14O6, C10H18O7, and C11H18O9, respectively (Table 1). Such oligocarbonates are typically formed by the ring opening of EC and a subsequent reaction with DEC and are observed in aged Li-ion battery electrolyte under harsh conditions29–32 and within K metal cells.20 We further confirmed the presence of the oligocarbonates using LC-MS in positive mode. Again, the K-KPF6 electrolyte contained a significantly higher amount of various oligocarbonates, such as C8H14O16, C12H22O8, C10H18O7, C11H18O9, and C14H22O12, compared with the K-KFSA electrolyte (Fig. S9–S17 and Table S1†). Some oligocarbonates are likely oxidized at high potentials of 3.5 V vs. K+/K,20 which may play a role in the high irreversible capacity of the K2Mn[Fe(CN)6] electrode in the K-KPF6 electrolyte, as seen in Fig. 2h. To discuss the correlation between the oligocarbonates and the irreversible capacity, Fig. S18† shows the relative peak area of the oligocarbonates in the TIC of GC-MS (Fig. 3) and the irreversible capacity of the K2Mn[Fe(CN)6] electrode (Fig. 2e–h). As the peak area of the oligocarbonates increases, the irreversible capacity also increases, showing a positive correlation between the amount of oligocarbonates and the irreversible capacity. It should be noted that the synthesis and addition of each oligocarbonate to the electrolyte is necessary to experimentally elucidate the effect of each oligocarbonate on the irreversible capacity, which should be studied in detail in the future.
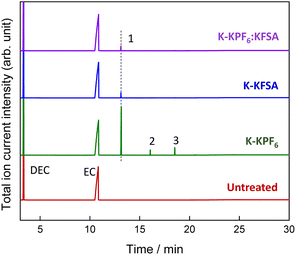 | ||
| Fig. 3 GC-MS analysis of the electrolytes: total ion current chromatogram of untreated, K-KPF6, K-KFSA, and K-KPF6:KFSA electrolytes. | ||
We conducted further LC-MS measurements in negative mode (Fig. 4), which enabled the detection of several anionic species in the electrolytes. The chromatograms showed peaks for PF6− and FSA− anions, and acetate anion from the eluent. The K-KFSA electrolyte showed other notable peaks that were assigned to C5H9FNO8S2− (10.8 min), C7H13FNO9S2− (11.4 min), and C8H13FNO11S2− (13.7 min) using accurate mass and isotope pattern analysis (Fig. S19–S21†). These structures are apparent products originating from bond formation between the FSA− anion and the solvent molecules (Table 1). The K-KPF6 electrolyte also showed a small peak at 10.8 min. This is possibly due to some reactive decomposition products in the K-KPF6 electrolyte that further reacted with the FSA− anion after mixing (Fig. 1d). However, it should be noted that quantitative analysis of these FSA-derived products was not feasible due to their minute amounts. Overall, the GC-MS and LC-MS results suggest a connection between these FSA-derived anions and the observed improvements in K-KFSA and K-KPF6:KFSA electrolytes. These products possibly act like other electrolyte additives for KIBs that help the SEI formation and improve the cell performance.9,17,33
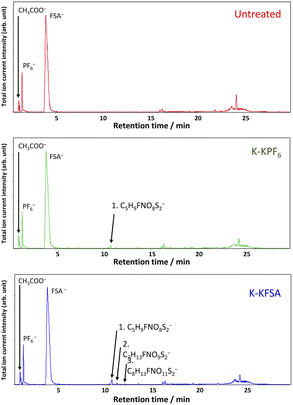 | ||
| Fig. 4 LC-MS analysis of the electrolytes in negative mode: total ion current chromatogram of untreated (top), K-KPF6 (middle), and K-KFSA (bottom) electrolytes. | ||
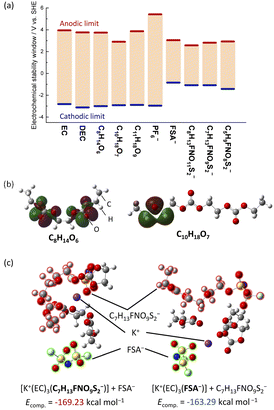
We further considered the cathodic and anodic stabilities of the identified decomposition products using DFT calculations conducted at the B3LYP/6-31G+(d,p) level and the integral equation formalism polarizable continuum model (IEFPCM).34 As seen in Fig. 5a, we calculated the cathodic and anodic limits of the molecules in a polar solvent. All the oligocarbonate decomposition products showed cathodic stabilities similar to EC and DEC. However, C10H18O7 were found to be more easily oxidized due to the ether bonds in their structure. The highest occupied molecular orbitals (HOMOs) of C8H14O6 and C11H18O9, which have no ether bonds, were mainly distributed around the ester bonds (Fig. 5b, left and S22†), whereas the HOMO of C10H18O7 (Fig. 5b, right) was distributed around the ether bonds. The calculated anodic potential (2.90 V vs. SHE) of C10H18O7 was higher than the potential at which the irreversible capacity was observed, approximately 4.0 V vs. K+/K (1.12 V vs. SHE). However, this overestimation is generally observed in DFT calculations of isolated solvents using PCM since the calculation does not include proton–transfer reactions during the oxidation process.35 Nevertheless, the DFT calculations suggest that the oligocarbonates, especially those with ether bonds, oxidize on the positive electrode surface and lead to an irreversible capacity.
On the reduction side, the FSA-derived anions show stabilities similar to FSA− and would likely further decompose at the negative electrode to contribute to SEI formation. Since anion reduction can be further enhanced when coordinated with K+ ions,36,37 we considered the complexation energies of C7H13FNO9S2− and FSA− with the K+ ion. We evaluated two optimized structures with K+ coordinated to either C7H13FNO9S2− ([K+(EC)3(C7H13FNO9S2−)] + FSA−) or FSA− ([K+(EC)3(FSA−)] + C7H13FNO9S2−) (Fig. 5c). The K(EC)3(C7H13FNO9S2) system showed a more stable complexation energy of −169.23 kcal mol−1 compared to K(EC)3(FSA) (−163.29 kcal mol−1), indicating the preferential formation of contact ion pairs (CIP) with C7H13FNO9S2− and K+ compared with those of FSA−. Therefore, it is likely that C7H13FNO9S2− more easily decomposes at the negative electrode than the FSA− anions, and this contributes to SEI formation and impact performance as observed in our measurements on graphite.
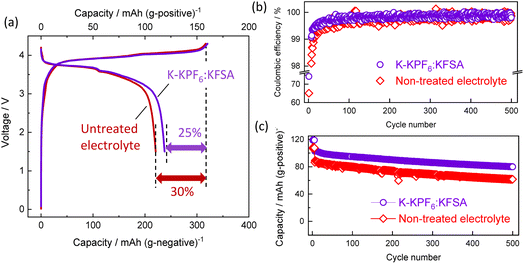
Building on our previous results, we evaluated the K-KPF6:KFSA electrolyte further in a graphite‖K2Mn[Fe(CN)6] full cell. As shown in Fig. 6a, the initial charge/discharge curves for the K-KPF6:KFSA electrolyte (purple) cell exhibited a larger reversible capacity (119 mA h g−1 positive) and higher CE efficiency (74.5%) than the untreated electrolyte cell shown in red (110 mA h g−1 and 69.6%). The improved initial CE for the K-KPF6:KFSA electrolyte led to a higher energy density of 277 W h (kg-active materials)−1 compared with that of 257 W h kg−1 in the untreated electrolyte. Fig. 6b and c displays the CE and capacity retention over 500 cycles. For both cells, an initial current rate of 15.5 mA (g of positive electrode active mass)−1 was applied for five cycles, then the rate was increased to 155 mA g−1 for the remaining cycles. For more than 100 cycles, the K-KPF6:KFSA cell continued to demonstrate a higher CE than the untreated electrolyte (Fig. 6b), though both cells eventually showed CEs of approximately 99.9%. Furthermore, the use of K-KPF6:KFSA improved the full cell's capacity retention (78%) compared with the untreated cell (72%), as shown in Fig. 6c. Ultimately, our results suggest that the electrolyte decomposition products formed by K metal treatment can minimize battery capacity loss by promoting initial SEI formation.
Next, we conducted surface analysis of graphite electrodes after 10 cycles in our untreated 1 mol kg−1 K(PF6)0.75(FSA)0.25/EC/DEC electrolyte using both full (graphite‖K2Mn[Fe(CN)6]) and half cells using a K metal counter electrode (Fig. S23†) in coin cells. SEM images of the uncycled graphite electrodes and after cycling in the full and half cells are shown in Fig. S24a–c.† Graphite cycled in both half and full cells showed similar morphology to that of the pristine electrode. We used hard X-ray photoelectron spectroscopy (HAXPES) analysis to investigate the composition and thickness of the SEI layer formed on the graphite electrodes. The HAXPES can detect photoelectrons from deeper regions into the SEI, e.g. >10 nm, compared with soft X-rays that measures to depths of only a few nanometers.38,39 All spectra intensities of HAXPES data were corrected by relative sensitivity factors40 and normalized by the integrated intensity of the sp2 C peak for graphite at 284.3 eV. As seen in Fig. S25,† the C 1s spectra of the pristine electrode showed several peaks that could be deconvoluted and assigned to sp2![[C with combining low line]](https://www.rsc.org/images/entities/char_0043_0332.gif) , –
, –![[C with combining low line]](https://www.rsc.org/images/entities/char_0043_0332.gif) Hx–, –
Hx–, –![[C with combining low line]](https://www.rsc.org/images/entities/char_0043_0332.gif) HxC(
HxC(![[double bond, length as m-dash]](https://www.rsc.org/images/entities/char_e001.gif) O)O–, –
O)O–, –![[C with combining low line]](https://www.rsc.org/images/entities/char_0043_0332.gif) OR– and –
OR– and –![[C with combining low line]](https://www.rsc.org/images/entities/char_0043_0332.gif) (
(![[double bond, length as m-dash]](https://www.rsc.org/images/entities/char_e001.gif) O)O– components.39 Other than the sp2 C peak, the other components are due to the CMC binder. HAXPES analysis of the cycled graphite electrode from the full cell filled with the untreated electrolyte (Fig. 7a) showed more pronounced peaks for –
O)O– components.39 Other than the sp2 C peak, the other components are due to the CMC binder. HAXPES analysis of the cycled graphite electrode from the full cell filled with the untreated electrolyte (Fig. 7a) showed more pronounced peaks for –![[C with combining low line]](https://www.rsc.org/images/entities/char_0043_0332.gif) H2C(
H2C(![[double bond, length as m-dash]](https://www.rsc.org/images/entities/char_e001.gif) O)O– (285.8 eV),
O)O– (285.8 eV), ![[R with combining low line]](https://www.rsc.org/images/entities/char_0052_0332.gif) –OK/–
–OK/–![[C with combining low line]](https://www.rsc.org/images/entities/char_0043_0332.gif) (
(![[double bond, length as m-dash]](https://www.rsc.org/images/entities/char_e001.gif) O)– (287.2 eV), –
O)– (287.2 eV), –![[C with combining low line]](https://www.rsc.org/images/entities/char_0043_0332.gif) (
(![[double bond, length as m-dash]](https://www.rsc.org/images/entities/char_e001.gif) O)O– (288.2 eV), and –O
O)O– (288.2 eV), and –O![[C with combining low line]](https://www.rsc.org/images/entities/char_0043_0332.gif) (
(![[double bond, length as m-dash]](https://www.rsc.org/images/entities/char_e001.gif) O)O– (289.8 eV) components.39 These organic species can be mainly attributed to solvent-derived decomposition products involved in surface film formation. The graphite electrode cycled in the half cell showed an additional peak at 291.1 eV (Fig. 7b), which should be attributed to a highly polarized carbon species connected to electronegative atoms/groups such as –CFx or FSA-derived anions observed by LC-MS, e.g. –SO2–OC
O)O– (289.8 eV) components.39 These organic species can be mainly attributed to solvent-derived decomposition products involved in surface film formation. The graphite electrode cycled in the half cell showed an additional peak at 291.1 eV (Fig. 7b), which should be attributed to a highly polarized carbon species connected to electronegative atoms/groups such as –CFx or FSA-derived anions observed by LC-MS, e.g. –SO2–OC![[double bond, length as m-dash]](https://www.rsc.org/images/entities/char_e001.gif) (
(![[double bond, length as m-dash]](https://www.rsc.org/images/entities/char_e001.gif) O)O– or –SO2–O–. Since this peak was only observed in the half cell, it is likely that reactions between the FSA-derived anions and K metal lead to more poorly soluble components that further react or deposit on the graphite electrode.
O)O– or –SO2–O–. Since this peak was only observed in the half cell, it is likely that reactions between the FSA-derived anions and K metal lead to more poorly soluble components that further react or deposit on the graphite electrode.
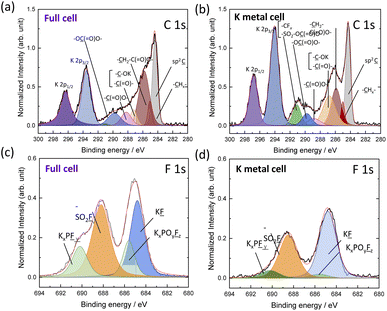 | ||
| Fig. 7 HAXPES spectra of the graphite electrode after 10 cycles: C 1s and K 2p spectra of (a) full cell and (b) half-cell electrodes, F 1s spectra of (c) full cell and (d) half-cell electrodes. | ||
Looking to the F 1s spectra (Fig. 7c and d), we observed peaks that can be deconvoluted to KF, KxPOyFz and –SO2F, KxPFy, as previously reported.17,41,42 In the HAXPES spectra, KF and KxPOyFz are derived from electrolyte salt decomposition products only, while –SO2F and KxPFy can be derived from both electrolyte salt decomposition products and residual electrolyte salts. The electrode from the half-cell exhibited much lower peak intensities for KxPOyFz than the full cell electrode, which could indicate suppressed KPF6 decomposition. Likewise, the P 1s and O 1s HAXPES spectra also indicated less KxPOyFz on the electrode cycled in the half-cell containing K metal (Fig. S26a–d†). This agrees well with our GC-MS analysis (Fig. 3) which also suggested that FSA-derived decomposition products can suppress further reactions with KPF6. Although the SEI compositions of the half and full cells were different, we observed a similar total atomic content for both electrodes (Fig. S27†), suggesting similar SEI thicknesses. Altogether, the surface and electrochemical analyses agree that K metal interaction with the solvent and electrolyte salts strongly impacts the cell performance through the generation of unique electrolyte species.
Finally, if we compare the obtained reactions of KPF6/EC:DEC electrolytes with K metal with the previous studies of LiPF6 and NaPF6/carbonate ester electrolytes, the reactivity of APF6/EC:DEC electrolytes with alkali metals increases in the order of Li < Na < K,11,20,43 which can be attributed to the stability of SEI on the metals.11,20,43 In fact, this study found that a large amount of oligocarbonates was formed in the KPF6/EC:DEC electrolyte reacted with K-metal, indicating insufficient passivation of the K-metal. However, K-metal was better passivated in KFSA-containing electrolytes, including KPF6-KFSA electrolytes, and the oligocarbonate formation was effectively suppressed. This effect was similar to that of 1,3,2-dioxathiolane 2,2-dioxide (DTD), which we reported as an effective additive for K-metal.20 Therefore, half-cell tests using K-metal as the counter electrode require the use of an electrolyte containing DTD or KFSA. More importantly, the electrolyte decomposition products formed in KFSA-containing electrolytes promote SEI formation on the negative electrodes and improve the electrode performances, which is the main reason for the significant difference in negative electrode performances in half and full cells using KFSA-based electrolytes. To further understand the impact of FSA-derived products on battery performance, future research should focus on synthesizing them using a reducing agent and their addition to electrolytes. In addition, determining the optimal concentration of these products in electrolytes should also be explored. Moreover, other types of negative electrodes besides graphite should be investigated. Although this study focused on electrolyte decomposition on K-metal, similar electrolyte decomposition could occur on other low-potential negative electrodes such as graphite and should be investigated in future work. Since this study revealed that FSA-derived decomposition products such as C7H13FNO9S2− promote stable SEI formation, the development of such additives would solve the low coulombic efficiency, a major problem of high-voltage KIBs, and pave the way for practical application.
Experimental
Electrolyte preparation
KFSA (Solvionic) and KPF6 (Kishida Chemical) were dried under vacuum before electrolyte preparation at 100 °C for 24 h and 200 °C for 12 h, respectively. Battery grade reagents of EC and DEC solvents (Kishida Chemical) were used as received. Electrolytes containing 0.75 mol kg−1 KPF6, 0.25 mol kg−1 KFSA or their combination (1 mol kg−1 K(PF6)0.75(FSA)0.25) were dissolved in EC/DEC (total of 2 mL) and stored for 7 days in contact with four pieces of freshly cut K metal disk (15 mm diameter) (Fig. 1). The K metal disks were removed, and all the electrolytes were adjusted to 1 mol kg−1 K(PF6)0.75(FSA)0.25/EC/DEC by adding either KFSA or KPF6. All electrolyte solutions were prepared in an Ar-filled glovebox where the dew point was maintained below −80 °C.Materials and electrode preparation
K2Mn[Fe(CN)6] was synthesized via a chelate-assisted precipitation method as previously reported.14,26 The K2Mn[Fe(CN)6] electrodes consisting of a mixture of 70 wt% K2Mn[Fe(CN)6], 20 wt% Ketjen black (KB, Carbon ECP, Lion), and 10 wt% polytetrafluoroethylene (PTFE, Daikin) were prepared by mixing with a mortar and pestle. The electrode pellet was formed on Al expanded metal and dried at 150 °C under vacuum. Graphite electrodes were prepared by mixing 90 wt% graphite (SNO3, SEC Carbon) and 10 wt% sodium carboxymethyl cellulose (CMC, #2200, Daicel FineChem) with a mortar and pestle followed by a planetary mixer (ARE-310, Thinky). The slurry was spread on Al foil using the doctor blade method and then dried at 150 °C under vacuum. The mass loading of K2Mn[Fe(CN)6] in the electrodes was ∼5.7 mg cm−2 in K‖graphite half-cell and 4.0 mg cm−2 in full cells. The mass loading of graphite in the electrodes was ∼2.0 mg cm−2 in K‖graphite half-cell and full cells. The mass loading ratio of negative and positive electrodes for full cells was fixed to N/P = 1.0![[thin space (1/6-em)]](https://www.rsc.org/images/entities/char_2009.gif) :
:![[thin space (1/6-em)]](https://www.rsc.org/images/entities/char_2009.gif) 2.0, corresponding to the 1st charge capacity ratio of N/P = 1.0–1.1, which is based on the K half-cell tests. Activated carbon electrodes consisting of 80 wt% activated carbon (YP50F, Kuraray), 10 wt% KB, and 10 wt% polytetrafluoroethylene (Daikin) were formed on Al expanded metal and dried at 200 °C under vacuum.26 The mass loading of activated carbon was > 10 mg cm−2, which ensured the excess capacity of the counter electrode.
2.0, corresponding to the 1st charge capacity ratio of N/P = 1.0–1.1, which is based on the K half-cell tests. Activated carbon electrodes consisting of 80 wt% activated carbon (YP50F, Kuraray), 10 wt% KB, and 10 wt% polytetrafluoroethylene (Daikin) were formed on Al expanded metal and dried at 200 °C under vacuum.26 The mass loading of activated carbon was > 10 mg cm−2, which ensured the excess capacity of the counter electrode.
Electrochemical characterization
Galvanostatic charge/discharge tests of graphite and the K2Mn[Fe(CN)6] electrodes were conducted using a three-electrode cell (SB9, EC FRONTIER, Fig. S1†). To evaluate the graphite electrodes, we used K2Mn[Fe(CN)6] or K metal as the counter electrode, and Ag/Ag+ as the reference electrode. The reference electrode was separated from the working and counter electrodes by a ceramic filter and consisted of a silver wire immersed in a 0.05 mol kg−1 AgSO3CF3/electrolyte solution (1 m K(PF6)0.75(FSA)0.25/EC/DEC).33 For evaluating K2Mn[Fe(CN)6] electrodes, we used activated carbon or K metal as the counter electrode and the same Ag/Ag+ reference. The electrode potential in the three-electrode tests was converted to the K+/K standard based on the experimentally determined K+/K potential (−3.797 V vs. Ag/Ag+). Galvanostatic charge/discharge tests of graphite‖K2Mn[Fe(CN)6] full cells and the graphite half cells were conducted in R2032 coin-type cells assembled with a glass fiber separator (GB100R, Advantec). Al-clad caps (Hohsen) were used for the coin-type cells to avoid corrosion of stainless steel.14,44GC-MS and LC-MS analysis
The GC-MS measurements were conducted using a GC-MS-QP2020 NX instrument (Shimadzu) employing a mid-polar column (SH-Rtx-200, 30 m × 0.25 mm × 0.25 μm). The samples were diluted to 1![[thin space (1/6-em)]](https://www.rsc.org/images/entities/char_2009.gif) :
:![[thin space (1/6-em)]](https://www.rsc.org/images/entities/char_2009.gif) 10 in acetonitrile, and 1 μL was injected at an injection port temperature of 280 °C with a split ratio of 1
10 in acetonitrile, and 1 μL was injected at an injection port temperature of 280 °C with a split ratio of 1![[thin space (1/6-em)]](https://www.rsc.org/images/entities/char_2009.gif) :
:![[thin space (1/6-em)]](https://www.rsc.org/images/entities/char_2009.gif) 50. He gas (G1 grade, >99.99995 vol%) was used as a carrier gas at a column flow of 1.16 mL min−1. The temperature program started at 40 °C and was held for 2 min. Afterward, the temperature was raised 7 °C min−1 until 100 °C was reached and then 12 °C min−1 to a temperature of 280 °C. The final temperature was held for 5 min. The mass range was 20–600 m/z and the event time of 0.3 s in scan mode. Ionization was performed by electron ionization (EI) or chemical ionization (CI) using isobutane gas (>99.9%).
50. He gas (G1 grade, >99.99995 vol%) was used as a carrier gas at a column flow of 1.16 mL min−1. The temperature program started at 40 °C and was held for 2 min. Afterward, the temperature was raised 7 °C min−1 until 100 °C was reached and then 12 °C min−1 to a temperature of 280 °C. The final temperature was held for 5 min. The mass range was 20–600 m/z and the event time of 0.3 s in scan mode. Ionization was performed by electron ionization (EI) or chemical ionization (CI) using isobutane gas (>99.9%).
The LC-MS measurements were conducted with an ultra-high performance liquid chromatography (UPLC) system using a C18 reverse-phase column (ACQUITY UPLC BEH C18, 1.7 μm, 2.1 × 150 mm, Waters) coupled to a Bruker compact electrospray ionization-quadrupole-time-of-flight mass spectrometer (ESI-Q-TOF, Bruker Daltonics). The UPLC was performed at 40 °C with a gradient (flow rate of 0.25 mL min−1) of solvent B (acetonitrile) in solvent A (10 mM ammonium acetate solution) as follows: 0% B for 3 min, 0% to 100% B in 20 min, 100% B for 7 min. The electrospray ionization (ESI) source conditions were set as follows: gas temperature of 200 °C, drying gas flow of 8 L min−1, nebulizer of 2.0 bar, and capillary voltage of 4500![[thin space (1/6-em)]](https://www.rsc.org/images/entities/char_2009.gif) V. Data analysis of the LC-QTOF-MS/MS was conducted with MetaboScape software (Bruker).
V. Data analysis of the LC-QTOF-MS/MS was conducted with MetaboScape software (Bruker).
Morphology and surface analysis
The morphology of the graphite electrodes was examined using a scanning electron microscope (SEM, 15 kV, JCM-6000, JEOL). Hard X-ray photoelectron spectroscopy (HAXPES) analysis of cycled graphite electrodes was conducted using high excitation energy of hard X-ray, 7939 eV, and a photoelectron energy analyzer of R4000 (Scienta Omicron) at BL46XU at SPring-8, Japan. The photoelectron detection angle and pass energy of the analyzer were 80° and 200 eV, respectively. Electrochemically tested graphite electrodes were carefully taken out from cycled coin cells, rinsed with 1,2-dimethoxyethane, dried at room temperature in an Ar-filled glovebox under ambient pressure, and transferred using a transfer vessel to avoid air exposure. The detailed setup and conditions of the HAXPES measurement are described in our previous works.41,45 The binding energy of the obtained spectrum was calibrated to the binding energy of sp2 carbon of graphite, 284.3 eV. Photoelectron peaks were deconvoluted using the peak-fit program, Fityk, with Pseudo-Voigt functions. The photoelectron intensity of every spectrum was corrected by relative sensitivity factors40 and normalized by the integrated intensity of the sp2 C peak at 284.3 eV to conduct a semi-quantitative analysis of the chemical species.Computational method
The oxidation and reduction stability was calculated using Gaussian 09, Revision D.01.46 The structure was optimized using DFT with the B3LYP functional and 6-31G+(d,p) basis set. We utilized the Polarizable Continuum Model with integral equation formalism variant (IEFPCM) and acetonitrile for the solvation model.34 To identify all stationary points as local minima, frequency analysis was performed using the same basis set. Free energies were computed within harmonic oscillator approximation for T = 298.15 K and P = 1 atm. The absolute adiabatic reduction and oxidation potential were calculated using the delta SCF method with zero-point corrections.47–49 The obtained values were converted to the SHE potential scale by subtracting 4.4 V.50 The complexation energies were calculated using the counterpoise method to correct the basis set superposition error (BSSE). For calculating complexation energies, only explicit solvent molecules were used; PCM was not incorporated.Conclusions
In this study, we investigated the impact of decomposition products from common electrolyte salts used in KIBs, including KPF6 and KFSA, on the electrochemical performance of K insertion materials. We found that KPF6/EC/DEC electrolytes significantly decomposed on K metal, producing a large amount of solvent degradation products, e.g. oligocarbonates. In contrast, KFSA/EC/DEC electrolytes suppressed oligocarbonate formation and predominantly produced FSA-derived products. Electrochemical measurements revealed that the oligocarbonates in K-KPF6 showed no notable effect on a graphite negative electrode, but strongly deteriorated the performance of a K2Mn[Fe(CN)6] positive electrode, leading to a large irreversible capacity. In contrast, the decomposition products in the K-KFSA electrolyte improved the coulombic efficiency of graphite with only minor effects on K2Mn[Fe(CN)6]. These results were consistent with DFT calculations that suggest subsequent reactions of the different decomposition products at each electrode. HAXPES measurements on cycled graphite electrodes further revealed an additional species within the SEI of the K metal-reacted electrolyte, attributed to highly polarized carbon species that should be related to the FSA-derived products. Ultimately, our work shows that decomposition products from reaction with K metal can strongly impact the cell performance through the generation of unique electrolyte species.Data availability
Detailed experimental and computational data, including all MS spectra, are included in the ESI.†Author contributions
T. H. proposed the concepts of the study. T. M. performed most of the experiments under the supervision of T. H., R. T., and S. K. T. H. performed the computational calculations and analyses. Analyses of the data included contributions by all authors. T. H. and T. M. wrote the original draft. T. H., Z. T. G., R. T., and S. K. reviewed and edited the manuscript. All authors have given approval to the final version of the manuscript.Conflicts of interest
There are no conflicts to declare.Acknowledgements
HAXPES measurements were performed at the BL46XU of SPring-8 as the Priority Research Proposal (priority field: Industrial Application) with the approval of the Japan Synchrotron Radiation Research Institute (JASRI) (Proposal No. 2018B1613). The authors thank Dr Satoshi Yasuno for the experimental assistance with the HAXPES measurements. Some of the LC-MS measurements were performed at the National Institute for Materials Science (NIMS) Battery Research Platform under the JST Grant Number JPMJPF2016. This study was partially funded by the Ministry of Education, Culture, Sports, Science and Technology (MEXT) Program: Data Creation and Utilization Type Materials Research and Development Project (JPMXP1121467561), the JST through the A-STEP program (Grant No. AS282S001d), CREST (Grant No. JPMJCR21O6), and JSPS KAKENHI (Grant No. JP18K14327, JP20J13077, JP20H02849, JP21K14724, JP21K20561, JP22K14772, and JP23K13829). RT acknowledges the TEPCO memorial foundation research grant (basic research).References
- T. Hosaka, K. Kubota, A. S. Hameed and S. Komaba, Chem. Rev., 2020, 120, 6358–6466 CrossRef CAS.
- X. Min, J. Xiao, M. Fang, W. A. Wang, Y. Zhao, Y. Liu, A. M. Abdelkader, K. Xi, R. V. Kumar and Z. Huang, Energy Environ. Sci., 2021, 14, 2186–2243 RSC.
- A. Eftekhari, Z. Jian and X. Ji, ACS Appl. Mater. Interfaces, 2017, 9, 4404–4419 CrossRef CAS.
- D. Larcher and J.-M. Tarascon, Nat. Chem., 2015, 7, 19–29 CrossRef CAS PubMed.
- E. J. Kim, P. R. Kumar, Z. T. Gossage, K. Kubota, T. Hosaka, R. Tatara and S. Komaba, Chem. Sci., 2022, 13, 6121–6158 RSC.
- P. R. Kumar, T. Hosaka, T. Shimamura, D. Igarashi and S. Komaba, ACS Appl. Energy Mater., 2022, 5, 13470–13479 CrossRef CAS.
- S. Imtiaz, N. Kapuria, I. S. Amiinu, A. Sankaran, S. Singh, H. Geaney, T. Kennedy and K. M. Ryan, Adv. Funct. Mater., 2022, 2209566 Search PubMed.
- W. Zhang, Y. Liu and Z. Guo, Sci. Adv., 2019, 5, eaav7412 CrossRef CAS PubMed.
- Z. T. Gossage, T. Hosaka, T. Matsuyama, R. Tatara and S. Komaba, J. Mater. Chem. A, 2023, 11, 914–925 RSC.
- Y. Mo, W. Zhou, K. Wang, K. Xiao, Y. Chen, Z. Wang, P. Tang, P. Xiao, Y. Gong and S. Chen, ACS Energy Lett., 2023, 8, 995–1002 CrossRef CAS.
- T. Hosaka, S. Muratsubaki, K. Kubota, H. Onuma and S. Komaba, J. Phys. Chem. Lett., 2019, 10, 3296–3300 CrossRef CAS PubMed.
- L. Madec, V. Gabaudan, G. Gachot, L. Stievano, L. Monconduit and H. Martinez, ACS Appl. Mater. Interfaces, 2018, 10, 34116–34122 CrossRef CAS PubMed.
- H. Wang, D. Zhai and F. Kang, Energy Environ. Sci., 2020, 13, 4583–4608 RSC.
- T. Hosaka, K. Kubota, H. Kojima and S. Komaba, Chem. Commun., 2018, 54, 8387–8390 RSC.
- H. Onuma, K. Kubota, S. Muratsubaki, T. Hosaka, R. Tatara, T. Yamamoto, K. Matsumoto, T. Nohira, R. Hagiwara, H. Oji, S. Yasuno and S. Komaba, ACS Energy Lett., 2020, 5, 2849–2857 CrossRef CAS.
- X. Wu, S. Qiu, Y. Liu, Y. Xu, Z. Jian, J. Yang, X. Ji and J. Liu, Adv. Mater., 2022, 34, 2106876 CrossRef CAS PubMed.
- T. Hosaka, T. Matsuyama, K. Kubota, S. Yasuno and S. Komaba, ACS Appl. Mater. Interfaces, 2020, 12, 34873–34881 CrossRef CAS PubMed.
- T. Hosaka and S. Komaba, Bull. Chem. Soc. Jpn., 2022, 95, 569–581 CrossRef CAS.
- L. Caracciolo, L. Madec, G. Gachot and H. Martinez, ACS Appl. Mater. Interfaces, 2021, 13, 57505–57513 CrossRef CAS PubMed.
- T. Hosaka, T. Fukabori, T. Matsuyama, R. Tatara, K. Kubota and S. Komaba, ACS Energy Lett., 2021, 6, 3643–3649 CrossRef CAS.
- S. Komaba, T. Hasegawa, M. Dahbi and K. Kubota, Electrochem. Commun., 2015, 60, 172–175 CrossRef CAS.
- Z. Jian, W. Luo and X. Ji, J. Am. Chem. Soc., 2015, 137, 11566–11569 CrossRef CAS PubMed.
- L. Xue, Y. Li, H. Gao, W. Zhou, X. Lü, W. Kaveevivitchai, A. Manthiram and J. B. Goodenough, J. Am. Chem. Soc., 2017, 139, 2164–2167 CrossRef CAS PubMed.
- X. Bie, K. Kubota, T. Hosaka, K. Chihara and S. Komaba, J. Mater. Chem. A, 2017, 5, 4325–4330 RSC.
- K. Hurlbutt, S. Wheeler, I. Capone and M. Pasta, Joule, 2018, 2, 1950–1960 CrossRef CAS.
- T. Hosaka, T. Fukabori, H. Kojima, K. Kubota and S. Komaba, ChemSusChem, 2021, 14, 1166–1175 CrossRef CAS PubMed.
- L. G. Xue, Y. T. Li, H. C. Gao, W. D. Zhou, X. J. Lu, W. Kaveevivitchai, A. Manthiram and J. B. Goodenough, J. Am. Chem. Soc., 2017, 139, 2164–2167 CrossRef CAS PubMed.
- G. He and L. F. Nazar, ACS Energy Lett., 2017, 2, 1122–1127 CrossRef CAS.
- C. Schultz, S. Vedder, B. Streipert, M. Winter and S. Nowak, RSC Adv., 2017, 7, 27853–27862 RSC.
- X. Zhang, P. Ross Jr, R. Kostecki, F. Kong, S. Sloop, J. Kerr, K. Striebel, E. Cairns and F. McLarnon, J. Electrochem. Soc., 2001, 148, A463 CrossRef CAS.
- J. Henschel, C. Peschel, S. Klein, F. Horsthemke, M. Winter and S. Nowak, Angew. Chem., Int. Ed. Engl., 2020, 59, 6128–6137 CrossRef CAS.
- C. Schultz, S. Vedder, M. Winter and S. Nowak, Anal. Chem., 2016, 88, 11160–11168 CrossRef CAS PubMed.
- H. Yang, C.-Y. Chen, J. Hwang, K. Kubota, K. Matsumoto and R. Hagiwara, ACS Appl. Mater. Interfaces, 2020, 12, 36168–36176 CrossRef CAS PubMed.
- J. Tomasi, B. Mennucci and R. Cammi, Chem. Rev., 2005, 105, 2999–3094 CrossRef CAS PubMed.
- O. Borodin, X. Ren, J. Vatamanu, A. von Wald Cresce, J. Knap and K. Xu, Acc. Chem. Res., 2017, 50, 2886–2894 CrossRef CAS PubMed.
- K. Sodeyama, Y. Yamada, K. Aikawa, A. Yamada and Y. Tateyama, J. Phys. Chem. C, 2014, 118, 14091–14097 CrossRef CAS.
- Y. Yamada, K. Furukawa, K. Sodeyama, K. Kikuchi, M. Yaegashi, Y. Tateyama and A. Yamada, J. Am. Chem. Soc., 2014, 136, 5039–5046 CrossRef CAS PubMed.
- K. Kobayashi, Nucl. Instrum. Methods Phys. Res., Sect. A, 2009, 601, 32–47 CrossRef CAS.
- N. Yabuuchi, Y. Matsuura, T. Ishikawa, S. Kuze, J.-Y. Son, Y.-T. Cui, H. Oji and S. Komaba, ChemElectroChem, 2014, 1, 580–589 CrossRef.
- S. Yasuno, S. Ishimaru and N. Ikeno, Surf. Interface Anal., 2018, 50, 1191–1194 CrossRef CAS.
- M. Dahbi, T. Nakano, N. Yabuuchi, S. Fujimura, K. Chihara, K. Kubota, J.-Y. Son, Y.-T. Cui, H. Oji and S. Komaba, ChemElectroChem, 2016, 3, 1856–1867 CrossRef CAS.
- T. Hosaka, T. Matsuyama, K. Kubota, R. Tatara and S. Komaba, J. Mater. Chem. A, 2020, 8, 23766–23771 RSC.
- D. Iermakova, R. Dugas, M. Palacín and A. Ponrouch, J. Electrochem. Soc., 2015, 162, A7060 CrossRef CAS.
- H. J. Kim, H. Yashiro, H. Kim, S. Lee and S.-T. Myung, J. Mater. Chem. A, 2019, 7, 26250–26260 RSC.
- N. Yabuuchi, K. Shimomura, Y. Shimbe, T. Ozeki, J.-Y. Son, H. Oji, Y. Katayama, T. Miura and S. Komaba, Adv. Energy Mater., 2011, 1, 759–765 CrossRef CAS.
- M. J. Frisch, G. W. Trucks, H. B. Schlegel, G. E. Scuseria, M. A. Robb, J. R. Cheeseman, G. Scalmani, V. Barone, G. A. Petersson, H. Nakatsuji, X. Li, M. Caricato, A. Marenich, J. Bloino, B. G. Janesko, R. Gomperts, B. Mennucci, H. P. Hratchian, J. V. Ortiz, A. F. Izmaylov, J. L. Sonnenberg, D. Williams-Young, F. Ding, F. Lipparini, F. Egidi, J. Goings, B. Peng, A. Petrone, T. Henderson, D. Ranasinghe, V. G. Zakrzewski, J. Gao, N. Rega, G. Zheng, W. Liang, M. Hada, M. Ehara, K. Toyota, R. Fukuda, J. Hasegawa, M. Ishida, T. Nakajima, Y. Honda, O. Kitao, H. Nakai, T. Vreven, K. Throssell, J. A. Montgomery Jr, J. E. Peralta, F. Ogliaro, M. Bearpark, J. J. Heyd, E. Brothers, K. N. Kudin, V. N. Staroverov, T. Keith, R. Kobayashi, J. Normand, K. Raghavachari, A. Rendell, J. C. Burant, S. S. Iyengar, J. Tomasi, M. Cossi, J. M. Millam, M. Klene, C. Adamo, R. Cammi, J. W. Ochterski, R. L. Martin, K. Morokuma, O. Farkas, J. B. Foresman and D. J. Fox, Gaussian 09, Revision D.01, 2009 Search PubMed.
- O. Borodin, M. Olguin, C. Spear, K. Leiter, J. Knap, G. Yushin, A. Childs and K. Xu, ECS Trans., 2015, 69, 113 CrossRef CAS.
- K. Ushirogata, K. Sodeyama, Y. Okuno and Y. Tateyama, J. Am. Chem. Soc., 2013, 135, 11967–11974 CrossRef CAS PubMed.
- M. V. Ivanov, D. Wang, D. Zhang, R. Rathore and S. A. Reid, Phys. Chem. Chem. Phys., 2018, 20, 25615–25622 RSC.
- S. Trasatti, Pure Appl. Chem., 1986, 58, 955–966 CrossRef CAS.
Footnote |
| † Electronic supplementary information (ESI) available. See DOI: https://doi.org/10.1039/d3sc02111d |
| This journal is © The Royal Society of Chemistry 2023 |

