 Open Access Article
The borderless world of chemical bonding across the van der Waals crust and the valence region†‡
Jorge
Echeverría
 a and
Santiago
Alvarez
 b
b
aInstituto de Síntesis Química y Catalisis Homogénea (ISQCH) and Departmento de Química Inorgánica, Facultad de Ciencias, Universidad de Zaragoza, Pedro Cerbuna 12, 50009 Zaragoza, Spain. E-mail: jorge.echeverria@unizar.es
bDepartment de Química Inorgànica i Orgànica, Secció de Química Inorgànica, e Institut de Química Teòrica i Computacional, Universitat de Barcelona, Martí i Franquès 1-11, 08028 –Barcelona, Spain. E-mail: santiago@qi.ub.es
First published on 6th July 2023
Abstract
The definition of the van der Waals crust as the spherical section between the atomic radius and the van der Waals radius of an element is discussed and a survey of the application of the penetration index between two interacting atoms in a wide variety of covalent, polar, coordinative or noncovalent bonding situations is presented. It is shown that this newly defined parameter permits the comparison of bonding between pairs of atoms in structural and computational studies independently of the atom sizes.
When any body exists in the elastic state, its ultimate particles are separated from each other to a much greater distance than in any other state; each particle occupies the centre of a comparatively large sphere, and supports its dignity by keeping all the rest, which by their gravity, or otherwise are disposed to encroach upon it, at a respectful distance.
John Dalton, A New System of Chemical Philosophy, Manchester, 1808.
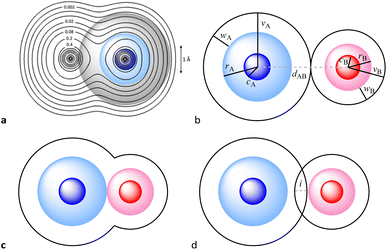
We, chemists, tend to idealize atoms as hard spheres that may exist independently or connected by sticks with other atoms to form molecules, chains or networks. The sizes of those spheres and the lengths of the sticks – the chemical bonds – are instrumental in describing and understanding the structure, stability and reactivity of chemical entities. In this work, we are concerned with a general way of describing and interpreting the distance between two such spheres, regardless of whether we connect them with a stick (chemical bond) or not (non-bonded atoms). To this end we first need to set up the conceptual description of an atom, based on the ideal spherical atom of Dalton and Bohr and on our current knowledge of the distribution of its electron density when isolated or within a chemically bonded polyatomic species. Even if we know that bonded atoms are not spherical,1,2 they can be reasonably considered as spheres that are slightly flattened along bond directions (Fig. 1a).
The first thing to notice is that the shape of an atom is defined by the envelope of its electron density. However, due to the exponential decay of the probability function of atomic orbitals with the distance to the nucleus, the border of an atom is not clearly defined and one must adopt a convention, such as admitting that the surface of an atom is a sphere that contains 99% of its electron probability density. Alternatively, one could consider the distance from the nucleus at which the electron density reaches a sufficiently small value (e.g., 0.001 e bohr−3, as proposed by Rahm and Hoffmann3) to define the radius of an atomic sphere.
For the present work, we find it appropriate to consider an atom as formed by three concentric spheres that contain regions of decreasing electron density. In such a model, the inner sphere corresponds to the high electron density associated with core electrons, the second sphere contains in addition the electron density corresponding to the valence electrons, and the outermost sphere also includes the low electron density characteristic of the van der Waals space. The sizes of those spheres can be defined by the core,4 covalent, and van der Waals radii, for which we use the symbols c, r, and v, respectively (Fig. 1b). These spheres correspond to well-defined regions of electron density, as can be seen in textbook representations1,5 and illustrated in Fig. 1a through the calculated electron density map for the Cl2 molecule (see the ESI‡ for computational details). From another point of view, the size of such spheres is associated with the radial extent of atomic orbitals, since in an atom with valence orbitals of quantum number n they contain the electrons of the shells with quantum numbers 1 to n − 1 (core sphere), n (valence sphere) and n + i (van der Waals region and beyond, with i ≥ 1).
In what follows we will employ the empirical sets of atomic covalent6 and van der Waals7,8 radii, based on crystallographic and spectroscopic gas phase structural data, proposed in recent years by us, which have been widely applied by the chemical community. The relationships of atomic radii with other parameters, such as the electrostatic potential felt by a valence electron, a constant value of the electron density, or atomic softness or atomic polarizability, have been extensively reviewed.3,9
When two atoms are involved in a bonding interaction, the outermost spheres of electron density interpenetrate to a greater or lesser extent depending on the strength of the interaction. The two canonical cases of covalent bonding and van der Waals interactions, corresponding to interatomic distances dAB = rA + rB and dAB = vA + vB, respectively, are schematically represented in Fig. 1b and c, respectively. If we refer to the section of the van der Waals sphere external to the valence sphere (the transparent portion in Fig. 1b–d) as the van der Waals crust, its width is defined as w = v − r.10,11 It is thus straightforward to calculate those widths for most chemical elements (Fig. 2a; data in Table S1 of the ESI‡).
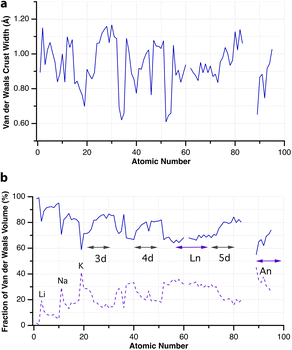 | ||
| Fig. 2 (a) Widths of the van der Waals crusts for the first 95 elements. (b) The portion of the van der Waals sphere occupied by the van der Waals crust and by the valence sphere (dashed line). Data are provided in ESI, Table S1.‡ | ||
Although there seems to be no clear periodic trend in crust widths, it is interesting to note that all of them fall between 0.60 and 1.20 Å, the large majority being between 0.80 and 1.10 Å. The portion of the volume of the van der Waals sphere that is occupied by the crust can be easily calculated (see Appendix in the ESI‡). Those volume fractions are presented in Fig. 2b, where we can see that for practically all naturally occurring elements the crust represents at least 60% of the volume of the van der Waals sphere, being higher than 90% for the lightest elements H, He and B to Ne. The element with the narrowest crust within each period is the alkali metal, whereas the widest crusts correspond to noble gases and late transition metals. It can also be seen that the proportion of the van der Waals crust appears to be roughly constant for the whole family of lanthanides.
Now we can face the aim of this work, to adopt a general parameter that describes the degree of interpenetration of the van der Waals and valence spheres of two atoms and check for its applicability to a variety of chemical systems, from the weakly interacting van der Waals diatoms held by London dispersion forces to the strongest multiple covalent bonds. Earlier attempts to normalize an interatomic distance dAB by comparing it with the sum of the van der Waals radii include the proposal of Lommerse and co-workers12 of using the quotient of the distance over the van der Waals radii sum, λ = dAB/(νA + νB). It adopts values smaller than one for distances shorter (and larger than one for distances longer) than the van der Waals sum. In other cases, the “corrected” or “relative” E⋯H distance, dAB − (vA + vB), has been used, e.g., to compare the hydrogen contacts of a group 14 element13 or in the study of π-hole interactions between nitro aromatic ligands and lone pairs within protein structures.14 Those corrected distances are negative for contacts shorter than the van der Waals radii sum and positive for longer contacts, but it does not seem that they can be used for the comparison of interactions involving different atom pairs or for stronger interactions such as covalent bonds.
We propose instead to explore the applicability of our definition10 of a penetration index to a wide variety of types of interatomic interactions. In short, the penetration index between atoms A and B is the ratio between the interpenetration of the two van der Waals crusts, i = vA + vB − dAB (see Fig. 1d) and the sum of the crust widths (eqn (1)). The introduction of a 100 factor results in the penetration index adopting values of 0% when the two van der Waals spheres are just touching each other (i.e., dAB = νA + νB) and 100% when they are interpenetrating up to the point where the two valence spheres touch each other (i.e., dAB = rA + rB), the two situations shown schematically in Fig. 1b and c.
| pAB = 100·(vA + vB − dAB)/(vA + vB − rA − rB) | (1) |
With such a definition, any combination of two elements at a distance equal to the sum of the covalent radii is represented by a 100% penetration, whereas all the atom pairs at a distance equal to the sum of their van der Waals radii consistently have a 0% penetration index. In other words, we have a metric that is independent of the size of the interacting atoms. Of course, given the variability of the covalent bond lengths involving the same atom pair, we must expect that values of around zero correspond to van der Waals interactions and values of approximately 100 correspond to a covalent single bond.
In many instances of weak, non-covalent, secondary bonding or non-bonding interactions, however, the interatomic distance is somewhere in-between the sum of the covalent and the van der Waals radii sums, rA + rB < dAB < vA + vB (Fig. 1d). For those situations, we have a quantitative measure of the degree of interpenetration, which might calibrate the strength of such interactions, as we will extensively analyse in this work. This will greatly facilitate a wider and simpler perspective on many aspects of chemistry in which two-atom interactions are important, such as bonding, transition states and reaction mechanisms, non-covalent interactions and crystal engineering, ligand–protein interactions, or structural correlations.
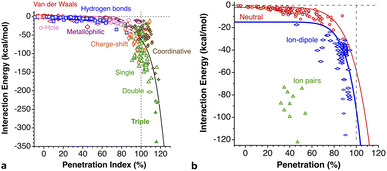
Notice that a negative value of pAB indicates that fuzzy van der Waals spheres are conventionally not interpenetrated, although a rather weak attractive interaction cannot be ruled out. In addition, the absolute value of a negative penetration index provides a qualitative description of the interaction as probably weakly attractive (small negative values) or as non-interacting or repulsive (large negative values). Conversely, values of pAB larger than 100% indicate covalent or ionic bonding and provide a qualitative indication of the strength of the bond, including differentiation of single and multiple bonds, as will be shown below. In summary, the values of the penetration index are intended to provide semiquantitative information about interactions within van der Waals crust regions but could also be used as a semiquantitative indicator beyond the limits of 0 and 100%.
Beyond p = 100%, the interpenetration of the valence shells of the two atoms occurs, and one could also define the corresponding index for the interpenetration of the valence shells, using the radii of the atomic cores4cA and cB (eqn (2)). That index takes the value pval = 0% when the interatomic distance is equal to the sum of the covalent radii, and. pval = 100% when the two atomic cores are in contact. For the common case of two interacting atoms with different crust widths, the degree of penetration of the crust of an atom A by a wider crust of an atom B, pB, is larger than the penetration of the crust of B by that of A, pA. For the interest of the reader, such individual penetration indices are discussed in an Appendix included in the ESI.‡ However, since the use of the joint index pAB is simpler and powerful enough, as will be shown in what follows, we will use only the latter throughout this paper. Similarly, the possibility of using a volumetric interpenetration measure is analysed in the ESI, Appendix‡ but will not be further pursued in this work.
| pval = 100·(rA + rB − dAB)/(cA + cB) | (2) |
van der Waals complexes involving noble gases
Noble gas dimers
We start looking at the prototypes of van der Waals interactions, the noble gases that form weakly bound diatoms, but for which a great deal of chemistry involving other types of bonding has also been developed15 since the pioneering work of Neil Bartlett.16 For this purpose, we have performed DFT calculations in a range of interatomic Ng⋯Ng distances (we will use the symbol Ng to represent any noble gas throughout) and performed energy decomposition analyses (EDA). To work with penetration indices instead of interatomic distances we must use a modified version of the Lennard-Jones potential, in which the distance is replaced by 100 − p (eqn (3)), where ε and σ correspond to the depth of the potential well at the minimum and to the value of 100 − p at which the energy crosses the zero line (i.e., p0 = 100 − σ, the penetration counterpart of the spinoidal radius discussed by Lobato et al.17), respectively, and n is a fitting parameter that in the common Lennard-Jones formulation would adopt a value of 6. By equating to zero the derivative of the energy with respect to p, the expression in eqn (4) gives us the penetration index at the minimum, pmin. | (3) |
 | (4) |
The calculated energy curves are shown in Fig. 3 and the relevant fitting parameters are presented in Table 1. The fittings do not reproduce very well the high energy branch beyond p0, which is nevertheless irrelevant for the present discussion, since the zone around the minimum and the pre-dissociation region are well reproduced. Several observations can be made based on those results:
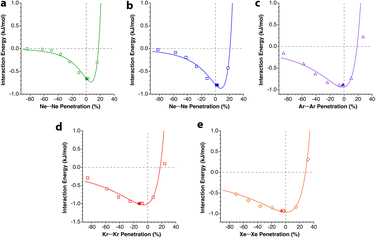 | ||
| Fig. 3 Interaction energy of Ng2 adducts represented as a function of the penetration index for He to Xe. The solid symbols correspond to the optimized Ng–Ng distance. Data are provided in ESI, Tables S2–S6.‡ | ||
| ε | σ | n | p min (%) | p opt (%) | χ 2 | p 0 | |
|---|---|---|---|---|---|---|---|
| a Points with p > 20% were excluded from the fitting. b Parameter that measures the goodness of fit. | |||||||
| HeHe | 0.733 | 82.56 | 5.7034 | 6.77 | 0.40 | 0.016 | 17.44 |
| NeNe | 0.871 | 79.32 | 4.5673 | 7.68 | 1.97(3.3)20 | 0.018 | 20.68 |
| ArAr | 0.942 | 81.51 | 3.0725 | −2.14 | −1.99(6.6)21,22 | 0.029 | 18.49 |
| KrKr | 1.028 | 82.35 | 2.7177 | −6.27 | −12.37(6.8)23 | 0.025 | 17.65 |
| XeXe | 0.963 | 71.72 | 2.1109 | 0.40 | −6.03 | 0.026 | 28.28 |
(a) All the interaction energies are similar, between −0.7 and −1.1 kJ mol−1, with an average of −0.91 (9) kJ mol−1.
(b) In all cases, penetrations at the energy minimum, pmin, are around 0%, between −6.2 and 7.5%, consistent with the expectations for purely van der Waals interactions.
(c) The width of the potential energy well increases as we go down the group, as indicated using the decreasing value of n (see Tables S2–S6, ESI‡). This fact should be reflected in the stretching force constant and, consequently, in the wavenumber of the signal in the Raman spectra.
(d) The penetration index of the optimized molecules is well correlated with the value obtained from the fitting of the energy scan to the Lennard-Jones potential. The linear correlation found is shown in eqn (5).
| popt = 1.0264 × pmin − 5.6574 (r2 = 0.97) | (5) |
High-level calculations place the minimal energy for the He2 dimer at 2.96 Å,18i.e., a penetration index of −4.3%. Some dispersion, of a few percent units, is not unexpected, due to small dissociation energies and shallow potential wells. Calculations reported by other authors19 consistently yield minima with penetrations between −7 and +5% for the dimers of He, Ne and Ar, as well as for the mixed diatomics HeNe, HeAr, and NeAr.
The penetration dependence of the different contributions to the interaction energy in the Ng2 dimers, according to an energy decomposition analysis (EDA), is presented in Fig. 4. It is rewarding to find very similar patterns for the five noble gas dimers analyzed, which can be summarized as follows:
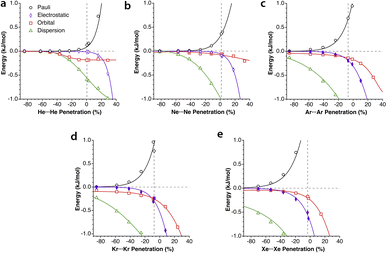 | ||
| Fig. 4 Evolution of the components of the interaction energy as a function of the penetration index for noble gas dimers. The vertical dashed lines indicate the position of the energy minima. Data are provided in ESI, Tables S2–S6.‡ | ||
1.- The orbital and dispersion attractive interaction terms operate at penetrations of about −30% or less, at which the electrostatic and Pauli components are still negligible.
2.- At penetrations near the energy minimum the London dispersion is the predominant attractive force in all cases.
3.- Further penetration is prevented by a rocketing increase in the Pauli repulsion energy.
4.-The Pauli repulsion appears at lower penetrations than the electrostatic attraction.
5.- The absolute values of the Pauli repulsion and the electrostatic attraction follow a similar exponential dependence on the penetration index, and they are nicely correlated (Fig. 5a and b).
 | ||
| Fig. 5 (a) Electrostatic and Pauli components as a function of the penetration index for all the Ng2 adducts. (b) Correlation between the electrostatic and Pauli components for each Ng2 dimer. (c) The sum of the Pauli and electrostatic components as a function of the penetration index for all the Ng2 dimers. The horizontal straight segment indicates the range in which the dimers are stable toward dissociation. Data are provided in ESI, Tables S2–S6.‡ | ||
6.- As a result of the two previous points, the electrostatic term cannot by itself stabilize the dimers of the two neutral Ng atoms.
7.- The combined effect of the Pauli and electrostatic terms shows an exponential dependence on the penetration index, roughly independent of the noble gas considered (Fig. 5c), preventing the dimers from reaching penetrations higher than a few percentual units.
8.- Point 7 implies that the electronegativity or size of the noble gas atoms is practically irrelevant in determining the degree of interpenetration of the Ng2 dimers.
After having seen how the penetration index allows us to calibrate on the same scale the van der Waals interactions in a computational study of the dimers of the noble gases, we turn our attention to the experimental information by analysing all the structures that contain only noble gases, either in the gas phase (as found in the Mogadoc database)24 or in the solid state, retrieved from the ICSD.25 The ranges of penetration indices found are summarized in Fig. 6, while numerical data and references are provided in the ESI (Table S7).‡ Experimental interatomic distances for the He2 and Xe2 complexes could not be found in the Mogadoc database but could be retrieved from the literature.26,27 The dimers of the fleeting noble gases Rn and Og have been computationally studied,28 and the results considered by the authors to be the best ones give interatomic distances of 4.42 and 4.28 Å. Since no reliable empirical van der Waals radii are available for these two elements,6,24 their penetration indices in the optimized dimers can be taken as 0%, assuming the corresponding radii to be half of the optimized interatomic distances (i.e., 2.21 and 2.14 Å).
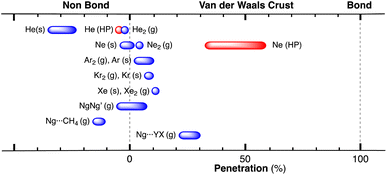 | ||
| Fig. 6 Ranges of penetration indices found for pairs of noble gas atoms in the gas and solid states. Blue bars correspond to structures at atmospheric pressure, and red bars to structures under pressure. Ng stands for noble gases in general, and X and Y for halogens (data provided in Table S7 in the ESI‡). | ||
The ranges of experimental Ng⋯Ng penetrations in the dimers are consistent with the values found computationally, around the 0% mark. Since the van der Waals radii of noble gases used for the calculation of penetration indices7 were obtained from the more abundant Ng⋯O distances rather than from Ng⋯Ng distances, it is understandable that the experimental values of the latter yield penetration values that are not strictly zero. However, the small positive or negative values found are consistent with the existence of predominant van der Waals interactions. It is remarkable that also the mixed noble gas adducts, Ng⋯Ng′, appear grouped around the zero mark with small positive or negative values. For comparison, we also include the penetrations of noble gases with methane in Fig. 6, which appear to be smaller than the noble gas-noble gas ones, as well as those of noble gases with halogen and interhalogen diatomic molecules XY, whose values are all above 20%, suggesting that important polarization effects supplement the dispersion attractive interaction. It is also noteworthy that the Ng⋯Ng penetrations in the solid state are in general smaller than those in the gas phase dimers, most likely due to the higher number of nearest-neighbors in the crystal structures.
Effect of pressure on noble gas⋯noble gas interpenetration
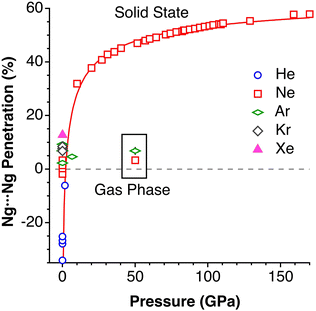
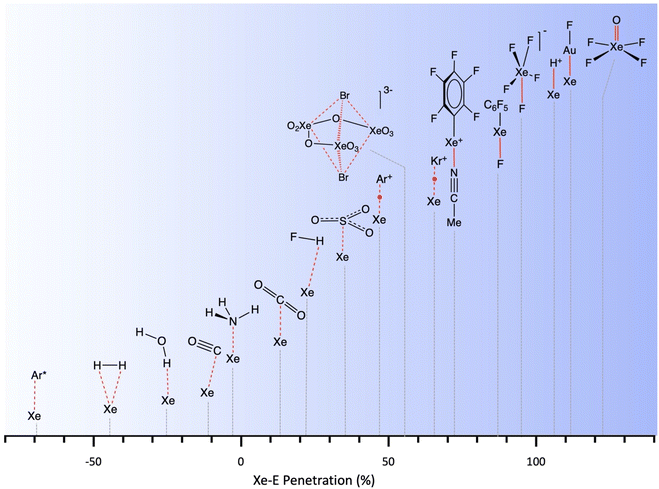
Experimental data involving He atoms in the solid state under pressure present nearest-neighbour penetrations that go from −34 to −25% as the pressure increases from 3 to 18 MPa and increase to −6% at a much higher pressure of 1.7 GPa.29 The Ne2 dimer in the gas-phase20 has a penetration index of 3.3%, and similar penetration values (−1.8 to 1.4%) appear between the nearest neighbours in the solid state structure at atmospheric pressure.30–32 Under high pressure (10–170 GPa),33,34 however, there is a sharp increase in the Ne⋯Ne interpenetration, reaching indices in the range of 30–60% (Fig. 7). The heavier elements present increasing penetrations as the atomic number increases, as expected for dispersion-dominated interactions. Recent calculations on Ng2 and NgNg′ dimers (Ng = Ne–Xe)35 give somewhat shorter distances and small positive penetrations (1–11%).Noble gas–molecule interactions
Another group of typically weak van der Waals interactions appears between noble gases and closed-shell molecules, such as methane. In the Ar⋯CH4 adduct, for instance, the argon atom sits at the centre of a face of the tetrahedral methane molecule, with a negative penetration of the Ar and C atoms (−15.3%) and still more negative penetration for the Ar⋯H contacts (−36.0%). A similar behaviour is found for methane adducts with Kr and Xe. In summary, van der Waals complexes of noble gases with a small nonpolar molecule such as methane present negative pNgC indices, between −11 and −15 (Ng = Ar, Kr, Xe) and smaller penetrations with H atoms, except for Xe that forms a Xe⋯H–C angle of 132°. If methane is replaced by difluoromethane,36 the presence of a dipole moment makes the interaction with the noble gas more favourable, and slightly positive Ng⋯F penetration indices appear (8–10%). Also, the dipolar character of the interhalogen molecules Y–X, where Y is the less electronegative halogen of the molecule, results in significantly higher Ng⋯Y penetrations (between 21 and 30% for Ng = Kr, Y–X = Cl–F; Ng = Ar, YX = Cl–F, Br–Cl and I–Cl). It seems clear that, in this case, we can think about σ-hole interactions. Another interesting molecule that has positive penetration indices with noble gases (Ar and Kr) is SiF4. Even if it doesn't have dipolar character, the polar nature of the Si–F bonds allows for σ-hole interactions through the centre of a tetrahedral face and Ng⋯Si penetration indices of around 17%.A study of the structure of 4-cyanophenol using helium as a pressure-transmitting medium has been reported,37 and two phase transitions have been found at 2.4 and 3.6 GPa. The authors analysed the effect of applied pressure on the hydrogen bonding and π–π stacking interactions that determine the crystal packing at atmospheric pressure.38 They observed that the π–π interactions are much more affected by pressure than the hydrogen bonding interactions. Taking the shortest non bonding C⋯C and N⋯O distances as an indication of the π–π and hydrogen bonding interactions, respectively, conveniently converted into the corresponding penetration indices (Fig. 8a), we see that this assertion holds for the intermediate pressure regime, in which the hydrogen-bonded N⋯O penetration increases in a practically linear way, while the C⋯C (π–π) interactions increase almost exponentially. In the high-pressure zone, however, the two interactions evolve in parallel, reaching penetrations as high as ∼40%.
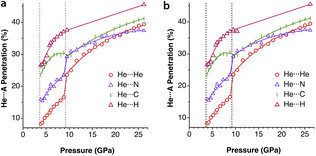 | ||
| Fig. 8 Changes in the penetration indices of (a) the C⋯C (π–π) and N⋯O (hydrogen-bonded) contacts and (b) several He⋯atom contacts with applied pressure in the crystal structure of 4-cyanophenol. The dotted vertical lines indicate two phase transitions. Penetration indices calculated from the structural data in ref. 37 and standard covalent6 and van der Waals radii.7 Data are provided in ESI, Table S8.‡ | ||
A most interesting result is that the compound incorporates He atoms in-between the molecules at a pressure of 2.4 GPa and above, in increasing proportions as the pressure increases. Thus, after a first phase transition at 2.68 GPa, He⋯H, He⋯N and He⋯O contacts with penetration indices in the range of 13–25% appear. At pressures higher than 3.4 GPa, the pressure-transmitting He atoms are incorporated within the crystal structure and penetrate the van der Waals crust of the C and H atoms (Fig. 8b). Above 9 GPa there is another phase transition that implies a leap in the He⋯N and He⋯He penetrations and, from there on, He⋯He, He⋯C, He⋯N and He⋯H penetrations increase at the same pace with increasing pressure. He and H atoms seem to interpenetrate more than the other atom pairs, although this conclusion should be taken with a grain of salt, given the usual uncertainty associated with the localization of hydrogen atoms from X-ray diffraction data and the disorder that affects the He atoms in that pressure range. The quite similar degree of interpenetration of different atom pairs, and the fact that they increase similarly with the applied pressure, suggests that at this point the whole crystal could be described as a close packing of fluffy spheres of different sizes, compressed in similar proportions.
Notice that in the O–H⋯N hydrogen bond there is interpenetration of not only the H and N crusts (70%) but also the O crust that extends beyond the hydrogen atom and interpenetrates 37% with the N crust, as can be appreciated in Fig. 9a. Similarly, the interpenetration of the He and aromatic C atoms becomes large at high pressures (Fig. 9b). The finding of the H-mediated interpenetration of the hydrogen-bonded oxygen and nitrogen atoms is consistent with our earlier orbital analysis of the superexchange interaction between two square planar Cu(II) ions in hydrogen-bond bridged Cu(II) dimers, which was found to be due to direct through–space interaction between the oxygen atoms of the two monomers, whereas the hydrogen bridges play essentially an indirect structural role by holding those oxygens at a close distance.39 Although to a lesser extent, this phenomenon also appears at ambient pressure, with H⋯N and O⋯N penetration indices of 50–55% and 19–20%, respectively, in several structural determinations at different temperatures and using diffractometers or synchrotron radiation.37,38,40,41 Search for all O–H⋯N hydrogen bonds in the Cambridge Structural Database (see the Methodology section) shows this to be a typical behaviour since the average penetrations with their standard deviations are 47(7)% for the H⋯N and 18(6)% for the O⋯N pair. Similarly, in O–H⋯O hydrogen bonds the H⋯O and O⋯O penetrations are 42(8) and 13(6)%, respectively.
 | ||
| Fig. 9 van der Waals (transparent spheres) and valence (solid spheres) domains of the atoms in (a) the O–H⋯N hydrogen bond, and (b) interpenetration of the van der Waals crust of a He atom (transparent sphere) with that of the carbon atoms (black spheres) for the shortest He⋯π contact of p-cyanophenol as determined by synchrotron X-ray diffraction at 26.19 GPa (drawn from the structural data in ref. 37 and standard covalent6 and van der Waals radii7). | ||
Clathrates
Among the many clathrates that host noble gas atoms, we focus on a couple of illustrative examples. One of them, Ar(D2O)3, has been structurally analysed by neutron diffraction at 920 MPa.42 In that structure, two Ar atoms are nearby (3.247 Å, pArAr = 36.0%) within a polyhedron formed by hydrogen-bonded water molecules, and Ar⋯O contacts at 2.164 Å indicate a surprisingly high degree of interpenetration of the corresponding crusts, pArO = 74.2%.In the clathrate that forms hydroxiquinone with Xe at atmospheric pressure, the noble gas atom establishes contacts with 6 surrounding molecules through one of the hydroxyl groups and the orto C–H bonds, the highest penetration corresponding to the Xe⋯C atom pairs (3.7%), followed by the Xe⋯O pair (−1.9%) and smaller Xe⋯H penetrations (between −3.6 and −10.8%).44
The existence of endohedral fullerenes with a noble gas atom enclathrated within a C60 molecule, Ng@C60 (Ng = He, Ne, Kr)45–47 has sparked much debate about the existence or absence of host–guest bonding. Merino and co-workers, for instance, carried out a computational study of different noble gases in C60, dodecahedrane and cubane.43 The use of penetration indices allows us to compare the noble gas–cage interaction energies for atoms of different sizes (Fig. 10). We note in passing that the penetration indices of the calculated structures are very similar to those found in the experimental structures of the clathrates Ng@C60 (Ng = He, Ne, Kr).45–47
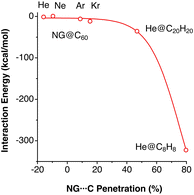 | ||
| Fig. 10 Interaction energies of noble gas atoms with their carbon cages in endohedral fullerenes and polyhedranes plotted as a function of the Ng–C penetration indices. Data adapted from ref. 43 (ESI, Table S8‡). | ||
A study carried out by Schwerdtfeger and co-workers reported calculations for a noble gas (He, Ne, and Ar) atom within Cn fullerenes, n being an even number from 20 to 60.48 In a related computational experiment, Merino et al. introduced two He atoms inside a dodecahedrane molecule,50 whereupon the He–He distance shortens to 1.265 Å, for a high penetration index of 69%, similar to the degree of interpenetration achieved experimentally between Ne atoms in the solid state under high pressure. In summary, while the contacts between noble gas atoms typically have penetration indices of around 0%, characteristic of dispersion interactions, their penetration with the cage atoms in clathrates can reach high values, most likely through donor–acceptor interactions with π* orbitals of the host. The representation of the calculated interaction energies as a function of the Ng⋯C penetration index (Fig. 11a) shows a similar behaviour of the three noble gases, to be compared with the large differences observed when the interaction energy is plotted as a function of the interatomic distance (Fig. 11b).
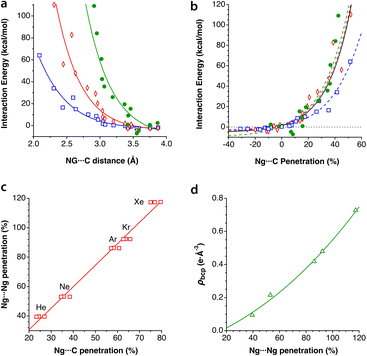 | ||
| Fig. 11 The interaction energy between fullerenes C20–C60 and an enclathrated noble gas atom as a function of (a) the Ng⋯C penetration index and (b) the Ng⋯C distance. Data were adapted from Schwerdtfeger et al.48 (see ESI, Table S9‡). (c) Relationship between the Ng⋯Ng and Ng⋯C penetrations in Ng2@C60, and (d) dependence of the electron density at the Ng⋯Ng bond critical point on the penetration index, elaborated from data published by Krapp and Fenking.49 | ||
Krapp and Frenking computationally introduced two noble gas atoms in a buckminsterfullerene cage, Ng2@C60, with the Ng2 pairs in three different orientations relative to the symmetry axes of the cage.49 We refer to the original paper for a detailed discussion of the nature of the Ng⋯Ng and Ng⋯C interactions, but focus here on how the penetration indices of those two interactions show an excellent linear correlation (Fig. 11c), with the Ng⋯Ng penetrations almost doubling the Ng⋯C ones. Moreover, the fact that the penetrations become much larger than expected as the atomic size of the noble gas increases, largely exceeding 100% in the case of Xe, indicates that those atoms are mechanically kept at very short distances by the fullerene. It also makes us think about what changes must appear in the electronic structures of host and guest to allow the two Ng atoms to get so close to each other. Maybe an electron transfer to form covalently bonded Ng2+ or Ng22+ cations (the Kr2+ cation in the gas phase,51 for instance, has a penetration index of 80%) and the well characterized C60− or C602− fullerides?52 An attempt to find a similar relationship using the interatomic Ng⋯Ng and Ng⋯C distances leads to a completely uncorrelated set of points (see ESI, Fig. S1a‡).
The Ng⋯Ng force constants present the well known correlation with the interatomic distances, known as Badger's rule53 (Fig. S1b‡) and, interestingly, a simpler, linear correlation can be found between the force constants and the penetration indices (Fig. S1c‡). Also the electron density at the Ng⋯Ng bond critical points found by Krapp and Frenking is nicely correlated with the penetration index (Fig. 11d), whereas a poorer correlation is found with the interatomic distances (Fig. S1d in the ESI‡).
A related study on up to six noble gas atoms within carbon, boron or water clathrates or within BN doped carbon nanotubes has been reported by Merino, Chattaraj and coworkers.54
Tip–molecule interaction in electron probe microscopy
In the field of atomic probe microscopy, progress is continuously being made in obtaining images of electron density on small molecular regions while, at the same time, studies of electron transfer between the microscope's tip and a single molecule are of great importance for the development of molecular electronics. In this context, Mallada et al. recently reported55 images of a σ-hole in the electron density of C(p-PhX)4 (X = F, Br) on an Ag(111) surface using Kelvin probe force microscopy with Xe and CO tips. They computationally analysed the interaction between the tip and a halogen atom of the adsorbed molecules and found interaction energy vs. tip height curves in good agreement with the experimental observations.To see how the use of penetration indices could be used in such a case, we plot in Fig. 12 the interaction energies between XPh molecules (X = F, Br) and a model of a Xe-terminated KFPM tip calculated by Mallada et al.55 as a function of the Xe⋯X penetration index. The calculated data can be fitted to a modified Lennard-Jones expression described above (eqn (3)), as shown in Fig. 12. We find it remarkable that the energy minimum for the tip-halogen atom interaction appears at practically the same degree of Xe⋯X penetration for the two halogens studied.
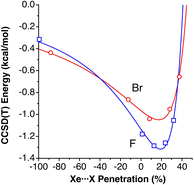 | ||
| Fig. 12 Interaction energies between XPh molecules (X = F, Br) and a model of a Xe-terminated KFPM tip calculated by Mallada et al.,55 represented as a function of the Xe⋯X penetration index. The curves are fittings to a modified Lennard-Jones potential (eqn (3)). Fitting parameters: σ = 59.0942, ε = 1.3153 and n = 2.1968 for X = F and σ = 55.498, ε = 1.0480, and n = 1.7367 for X = Br. Data are provided in ESI, Table S10.‡ | ||
Inter-layer interactions in 2D solids
The weak van der Waals forces between layers in 2D solids are responsible at the same time for their crystallinity and their exfoliability. If the interlayer interactions depend on the same type of forces as for the noble gases discussed above, we should expect the ranges of penetration indices in layered solids to be similar to those found for noble gases.Intercalated graphites
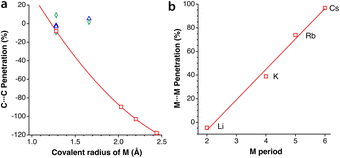
Intercalation and deintercalation of alkaline ions between the layers of graphite are processes of enormous importance due to their applicability as electrodes for batteries.56,57 In the structure of naked graphite, the separation between the closest carbon atoms in neighbouring layers is 3.645 Å,58 or a penetration index of −5%, consistent with the existence of weak van der Waals forces that account for the easy exfoliation of this material. When the metal content is low, as in LiC12,59 LiC18,60 or NaC64,61 intercalated and unintercalated layers alternate, and two different interlayer distances must be considered. In those cases, both the unintercalated and intercalated layers present C⋯C penetrations similar to those in pristine graphite, of around 0%. In alkali-intercalated graphite with high metal content, as in LiC6,59 KC8,62 RbC8,63 and CsC8,63 all layers are intercalated and the interlayer distance is most likely determined by the size of the alkaline metal. The different behaviour of the two families of intercalated graphites is shown in Fig. 13a, where we also observe an excellent correlation between the covalent radius of the metal atom and the interlayer C⋯C penetration, with the paradoxical result that for LiC6 the interlayer penetration is similar to that between unintercalated or poorly intercalated graphite layers.An additional interesting result of the penetration analysis of the structures of intercalated graphites is that the intralayer penetration between the metal atoms in the compounds with high metal contents (i.e., LiC6, KC8, RbC8, and CsC8) increases in a practical linear way as we go down the group of alkaline metals, presenting an excellent correlation with the atomic number and with the period of the alkaline metal (Fig. 13b). Additionally, we notice that the H⋯H penetration indices between two layers of graphane, obtained from the structure optimized by Janowsky and Pulay,64 are around −10% for the shortest contacts, slightly more negative than that for the C⋯C contacts between two layers of graphite.
Layered AX2 and AX3 solids
We have analysed a sample of 74 structures of binary 2D solids with AX2 and AX3 stoichiometries (X = Cl, Br, I, O, S, Se, Te), including 10 different structural types (CdCl2, CdI2, NbS2, MoS2, TaSe2, WTe2, graphite, RhBr3, BiI3, and NbS3). The penetration indices for the shortest X⋯X contacts of each crystal structure are distributed around −3% (Fig. 14), covering a range between −25 and 25%, regardless of the structural type and the nature of the cations and anions (A and X), similar to the behaviour found for the noble gas dimers (Fig. 7), but covering a wider range of values as could be expected for a much larger sample set and a wider variety of chemical compositions.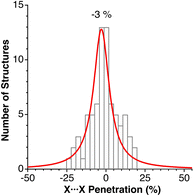 | ||
| Fig. 14 Histogram and Lorentzian fitting of the distribution of the shortest interlayer penetrations in a sample of 2D solids. Data are provided in ESI, Table S11.‡ | ||
Rydberg molecules
An atom that holds an electron in an atomic orbital with a higher principal quantum number n than the valence shell is called a Rydberg atom. Similarly, a molecule with an electron in an outer shell is termed a Rydberg molecule. Such Rydberg states can engage in weakly attractive interactions with atoms, ions, or molecules. Presently, there is much interest in ultralong range Rydberg molecules that can be obtained in ultracold gases, generating via laser irradiation Rydberg states that may form bonds at distances in the range 3–9 μm (i.e., one thousand times longer than typical bond distances), with lifetimes of the order of tens of μs. For instance, Rb(5s1)–Rb(ns1) “macrodimers” formed by a ground state atom and a Rydberg atom with n = 35–37 have been reported, with lifetimes of 15–18 μs.65,66 Also a bond between an Rb ion and a Rydberg Rb atom, predicted in 2000,67 has been detected recently.68 Certainly, those interactions do not imply interpenetration of van der Waals crusts, but many Rydberg molecules studied earlier imply lower-lying excited states and indeed form within the van der Waals playground.Attachment of an electron to an ammonium ion results in a neutral Rydberg molecule NH4, and a second electron gives rise to a double-Rydberg (DR) molecule NH4−,69 since two electrons are found in a Rydberg-like orbital that is distributed in the periphery of a closed-shell ammonium cation.69 Interestingly, in this (and other) Rydberg and DR molecules chemical bonds seem to be not significantly affected, and the penetration of the N and H crusts in NH4 and NH4− is 99%, compared to that in the ammonium cation, e.g., 100% in the solid state structure of (ND4)F determined by neutron diffraction,70 and similarly for the independent cation in the gas phase.71 However, the DR structure is a local minimum unstable toward dissociation into ammonia and hydride,72 with an activation energy of around 14 kcal mol−1 needed to separate one of the hydrogen atoms to a penetration index of 57%. Similar considerations apply to the H3O Rydberg molecule and the DR H3O− anion derived from the hydronium cation.69
Two Rydberg molecules may use their Rydberg electrons to form a two-electron chemical bond, as shown computationally by Boldyrev and Simons for the case of dimers of NH4.74 Although those dimers are unstable toward dissociation into 2NH3 + H2, they are local minima with small energy barriers. Given their Rydberg nature, there is no need for a high interpenetration of the van der Waals crusts, yet, in the case of the D3d dimer with a single short H⋯H contact (2.354 Å), the penetration index pHH is 3%, within the range of values found for pure van der Waals interactions (Fig. 3). The same authors explored later the formation of bonds in the Rydberg NH4 molecule with alkaline atoms.73 Some of their results are summarized in Fig. 15, where it is noted that the penetration index between the contact atoms, pHM, is now much higher (25–56%), since overlap with the valence orbitals of the alkaline atom is required in this case. It can also be observed that the more electropositive the alkaline atom is (and the smaller), the higher the penetration, while the N–H bond is much less sensitive to the degree of H⋯M penetration, taking as a reference the value for the independent NH4 molecule. The transition state for the dissociation of the metastable Rydberg bonds requires enhanced M⋯H penetration, close to forming M–H bonds, and a simultaneous depenetration of the N and H atoms, leading finally to the thermodynamically favoured product, NH3 + M − H.
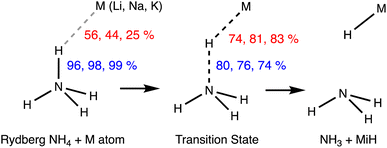 | ||
| Fig. 15 Penetration indices of the N–H bond of an NH4 Rydberg molecule and its H⋯M contacts with alkaline ions in the metastable state (left) and in the dissociation transition state (centre) to the products of a proton transfer reaction (right). Adapted from data reported by Boldyrev and Simons.73 | ||
Metallophilic interactions
The most abundant and most studied examples of metallophilic (d10⋯d10 or d8⋯d8) interactions are those involving two or more linearly coordinated Au(I) complexes and were termed “aurophilic”,75 a name that was later made more general to include other metals presenting similar metal–metal closed-shell interactions. The aurophilic interactions have been recently reviewed by Schmidbaur and Raubenheimer.76 Those interactions were initially studied computationally via extended Hückel calculations by the Hoffmann group in related Cu(I) compounds77 and in Au(I) compounds.78 More recent studies on d10–d10 interactions include Cu(I)79 and Hg(II)80 compounds. Similar interactions can be found between square planar d8 metal centres.81–83If we look at the distribution of metal–metal penetrations between dicoordinated Ag(I), Au(I) and Hg(II) ions (Fig. 16a) we can see clear peaks with maxima at 32, 68 and 78% for Hg, Au and Ag, respectively. At lower penetrations, one can find an increasing number of structures that most likely do not present metallophilic interactions.
 | ||
| Fig. 16 (a) Distribution of metallophilic contacts between linear d10 complexes according to their M⋯M penetration indices. (b) Distribution of the Pt⋯Pt penetration index as a function of the stacking angle for contacts between square planar Pt(II) complexes. The continuous line indicates the general trend, and the dashed line corresponds to the highest values at certain angles. (c) Fitting of the M⋯M penetration index distribution for square planar complexes of Ni, Pd and Pt. Raw data are provided in ESI, Table S12.‡ | ||
In Fig. 16b we present a scatterplot of the Pt⋯Pt penetration indices between neighbouring molecules of square planar Pt(II) complexes and the angle of the Pt–Pt vector with the Pt coordination plane. Although there is a high dispersion, most of the structures follow roughly a general tendency to present higher penetration indices as the deviation of the contact from the axial direction becomes smaller. Since metallophilic interactions are non-covalent, it is surprising to find in that plot four points with penetrations higher than 90%. They correspond to four crystallographically independent molecules in the crystal structure of a partially oxidized bisoxalatoplatinate salt with a fractional Pt–Pt bond order,84 and similarly for a Pd compound with a penetration index of 91%.85 The rest of the 3359 structures analysed have penetrations of at most 82%. We also pay attention to those structures with significantly higher penetration than others with the same angle. One is the double complex salt [Pt(en)2][Pt(CN)4],86 in which the Pt atoms of the cation and anion alternate in a regular stacking, thus adding an electrostatic attraction to the metallophilic interaction. In another case with an excess penetration,87 two Pt atoms are close due to a short Pt⋯S contact as seen by comparing the Pt⋯S and Pt⋯Pt penetrations (73 vs. 21%). In yet another case, the neighbouring monomers are slipped in such a way that a Pt⋯O contact (52% penetration) predominates over the Pt⋯Pt one (4%).88
Finally, in Fig. 16c we compare the distribution of the M⋯M penetrations for square planar Ni(II), Pd(II) and Pt(II) complexes. It can be seen that the most common penetration indices for the three metals are within the 50–60% range, but also that there is a wide distribution of values that goes from 20 to an upper limit of 90%, with Pd showing the widest distribution.
Secondary metal–ligand interactions
We have analyzed some secondary intramolecular interactions between a square planar metallic atom and a pending phenyl group from the point of view of penetration indices and the results are summarized in Fig. 17a, where the peaks of the distribution of M⋯C penetrations are presented for M = RhI, IrI, NiII, PdII, and PtII. There, the maximum probability for the M⋯C contacts appears at quite similar degrees of penetration (24–29%), except for Pd, for which the distribution is slightly displaced to lower penetrations, centred at 18%. The corresponding secondary interactions of arenes with linearly coordinated AgI and AuI ions have also been analysed and represented in Fig. 17a for comparison.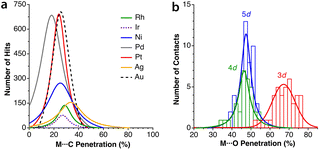 | ||
| Fig. 17 (a) Distribution of the penetration indices of intramolecular arene⋯square planar and arene⋯linear metal atom secondary interactions. (b) Distribution of the penetration indices for the secondary interaction between a pending oxygen atom of a monodentate nitrato ligand and a square planar 3d, 4d and 5d transition metal atom. Data are provided in ESI, Tables S13 and S14.‡ | ||
It is also interesting to compare the penetrations found in the recently reported structures of ethylene complexes of CuI, AgI and AuI with tris(pyridyl)borate ligands coordinated in a bidentate mode, forming a trigonal planar coordination sphere.89 These complexes present secondary interactions between the metal atom and the pending pyridyl ring, with penetrations of 66, 71 and 62% for Cu, Ag and Au, respectively, similar to the largest penetrations found for square planar and linear complexes. Notice that we show only a Lorentzian fitted to the peak of maximum probability but, in general, the distribution does not decay to zero at low penetration and continues to increase due to the presence in the crystal structure of weakly or non-interacting contacts, as seen in Fig. 16a and c.
Notably, secondary bonding of an aryl pending from a σ-coordinated phenyl group is also present in the first dinuclear compounds with quintuple Cr–Cr bonds reported by Power and coworkers.90,91 C⋯Cr penetration indices for such interactions have values between 87 and 93%, i.e., very close to a, if not a true, covalent bond. For comparison, the host of arenes coordinated in an η6 mode to a Cr atom have average C⋯Cr penetration indices between 92 and 104%. Related compounds with quadruple Mo–Mo bonds from the group of Carmona92–94 have similarly semi-coordinated aryl groups but with smaller C⋯Mo penetrations (61–83%). A quite different series of compounds but with similar bonding features contains a p-terphenyldiphosphine that was designed to act as a bidentate ligand through phosphine groups, while at the same time facilitating metal-arene interactions through the central phenyl ring.95 When coordinated to Ni, Pd or Mo, the short C⋯M contacts have penetrations in the range of 73–104%, and only in an AgI compound does it drop to 65%.
A quite different example of secondary interactions focuses on the nitrato ligand acting in a monodentate coordination mode. In this case (Fig. 17b), the smaller size of the 3d metals (Co, Ni and Cu) facilitates a significantly higher penetration than that for the 4d (Cd and Pd) and 5d (W) metals. It must be noted that the two families of secondary bonds considered here cover a range of penetration indices similar to those found for hydrogen bonds (see below).
The importance of secondary interactions in solid-state chemistry was assessed by Landrum and Hoffmann,96 paying attention in particular to those involving pnictogens and halogens. It was found that, for instance, Sb⋯Cl interactions cover a range of distances between 2.45 and 4.0 Å, i.e., penetrations from 15 to 87%, like those shown by late transition metals with aryl groups (Fig. 17a) or by 3d metals with a monodentate nitrate anion (Fig. 17b).
The Jahn–Teller effect,97,98 consisting of the distortion from a regular geometry of molecules with a degenerate ground state, is well known in coordination chemistry, mostly because it affects the large family of six-coordinated copper(II) complexes that commonly present two long copper–ligand distances in trans positions and four shorter ones in the equatorial plane of an elongated octahedron.99 The elongation of the two axial bonds may be so large that in many cases the coordination sphere of Cu is described as square planar, but two secondary interactions can be identified in axial positions by close inspection of the crystal structure. Less well known is the fact that trigonal prismatic copper(II) complexes also present a Jahn–Teller distortion, but in this case affecting two cis ligands.100 Certainly, the Jahn–Teller effect is present in a wide variety of chemical systems besides copper(II) complexes, but we focus here on them and on isoelectronic silver(II) compounds only to establish a connection with other non-Jahn–Teller secondary interactions. To this end, we have looked at the Cu⋯F (CSD) and Ag⋯F distances101 and found the secondary interactions to cover the ranges 42–82% and 70–91%, respectively, compared to values of between 95 and 101% for the short M–F bonds in both cases. The low penetration limit, however, is an artifact dictated by the maximum contact distance adopted in structural database searches, and the two “tetracoordinated” metal ions have secondary interactions extending from a maximum of 95% to 0% or even negative penetration values.
Intramolecular contacts
Let us try to find some trends in intramolecular non-bonded contacts by looking first at simple AXn molecules (A = group 13–16 elements and X = H or halogen), comparing them with the paradigmatic case of methane. By their bonding to the same carbon atom, two geminal hydrogens in alkyl groups are held nearby, resulting in a 35% interpenetration of their van der Waals crusts, as deduced from non-bonded H⋯H distances in methane in the gas phase. A similar value is obtained for the methyl groups in the CSD crystal structures without disorder, obtained by neutron diffraction and with an agreement factor R of at most 2.5% (ESI, Fig. S2‡). Replacing the central carbon atom of methane by an increasingly larger group-14 element increases the distance between the gem hydrogens, with a consequent decrease in the interpenetration of their crusts (Fig. 18a). A similar behaviour is found for groups 13 and 15 AH3 and group 16 AH2 molecules, with the hydrogen atoms becoming closer as we move from left to right of the periodic table within the same period. | ||
| Fig. 18 (a) Variation in the penetration indices for the intramolecular gem H⋯H contacts in main group AHn molecules (n = 3, 4, 3 and 2 for groups 13, 14, 15 and 16, respectively) with the size of the central atom. (b) A similar plot for the 14 AX4 halides, with A being a group-14 element.(c) Correlation between the H-A-H fond angle and the gem H⋯H penetration for group 15 AH3 and group 16 AH2 molecules. Raw data are provided in ESI, Table S15.‡ | ||
We must note at this point that X-ray distances involving hydrogen atoms have larger uncertainties (typically 0.010 Å) than those for heavier atoms. For this reason, throughout this work we restrict structural database searches for distances involving hydrogen to non disordered structures, small R factors (<5% or <2.5%) and to neutron diffraction data, whenever these restrictions still allow us to work with a significant number of structural data. In all cases, however, differences of a few hundredths of an Ångstrom in distance do not have dramatic effects on penetration values. For instance, O⋯H distances of 2.65 and 2.69 Å differ in their penetration indices by only a 2.3%.
If we restrict the central atoms (A) to group 14 elements and replace the H atoms by halogen atoms, giving rise to AX4 molecules (Fig. 18b), the variation in the penetration index with the size of A for a given halogen is quite like that for hydrides. The effect of the substitution of the external atoms, however, is less pronounced than that of the substitution of the central one, as seen by the smaller separation between the lines in Fig. 18b compared to those in Fig. 18a. The smaller effect of the size of X is explained as due to an increase in the A–X distance as we move down the halogen group, which increases the distance between the X atoms and is compensated for in part by the larger size of their van der Waals crusts. The effect of the increased steric crowding of a Me3−nHnC–X molecule on the C–X bond strength102 is an indication of the importance of the interpenetration of geminal groups.
We cannot ignore that along the AH3 (group 15) and AH2 (group 16) series the H–A–H bond angle decreases drastically as we go from the second to the third period. While a smaller angle should result in a higher H⋯H penetration, the opposite occurs, and the compounds with larger bond angles are those with a higher H⋯H penetration (Fig. 18c). This behaviour is akin to the classical Gillespie–Nyholm explanation for varying bond angles, i.e., the smallest central atoms impose shorter H⋯H distances (higher penetration), which can be relieved by increasing the bond angle.
Another factor that affects the penetration between gem atoms is hybridization, which imposes large differences in bond angles. Thus, the wider H–C–H angle in the sp2 carbon atom of ethylene or formaldehyde, compared to that in the sp3-hybridized methane, results in a slightly smaller interpenetration of the sp2gem H atoms, decreasing from 35 to 30%.
The interaction between vicinal H atoms, i.e., those bonded to two neighbouring carbon atoms, seems to be much less important. Ethane and ethene present small negative values (−8 and −4%, respectively). The quite similar H⋯H penetration values despite the shorter C–C bond in the latter, appear because it is in part compensated for by larger C![[double bond, length as m-dash]](https://www.rsc.org/images/entities/char_e001.gif) C–H bond angles (120°) than in ethane (109.5°).
C–H bond angles (120°) than in ethane (109.5°).
One of the classical examples in organic stereochemistry is the non-planarity of the biphenyl molecule, attributed to steric repulsion between the ortho hydrogen atoms of the two phenyl rings. While Matta et al. proposed the existence of H⋯H bonding, based on a topological analysis of the electron density of biphenyl and related aromatic compounds,103 Poater et al. ruled out a bonding interaction and found that steric repulsion prevented the minimum from having the coplanar conformation, based on an energy decomposition analysis (EDA) of phenanthrene, biphenyl and anthracene104,105 and on calculations of a tetraradical molecule derived from biphenyl by removing the four ortho hydrogens. Other remarkable contributions include an article by Grimme et al. based on vibrational spectroscopy data106 and an illuminating discussion on this topic by Krapp and Frenking.49 Although it is not our purpose to participate in such a debate, we think that consideration of the crust interpenetration of atoms belonging to the same molecule can be of great help in analysing such problems from a wider perspective. Thus, in Chart 1 we show some of the molecules to be considered, together with their average H⋯H distances retrieved from the CSD and converted into pHH penetration indices. For comparison, we also show in that chart the pHH values for the gem and vic H atoms in methane,107 ethane in its staggered conformation,108 ethylene,109 and cyclobutane.110 Notice, for instance, that in the fully planar biphenyl characterized by Poater et al. as a transition state the interpenetration of the ortho hydrogen atoms is 26%, somewhat less than that between the gem H atoms in alkanes and alkenes.
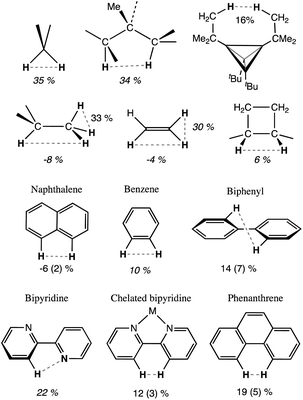 | ||
| Chart 1 Intramolecular penetration indices of some organic molecules, from X-ray crystal structures (average of CSD structures with esds in parentheses) or from the gas phase (italics). | ||
Free bipyridine has an anti orientation,111 and the H–H distance is rather long. However, the N⋯H penetration is 22%, and it seems likely that a non-negligible N⋯H interaction, be it attractive or repulsive, exists in that conformation between the nitrogen lone pair and the proximal hydrogen atom. We observe that in the nearly planar coordinated bipyridine, the H⋯H penetration is on average 12 (3)%, i.e., significantly less than that in methane, ammonia or water (Fig. 18a). From the computational results for the biphenyl molecule just mentioned,104 we find that the minimum with a torsion angle of 35.5° has a very low penetration index of 5.6%, well within two standard deviations of the average experimental value (Chart 1), while in the planar transition state the penetration is a non-negligible 26.1% and in the perpendicular orientation, also a transition state, there is no interpenetration of those H atoms at all, with an index of −64.5%.
The ability of the tert-butyl group to establish weakly attractive H⋯H interactions has been proposed to be responsible for unusual stabilities of long or congested C–C bonds. Matta et al.,103 for instance, have estimated that each H⋯H contact in tetra-tert-butyltetrahedrane contributes 1.6 kcal mol−1 to the stability of the molecule, which they associate with H⋯H distances as short as 2.116 Å112 (16% penetration). More recently, Schreiner and co-workers113 have reported the neutron diffraction structure of tri(3,5-tert-butylphenyl)-methane, in which two molecules engage in a contact at a very short H⋯H distance (1.566 Å, 47% penetration) between their central C–H groups, supported by several H⋯H interactions between their t-butyl groups, but at distances of 2.39 Å and longer, i.e., penetrations of at most a 1%. In summary, H⋯H contacts can help stabilize a molecule if they can have not too high interpenetrations, and the resulting molecular geometry results from a delicate balance of the penetration-dependences of the C–C bond and H⋯H contacts.
Agostic M⋯H interactions, alkane σ-complexes and dihydrogen coordination
Agostic interactions vs. σ C–H bond coordination
Prototypic organometallic complexes are those formed by an alkyl group coordinated to a transition metal (1 in Chart 2). However, it was soon discovered that in some cases a distortion of a coordinated alkyl group allows for close contact between a hydrogen atom and the metal (2 in Chart 2), for which the term ‘‘agostic bond’’ was coined.114 The agostic interactions are not that different from the so-called σ-bond coordination, in which the C–H group and a metal atom form a 3 center-2 electron bonded system (3 in Chart 2). Several reviews have been devoted to this family of compounds whose interest arises in good part from the possibility of acquiring a better understanding of the activation of C–H bonds in many processes catalysed by organometallic complexes.115–118 A computational study of several Mn, Re and Rh σ-complexes has found that the dispersion interaction is largely responsible for thermodynamic stability of such species.119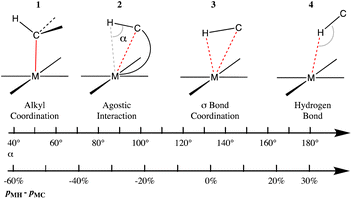 | ||
| Chart 2 Different bonding situations between a C–H group and a transition metal, characterized by the M⋯H–C angle and the difference between the M–H and M–C penetration indices. | ||
Without loss of continuity, further geometrical changes may lead to C–H⋯M hydrogen bonds (4 in Chart 2), also referred to as anagostic. The coordination of a C–H bond of an alkane to a Lewis acid such as a transition metal ion is nowadays well established in many cases,120 in which the two electrons of the C–H bond are shared with the metal M and can thus be considered a specific type of 3c–2e bond. It seems clear that these four types of interactions between a metal atom and a C–H group are connected in a continuous geometrical pathway analogous to that proposed by Crabtree.121 Such a pathway can be characterized by changes in the M⋯H–C angle, as well as by changes in the relative values of M–H and M–C penetrations, represented by the difference between the corresponding penetration indices, pMH − pMC, as shown in Chart 2. Notice that negative values of the penetration difference may suggest that the C–H unit interacts with the metal mostly through the carbon atom, whereas values close to zero point to a similar participation of both the C and H atoms, and large positive values indicate an interaction dominated by the proton-metal contact.
To test the ability of penetration indices to describe the different bonding situations in the metal–HC system, we have chosen to analyse prototypic structures that fulfill one of the three following criteria: (i) σ-bonded alkyl complexes from our database of homoleptic transition metal complexes,122 (ii) prototypic examples of agostic and σ-bond coordinated complexes, and (iii) a representative sample of square planar metal complexes in which the metal atom is involved in hydrogen bonding with a C–H group (either intra- or intermolecular) selected from a large set of structures with M⋯H–C angles between 165 and 180° found in the CSD. One must be cautious with these numerical values, however, given the uncertainty associated with the position of H atoms determined by X-ray crystallography.
A plot of the differential penetration as a function of the M⋯H–C angle (Fig. 19, data are presented in ESI, Table S16‡) confirms the trend expected from Chart 2, with M⋯H–C angles covering the whole range between 40 and 180° and pMH − pMC going from −60% (carbon-dominated bonding) to +30% (hydrogen-dominated bonding). It is also interesting to verify that the cis hydride and alkyl (or aryl) ligands in the same molecule are in a distinct situation, in which both the M–H and M–C penetrations are around 100% and therefore the differential penetration (pMH − pMC) values are concentrated around the 3% mark, while the H⋯C contacts have penetration indices between 0 and 45% (centred at 25%), similar to those found between gem H atoms in methyl groups or like those discussed above (Fig. S3 in the ESI‡).
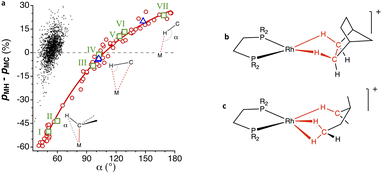 | ||
Fig. 19 (a) Difference of the M⋯H and M⋯C penetration indices represented as a function of the M⋯H–C angle (α) in σ-bond coordinated alkyl and aryl complexes (circles). The dots correspond to hydrides with a non-carbonylic carbon atom bonded in the cis position to the same metal atom. (b) Example of an alkane coordinated to a metal atom mostly through the hydrogens.123,124 (c) Example of a molecule with one methylene group coordinated in an η2![[thin space (1/6-em)]](https://www.rsc.org/images/entities/char_2009.gif) : :![[thin space (1/6-em)]](https://www.rsc.org/images/entities/char_2009.gif) η2 mode and another in an η1 mode (triangles in the plot). Data are provided in ESI, Table S16.‡ η2 mode and another in an η1 mode (triangles in the plot). Data are provided in ESI, Table S16.‡ | ||
Let us now comment with some details on a few specific examples, highlighted in Fig. 19a as squares, that can be seen as snapshots along the bonding coordinate of Chart 2. First, we have the [NbMe6]− anion (point I in Fig. 19a),125 in which there is a regular tetrahedral Nb–C–H bond angle, which presents an M⋯H–C angle of 51°, a strong M–C penetration (109%) and a much lower, but non-negligible M–H penetration (59%), and a differential penetration of −50%. Even if it is clear in this case that there is a covalent M–C bond and just a gem contact between the M and H atoms, the interpenetration of these two atoms is comparable to those between hydrogen atoms in H2O (Fig. 18).
An angular distortion of the Ti–Me moiety in the landmark titanium methyl complex [(dmpm)Cl3Ti–CH3] (point II in Fig. 19a), with an M–C–H bond angle of 94°, is the signature for an agostic Ti⋯H interaction. The Ti⋯H penetration, at 69%, is only slightly larger than that in the non-agostic complex just mentioned. Similarly, short contacts to a metal atom can as well be made by C–H groups not directly bound to the metal, but in β, γ, δ or φ positions, usually belonging to phenyl, isopropyl, or tert-butyl groups of coordinated ligands. There seems, however, to be no correlation whatsoever between the number of intervening bonds between the M and H atoms and the interpenetration of their van der Waals crusts.
The structures that appear in Fig. 19 with a small negative or positive difference between M⋯H and M⋯C interpenetrations constitute probably the best examples of C–H σ-bond coordination. For instance, in [ClPt(tBu-py-PhF)]126 (point III in Fig. 19a), a distal methyl group of the t-Bu substituent of a coordinated pyridine contacts through a CH2 group the square planar Pt atom at an empty coordination site (Fig. 20a), with H⋯Pt and C⋯Pt penetration indices of 74 and 82%, respectively, as expected for a σ-bond coordination 2 (pMH − pMC = −8%). This situation is similar to that found computationally by Bickelhaupt and coworkers102 in the initial complex formed by a Pd atom and a methane molecule as the first step in an oxidative addition of a C–H bond. In that complex, the CH2⋯Pd group has H⋯Pd and C⋯Pd penetration indices of 77 and 75%, respectively.
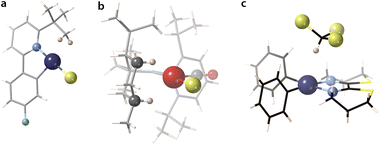 | ||
| Fig. 20 Structures showing (a) a CH2⋯Pt contact126 with predominant C⋯Pt penetration (xampuy, −8% diff.), (b) two κ1–C–H⋯Rh contacts129 with predominant H⋯Rh penetration (cefcia, 15% diff.), and (c) C–H⋯Pt hydrogen bond between a chloroform molecule and a square planar PtII complex (kekzab, 24% diff.).130 | ||
Another prototypical example is that of [(dmpe)2TiCl3–CH2–CH3] (point IV in Fig. 19a),127 in which the β carbon atom of the coordinated ethyl group is at 2.50 Å of Ti, and the corresponding H atom is at 2.06 Å, yet the penetrations of the two atom pairs are practically identical and high enough as to consider them both bonded in a σ C–H bond coordination mode 3. A similar situation is found for weakly bound propane molecules at open coordination sites of Fe atoms in a MOF (point V in Fig. 19a),128 with a slightly predominant Fe⋯H penetration (pMH − pMC = 10%).
Among the coordinated σ C–H bonds, a particularly interesting family of Rh complexes has been made by A. Weller and coworkers131 (Fig. 19b and c). In those compounds, the σ-bond coordination is not a secondary interaction, but the alkyl groups are coordinated only through the C–H bonds, occupying specific coordination sites (4). The alkyl-metal bonding has been nicely described by NCI (non-covalent interactions) plots and NBO donor–acceptor analysis.132 They were obtained via a single crystal to single crystal reaction in which a diene precursor is reduced with H2, resulting in coordinated alkanes that include cyclooctane, 2,3-hexane, norbornane, or pentane, with a variety of hapticities. As an example, in the Rh complex with 3-methylpentane (triangles in Fig. 19a),133 whose structure is schematically shown in Fig. 19c, one methylene group is coordinated through its three atoms (Rh–H penetrations 83% and Rh–C penetration 88%), while another methylene is coordinated predominantly through the H atom (pRhH − pRhC = 20%). A related Rh complex in which a cyclohexyl group is attached to a carbene ligand is coordinated through two C–H bonds (shown in Fig. 20, point VI in Fig. 19a).129
Finally, we have a clear example of hydrogen bonding with a transition metal (Fig. 20c) in a chloroform adduct with a square planar Pt complex (point VII in Fig. 19a).130 In this, the CHCl3 molecule establishes a contact at a Pt⋯H distance of 2.589 Å (penetration index of 56%) in an axial position (Fig. 20c), with a Pt⋯H–C angle of 169°.
In summary, a representation of the M⋯H and M⋯C penetration indices as a function of the incidence angle of the C–H bond, even if showing a poor correlation, allows us to draw several conclusions: (i) the M⋯H penetration increases as the incidence angle tends to 180°, while the M⋯C penetration varies very little with that angle; (ii) so far, the highest M⋯H penetrations are close to 100%, and correspond to the cyclooctane,134 norbornane135 and cyclooctane134 Rh complexes and an Os complex136 with two phenylic C–H groups occupying two sites of the coordination octahedron, all with coordination mode 4; (iii) those high M⋯H penetrations appear at Rh–H–C angles larger than 110° and predominate over the M⋯C penetrations that are below the 75% mark; (iv) for incidence angles below 100° the M⋯H and M⋯C penetrations are similar, as is the case of the n-hexane132 and n-pentane123 rhodium complexes. The structures shown in Fig. 20, thus, represent snapshots along the path from hydrogen-bonded alkanes to σ C–H coordinated alkanes. It must be stressed that the structures aligned along the path shown in Fig. 20 correspond to a wide variety of transition metals: Ti, Cr, Fe, Co, Ni, Mo, Ru, Rh, Os, Ir, Pd, and Pt.
Dihydrogen vs. dihydride coordination and Si–Si bond coordination
The H–H bond in H2 can also coordinate to a Lewis acid through its two electrons, as first reported by Kubas.137 For σ-bonded dihydrogen, Kubas characterized several steps along the oxidative addition reaction of a dihydrogen molecule to a metal atom, which starts with the formation of a dihydrogen complex that may evolve to a dihydride complex in five successive steps, by stretching the H⋯H distance.138 Due to the usual uncertainty in the position of hydrogen atoms near heavy atoms associated with X-ray structural determination, a great deal of computational studies139 as well as neutron diffraction structure determinations of deuterated samples has been devoted to this family of compounds.140Concerning the different situations described by Kubas (5), from a free dihydrogen molecule to a dihydride complex resulting from oxidative addition, since we are comparing in all cases the same pair of interacting atoms, the H–H distance and the pHH penetration index are equivalent. However, the penetration index provides us with an added meaning that is not as easily appreciated with raw interatomic distances. Notice, for instance, how the interpenetration of the two hydrogen crusts goes from nearly 100%, indicative of the covalent bond in free H2, to a weaker bond in the η2-coordinated dihydrogen, to a final 45% value in the dihydride complex, comparable to that found for the two gem hydrogen atoms in methane (35%).
The oxidative addition pathway proposed by Kubas (5) is beautifully expressed as a correlation between the H⋯H and M⋯H penetration indices found in the structures determined by neutron diffraction (Fig. 21a), despite the variety of metal atoms considered (Fe, Ni, Mo, Ru, and Os). In contrast, the data from X-ray structures show no correlation, most probably due to the uncertainty in the H atom positions determined with this technique.
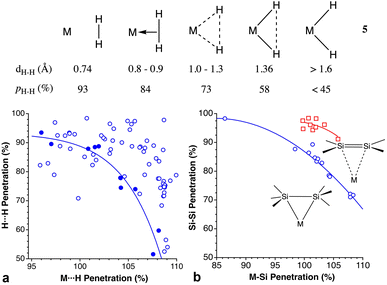 | ||
| Fig. 21 (a) Relationship between the M⋯H and H⋯H penetration indices for all structures of transition metal M(η2-H2) fragments determined by X-ray diffraction (empty circles) or by neutron diffraction (filled circles). The continuous line is a least squares fitting to the neutron diffraction data only. (b) Relationship between the Si–Si and M–Si penetrations in compounds with σ-coordinated Si–Si bonds (M = Ni, Pd, Mo, Cu; circles) and in the π-coordinated disilenes found in the CSD (squares). Data are provided in ESI, Table S17.‡ | ||
We have also analyzed the coordination of Si–Si bonds to transition metals,141–144 and found them to follow a similar trend to the σ-bonded dihydrogen molecule (Fig. 21b) even if different metal atoms are included in the same plot. The outlier corresponds to a Mo compound in which three σ bonds, H–Si–Si–H are involved in a donation to the metal atom, with the coordination of the H atoms presenting a slightly higher penetration to Mo (100 and 110%) than the Mo–Si ones (97 and 107%). It is interesting to compare these penetration indices to those of π-bonded silene complexes, in which for the same M–Si penetration, the Si–Si penetration is about 12% higher. The Si–Si single bonds in the CSD, on the other hand, present a distribution of penetration indices centered around 93.7% (Fig. S4 in ESI‡).
Hydrogen bonds
Despite the variety of hydrogen bonds and their importance in chemistry and biology, their typologies and energies are usually grouped into three families.145–147 Thus, hydrogen bonds are termed moderate if they resemble those between water molecules (one could also call them “normal”), and have associated energies in the range of 4–15 kcal mol−1. Hydrogen bonds with energies above and below this range are termed strong and weak, respectively.In a first exploration of the penetration between the hydrogen atom and the acceptor in a D–H⋯A hydrogen bond, we have analysed the probability density of penetrations for several combinations of hydrogen donors and acceptors: D = O, N and A = N, O, O![[double bond, length as m-dash]](https://www.rsc.org/images/entities/char_e001.gif) C, S
C, S![[double bond, length as m-dash]](https://www.rsc.org/images/entities/char_e001.gif) C, Cl and Br. As examples, we show two plots in Fig. 22, where we can appreciate both the similar probability maxima and the much wider dispersion for the case of the O–H⋯Cl than for the O–H⋯O bonds.
C, Cl and Br. As examples, we show two plots in Fig. 22, where we can appreciate both the similar probability maxima and the much wider dispersion for the case of the O–H⋯Cl than for the O–H⋯O bonds.
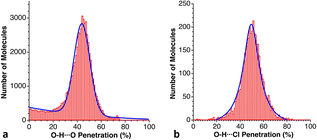 | ||
| Fig. 22 Distribution of the penetration indices for O–H⋯A hydrogen bonds with (a) A = O and (b) A = Cl, with maxima at 43 and 46%, respectively (see ESI, Table S18).‡ | ||
Grabowski and Sokalski148 reported calculated dissociation energies for a variety of hydrogen-bonded pairs of molecules that include X⋯H atom pairs (X = F, O, N, C, and H). Those energies correlate nicely with the corresponding penetration indices (Fig. 23), despite the number of atoms involved in those hydrogen bonds.
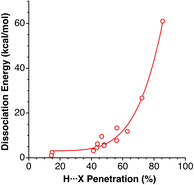 | ||
| Fig. 23 Dissociation energies of hydrogen-bonded complexes comprising H⋯O, H⋯N, H⋯F, H⋯C and H⋯H contacts reported by Grabowski and Sokalski,148 represented as a function of the corresponding penetration indices (see ESI, Table S20).‡ | ||
Among the so-called classical hydrogen bonds, let us focus on N–H⋯Cl contacts. Their distribution peak has a sharp maximum at 42% and a tail at smaller values attributable to weaker interactions. If we limit the search to chloride anion interacting with alkylammonium cations, R3NH⋯Cl (6224 data), the penetration distribution (Fig. 24a) can be fitted (disregarding the data of the tail with p < 30%) to a Lorentzian function with its maximum at 45.2%. If we now compare that distribution with those of the other halides, the maxima for F, Br, and I appear at 49.9, 39.9 and 33.4%, respectively (Fig. 24b). These values decrease linearly as we go down the group, (pHX = 61.3–5.48 nX; r2 = 0.99, where nX is the period of X; data are given in Table S19‡).
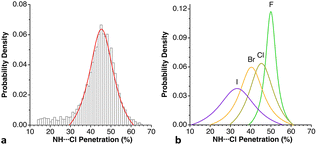 | ||
| Fig. 24 (a) Distribution of the H⋯Cl penetration index for hydrogen bonds with alkylammonium cations, showing the fitting to a Lorentzian function. (b) Distribution of the N–H⋯X penetrations in hydrogen bonds between alkylammonium cations and halogen atoms (see ESI, Table S19).‡ | ||
The large crown ether 18-crown-6 (ref. 149) and derived macrocycles, such as the disilyl derivatives,150 are well known to capture cationic species. In the case of the hydronium cation, H3O+, that makes three crystallographically independent H⋯O contacts in 11 data sets from 6 compounds, with penetration indices in the range 39–60%, the shortest contact in each adduct penetrates in all cases more than 48%, i.e., among the highest values found for O⋯H–O hydrogen bonds (Fig. 24a), most likely due to the ionic nature of the hydrogen donor. For comparison, in related potassium clathrates of the same crown ether, the K⋯O interpenetration is in most cases higher than 80%, with a maximum probability density at 9% (Fig. S5 and Table S25, ESI‡), undoubtedly associated with the added contributions of donor–acceptor and ion-dipole interactions. In a different family of macrocycles, we find that protonated forms of trimethyl-triazacyclononane form intramolecular N–H+⋯N hydrogen bonds with p = 33–42% (compared to 105% in the N–H+ bond), similar to the values found for non-protonated N–H⋯N hydrogen bonds.
The F–H⋯F− interaction is considered to be one of the strongest hydrogen bonds.147 If we disregard those structures in which one or two fluorine atoms are bonded to another element, we are left with the FHF− anion that can be found with a symmetric structure with F–H penetrations of 80 ± 1% in the gas phase,151–153 in the solid state in its potassium salt154 and the same salt cocrystallized with IF5,155 and in solution.156 But it also appears in several organic crystal structures in the CSD with one short and one long F–H distance. A scatterplot of the two penetration indices (Fig. 25a) shows the existence of many structures in which one F–H bond (penetration ≈100%, to be compared with 98% in gaseous HF157) coexists with a long H⋯F contact (penetrations of 40–60%), and as the contact becomes more penetrating the bond is weakened, until reaching the symmetric structures in which the two penetration indices become identical, around 85%. The whole set of structural data thus represents snapshots along a proton transfer process between the two fluorides, F–H⋯F− → F⋯H–F−. We call the attention of the reader to the fact that the penetration between the two fluorine atoms is not negligible at all, in most cases between 20 and 45%, consistent with the observation of Dereka et al., that it is better characterized as a hydrogen-mediated donor–acceptor bond.156 In Fig. 25a we show how the van der Waals crusts of the two fluorine atoms interpenetrate in a symmetric F⋯H⋯F− anion.
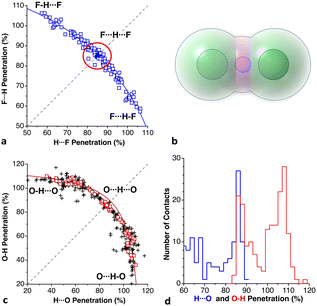 | ||
| Fig. 25 (a) Correlation between the penetrations of the two F–H contacts in a F–H–F− anion. (b) Representation of the valence and van der Waals spheres in the F–H–F− anion154 (c) Correlation between the high and small H⋯O penetrations in H2O⋯H+⋯OH2 groups (squares correspond to crystal structures with R ≤ 2.5%). In a and c the dashed lines correspond to symmetric structures with two identical X–H penetrations, where X = F and O, respectively. (d) Distribution of the penetration indices in the long and short O–H contacts in H2O⋯H+⋯OH2 groups (see ESI, Table S21).‡ | ||
The H2O+–H⋯OH2 cation also forms strong hydrogen bonds,147 comparable only to those in the just discussed H–F⋯H+ group and to the F–H⋯O interactions. This is found in solid state compounds with chloride,158 bromide159 or nitrate160 as counterions and also in a host of organic anions. As for the case of the F⋯H⋯F− groups, there is a wide variation of the two O–H penetrations, which also seem to be correlated in such a way that when a water molecule gets at shorter distances of the hydronium cation, the approaching O–H bond becomes longer (Fig. 25c), up to the point at which the two distances become identical. The dispersion seen in Fig. 25c is attributed to the poor determination of the hydrogen atom positions in the X-ray structures, as corroborated by selecting only those structures with an agreement factor R ≤ 2.5%. It must be noted that for small H⋯O penetrations the O–H bond is practically unaltered, as indicated by a plateau in Fig. 25c, and only for penetrations above 60% does it start to elongate in practically the same way as in the F–H⋯H− case (Fig. 25a). An interesting feature of the distribution of the penetrations of the two O–H interactions (Fig. 25d) is the existence of two maxima corresponding to the H2O–H+⋯OH2 and H2O⋯H+⋯OH2 cases (at ∼110 and 88%, respectively), that suggest that there are three potential energy minima in an H2O–H+ + OH2 → H2OH + H+OH2 proton transfer process, which might proceed through a symmetric intermediate. The linear stretch of the proton transfer in the two systems, FHF− and H2O–H+–OH2, can be jointly fitted to a linear equation: pH⋯X = 149.0 − 0.735 pX–H, where X is F or O (r2 = 0.95).
The distribution of penetration indices found for 21 types of hydrogen bonds is summarized in Fig. 26. The C–H⋯F, C–H⋯O, C–H⋯N and C–H⋯S interactions, considered to be weak hydrogen bonds,146,161 are indeed the ones that present the lowest penetrations (Fig. 26). In the case of C–H⋯N contacts, the distribution of penetrations due to weak noncovalent interactions starts below 20% and constitutes a shoulder of the much abundant random distribution of atom pairs at about −22%. The abundant C–H⋯S hydrogen bonds have been the object of a detailed structural analysis recently.162 It was concluded that such interactions show a geometric preference for angles larger than 155° and distances between 2.83 and 3.13 Å. A similar analysis carried out by us from the point of view of the van der Waals crust interpenetration yields a distribution of the S⋯H penetration indices with a maximum at −7% that reaches values up to 25%, comprising contacts reported by Fargher et al.162 (−2 to 15%) in a narrower range of angles. Keil et al. called attention to intramolecular Si–H⋯SeR2 interactions at H⋯Se distances between 2.71 and 2.91 Å,163 that correspond to penetrations of 6–19% (Table S21, ESI‡), well within the range found for intermolecular H⋯Se contacts (Fig. S6, ESI‡), distributed between −20 and +30%, with a maximum probability density at 2%.
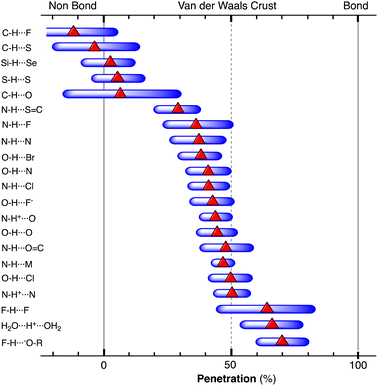 | ||
| Fig. 26 Ranges of penetration indices presented by several types of hydrogen bonds (blue bars) represented by the width of the Lorentzian curve obtained by least squares fitting of the probability density distribution, and the position of the maximum of the probability density (red triangles). Data are provided in ESI, Tables S18–S21.‡ | ||
Halogen and other σ-hole bonds
In a study of the directionality of σ-hole intermolecular interactions, Bickelhaupt and co-workers introduced the idea that they should not be considered as a simple electrostatic attraction between the charge distributions of two independent molecules, but that there is a substantial interpenetration of those charge densities.164 Our present proposal of using penetration indices for the analysis of this class of noncovalent interactions is in line with their conclusion that there is a significant stabilizing component stemming from HOMO–LUMO interactions, i.e., from the interpenetration of the valence spheres. As a first attempt at applying penetration indices to the study of σ-hole interactions, we have selected three families of adducts studied computationally by different authors and looked at their binding energies and other calculated data such as the components of the binding energy obtained from energy decomposition analyses (EDA) or the electron density at the bond critical point (bcp) obtained by the atoms in molecules (AIM) approach.The families selected for this study are shown in Chart 3. First, we discuss the family of adducts in which a four-coordinated atom of the periodic group 14 (E in 6a) interacts with a Lewis base that can be a halide or a group 16 compound, forming anionic or neutral adducts or “tetrel bonds”, respectively, exemplified by the systems computationally studied by Frontera and co-workers.165 The second group is formed by the adducts studied by Shaik and co-workers (6b),166 in which a σ-hole of a halogen or interhalogen molecule Y–X interacts with a Lewis base such as ammonia or water, often called “halogen bonds”. Then we look at “pnictogen bonds” of type 6c in neutral adducts with NCH or NCLi as Lewis bases and analogous anionic adducts with a halide ion acting as the Lewis base, studied by Grabowski.167 Finally, we consider the families of ion-molecule (6d)167 and ionic-pair (6e)168 interactions involving a group 14 atom.
The 6a family, which comprises the nine structures with X−⋯E interactions (X = F, Cl, Br; E = Si, Ge, Sn) reported by Frontera and coworkers,165 shows a strong dependence of interaction energies on the penetration index for each set of interactions with the same halide (Fig. 27a) which can be fitted as a function of the nth power of the penetration index p (eqn (6)), where E0, a and n are fitting parameters. Although E0 is the value of the interaction energy at a small penetration, typically a large negative value of p, such extrapolation may not always be significant, given the sensibility of that fitting parameter to the values of the interaction energy for the points at low penetrations and the small number of points available. On the other hand, considering all the halide adducts together, a similar expression also provides a fair representation of the behaviour of the nine different combinations of E and X. Notice that for the same group 14 element E, the penetrations increase in the order Br ≤ Cl < F and the absolute values of the interaction energy follow the order Br < Cl ≪ F. Conversely, for the same halogen atom, both the penetration and interaction energies follow the trend Si < Ge < Sn.
| Eint = E0 − a·pn | (6) |
 | ||
Fig. 27 (a) Dependence of the X−⋯E binding energy (X = F, Cl, Br; E = Si, Ge, Sn) on the penetration indices for σ-hole bonds in adducts 6a studied by Frontera and coworkers.165 The dashed line corresponds to the least squares fitting for all the compounds. (b) Dependence of the interaction energy of adducts 6b at their energy minima (squares)166,169 of R3Pn–X+ ions with NC–H (triangles) and NC–Li (empty circles; X, R![[double bond, length as m-dash]](https://www.rsc.org/images/entities/char_e001.gif) H or F; Z = N, P, As) 6c,167 R–EY3⋯X− adducts 6d (solid circles),169 and ion pairs 6e (filled squares)168 on the penetration index. (c) The electrostatic + Pauli and orbital interaction components calculated by Wang et al.169 for adducts 6b, represented as a function of the D–X penetration. Data are provided in the ESI (Table S22).‡ H or F; Z = N, P, As) 6c,167 R–EY3⋯X− adducts 6d (solid circles),169 and ion pairs 6e (filled squares)168 on the penetration index. (c) The electrostatic + Pauli and orbital interaction components calculated by Wang et al.169 for adducts 6b, represented as a function of the D–X penetration. Data are provided in the ESI (Table S22).‡ | ||
The second set of intermolecular interactions 6b, studied by Shaik and coworkers166,169 comprises adducts of type D⋯X–Y (E = N, O, C![[double bond, length as m-dash]](https://www.rsc.org/images/entities/char_e001.gif) C; R = H, Me; X = halogen, Y = halogen or NO2). First, we see (Fig. 27b) that the calculated binding energy presents a practically linear correlation with the penetration index, despite the varied combinations of atom pairs considered. It is also seen that the correlation exists regardless of the level of approximation used in the calculations, full valence bond theory (VBT) or the less costly version with block localized orbitals (BLOs).
C; R = H, Me; X = halogen, Y = halogen or NO2). First, we see (Fig. 27b) that the calculated binding energy presents a practically linear correlation with the penetration index, despite the varied combinations of atom pairs considered. It is also seen that the correlation exists regardless of the level of approximation used in the calculations, full valence bond theory (VBT) or the less costly version with block localized orbitals (BLOs).
The σ-hole bonding involving A–CN⋯Z interactions 6c, where Z is a pnictogen atom and A can be H or Li, computationally studied by Grabowski,167 also shows a dependence of the binding energy on the penetration index (Fig. 27b) but for penetrations higher than 60% there is a much stronger enhancement of the interaction energy, with a parallel behaviour of the two families (A = Li or H). Two of these systems, PF4+⋯NC–Li and AsF4+⋯NC–Li, reach penetrations close to 100%, consistent with the adoption of a nearly trigonal bipyramidal geometry of the ZF4N group, and we have verified that there is a correlation between the penetration index and the N–Z–R bond angle for Z = pnictogen (6c), thus describing an SN2 pathway. If we compare this behaviour with that of the 6b series, we see that they cover a similar range of penetration indices but with much higher binding energies, a fact that can be explained based on the ionic nature of the pnictogen-containing species in this case. On the other hand, a comparison with the behaviour of adducts 6a (Fig. 27a) shows similar ranges of binding energies, both corresponding to interactions between a neutral molecule and an ionic species, but a much wider range of penetration indices is covered by 6c, due to the formation of trigonal bipyramidal structures. Despite the differences between the three groups of adducts, all of them can be seen as following a similar type of relationship between the interaction energy and the penetration index of the two interacting atoms, expressed as eqn (6). Moreover, the family 6e, in which the interaction is between two ions of opposite signs,168 shows much stronger interaction energies at relatively low penetration indices.
By looking at the results of the energy decomposition analyses (EDA), we can also observe (Fig. 27c) a nice dependence on the penetration indices of both the repulsive (or slightly attractive) combination of electrostatic and Pauli components and the attractive orbital component. Three outliers in that plot correspond to the interactions between a fluorine molecule and the MenH3−nN molecules; two are not shown in the figure. We suspect that such a different behaviour at short N⋯F distances is due to the presence of additional N–CH3⋯F attractive interactions. In fact, in the gas phase structure of Me3N⋯F2 the C⋯F distances170 represent a penetration index of 23%. Such a hypothesis is further supported by a linear dependence of the N⋯F penetration on the number of methyl substituents.
Let us note in passing that the computational study of the interaction between halogenated molecules and the Xe atom of an electron probe microscopy tip discussed in Section 2.5 and Fig. 12 offers another example of a successful application of penetration indices to noncovalent halogen bonds.
In summary, we have calculated the penetration indices for a variety of halogen bonds studied by three different groups166,168,171 and found them to be all between 11 and 65%. We can thus provisionally conclude that such a range of values is characteristic of halogen bonds, while the penetrations obtained for tetrel and pnictogen bonds correspond to stronger interactions in which there is an additional ion-dipole contribution with varying degrees of formation of a bond in a hypercoordinated species. Still more interesting are the 26 different σ- and π-hole interactions studied by Murray and Politzer,172 that include halogen-, chalcogen-, pnictogen- and hydrogen-bonding, and follow a dependence on the penetration index similar to the one shown in Fig. 27a (see ESI, Fig. S7‡).
One- and three-electron σ bonds
The existence of one- and three-electron bonds was proposed by Pauling almost a century ago.173 The dihydrogen cation H2+ is the simplest molecular system showcasing a one-electron bond and has historical relevance because it was amenable to a solution of the Schrödinger equation.174 Its interatomic distance determined in the gas phase is 1.058 Å,175 that corresponds to a penetration index of 75%, short of the 100% expected for a two-electron bond, yet with a significative degree of penetration of the van der Waals crusts. A somewhat smaller penetration is found for the ground states of LiH+176 and Li2+, but still well beyond the midpoint of the van der Waals crust (65 and 67%, respectively). We compare this with the two-electron bonds in the analogous neutral species, which show penetration indices in the 90–100% range, as schematically represented in Fig. 28.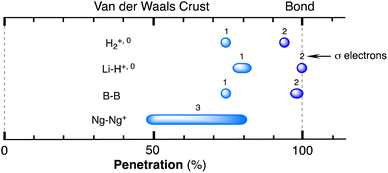 | ||
| Fig. 28 Ranges of penetration indices found for several diatomic species with one-, two-, or three- σ-electron bonds. Ng stands for a noble gas. Data are provided in the ESI (Table S23).‡ | ||
If we turn our attention now to the cationic dimers of noble gases, Ng2+ (Ar–Xe+, Kr–Xe+, He–He+, and Kr–Kr+), with 3 σ electrons, we find penetration indices in the range 48–80%, i.e., at least 15% less than that of the H–X and C–X two-electron bonds (Fig. 29). The much larger variability of the penetration indices in the Ng2+ ions seems to be correlated with the Mulliken electronegativity difference between the two elements. Such an electro-negativity dependence can be considered responsible for the quite low interpenetration found in the He–Kr+ species (3.060 Å,177pHeKr = 19%). For comparison, we also show in Fig. 29 the effect of the electronegativity difference on the degree of penetration of the atoms involved in the D–X bond in deuterium halides in the solid state178–180 and of the sp3 C–X bonds in the CSD. The single bonds appear in a region of penetrations of around 100%, compared to the maximum value achieved by the half-bonds (80%). In addition, there is a less pronounced but clear dependence on the electronegativity difference, with the penetration index decreasing as the electronegativity difference increases.
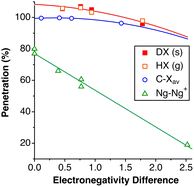 | ||
| Fig. 29 Dependence of the penetration indices of the Ng–Ng+ half bonds and the deuterium-X and Csp3–X single bonds on the difference of the electronegativity of the two bonded atoms. Ng stands for noble gas, and X for a halogen; data from the gas phase are shown with empty symbols, and from the solid state with filled symbols. Data are provided in the ESI (Table S24).‡ | ||
An illustrative example of more complex molecules in which penetration indices may conveniently differentiate non-coordinated from one- and two-electron σ bonds is provided by 5,5′-biphenyl-2,2′-diylbis(5H-dibenzo[b,d]borole and its anion (8 in Chart 4). The pristine neutral molecule adopts the syn conformation shown in 7, which places one boron atom on top of the other, at 2.95 Å,181,182 with a degree of interpenetration pBB of 41%, pointing to some sort of weak interaction, similar to that found in a phenanthroline diborole (pBB = 38%).183
One-electron reduction of 7 yielded compound 8 which was characterized by EPR and X-ray crystallography, showing a shorter B–B distance of 2.265 Å (pBB = 73%). Such a shortened distance must be attributed to a one-electron B–B σ bond.184 In the dianion 9, with coordinatively and electronically saturated B atoms, they are well separated, at pBB = −54%. For comparison, the single B–B bond found for Br2B–BBr2 in the gas phase (1.689 Å)185 and those that appear in 20 structures (30 crystallographically independent molecules) of the triangular B3H8− anion (10) have all penetration indices in the range 94–98%. Those degrees of B–B penetration are seen to be similar to those of the simpler one- and two- σ-electron molecules just discussed (Chart 4).
The Ga3R4 radical186 has the shape of an isosceles triangle with two sides corresponding to Ga–Ga single bonds (11) and the third one forming a longer one-electron σ-bond, the penetration index decreasing from 95 to 80%. Notice the similar degrees of penetration shown by the B–B and Ga–Ga one-electron bonds in 8 and 11, respectively. To provide a broader picture, we plot in Fig. 30 the ranges of penetrations in structures found in the CSD (Table S23 in the ESI‡) for single, double and triple Al–Al and Ga–Ga bonds, as well as compounds with formal Al–Al187 and Ga–Ga188,189 bond orders of 1.5.188,189
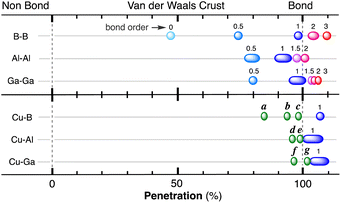 | ||
| Fig. 30 Map of penetration indices for some group 13 homonuclear pairs with bond orders from 0 to 3 (above) and for Cu–E pairs in compounds 12 and 13 (below, E = B, Al, Ga). Numerical data are provided in the ESI (Table S23).‡a, b and c represent the three species [Cu(TPB)]n, with n = +1, 0 and −1, respectively; d and f refer to compounds 13 with M = Al and Ga, respectively, and e and g refer to the cationic complexes 13+, with M = Al and Ga, respectively. | ||
The trisphosphine ligand TPB (tris[2-(diisopropylphosphino)-phenyl]borane) 12 forms complexes with several transition metals: Fe, Co, Ni, Pd, Pt, Cu, Ag and Au.190–192 As in the case of silatranes discussed below, the molecular topology places the metal and boron atoms at relatively short distances, such that the M⋯B penetration indices are in the range 72–99%. The metal atoms are in a good position to act as donors to the empty p orbital of boron. A nice fine-tuning of the interaction was achieved by Peters and co-workers via the reduction of the Cu(I) complex, characterizing three species [Cu(TPB)]1+, 0, 1, that present increasing degrees of interpenetration of the Cu and B van der Waals crusts as the charge becomes more negative: 84, 94 and 98% (points a, b and c, respectively, in Fig. 30). Even if the authors assign Cu–B bond orders 0, 1/2 and 1, respectively, we think that these molecules present a three-orbital interaction pattern that involves essentially the z2 and pz orbitals of Cu and pz of B, resulting in a non-negligible degree of Cu → B dative bonding even for the cationic complex, consistent with its high penetration index. For comparison, the one-electron B–B bonds discussed above have penetrations of less than 80% (Fig. 28), those of H2+ and LiH+ are 75 and 65%, while the Me3N–BF3 and H3N–BH3 adducts have penetration indices of 94–96%, and the unsupported single Cu–B bonds in the CSD, 108(1)%.
The related cationic complexes 13+ reported by Graziano et al.193 feature short Cu⋯M distances (M = Al, Ga), corresponding to penetration indices of 96 and 98% for Al and Ga (points d and f in Fig. 31), respectively. Their one-electron reduction results in an enhanced penetration (100 and 104%, points e and g in Fig. 31, respectively). Again, comparison with the penetration indices of canonical one-electron bonds in LiH+ and H2+ and compounds 8 and 11 (from 65 to 80%) suggests that three, rather than one, electrons are involved in Cu–M bonding in the neutral compounds 13. We think that the attribution of a one-electron bond character to the Cu–M atom pair is an oversimplification of a more sophisticated bonding scheme along the N–M–Cu molecular axis that involves 5 electrons and up to 6 atomic orbitals (s, pz and z2 of Cu, s and pz of M and the N lone pair orbital).
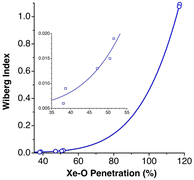 | ||
| Fig. 31 Relationship between the Wiberg bond order200 and the Xe–O penetration index in the adduct of XeO3 with the crown ether 15-crown-5, covering both the Xe–O bonds (large Xe–O penetration indices) and the Xe⋯O contacts with the five crown oxygens (small penetration indices), shown in an expanded view in the inset (see ESI, Table S25).‡ | ||
In these systems, the interpenetration is forced mechanically, i.e., by a rigid framework of covalent bonds that keep two non-bonded or weakly bonded atoms at a relatively short distance, as happens in silatranes, tripod ligands and iron maiden compounds,194 discussed in other sections of this work. A recently reported Ni0·NiI half bond195 has a penetration index of 93.5%, remarkably similar to those found in this section for Cu·Al, Cu·Ga and N·B half bonds.
In a thoughtful account of one-electron bonds,196 Oliveira de Sousa and Nascimento state that one-electron bonds are not “half-bonds”, since the difference in the bond dissociation energies of one- and two-electron bonds has no relation to bond orders. A similar energetic consideration should apply to the comparison of single, double and triple bonds. We note that the penetration of the van der Waals cores shows the same behaviour, and their values for one- and two-electron bonds are much closer to a 1![[thin space (1/6-em)]](https://www.rsc.org/images/entities/char_2009.gif) :
:![[thin space (1/6-em)]](https://www.rsc.org/images/entities/char_2009.gif) 1 than to a 1
1 than to a 1![[thin space (1/6-em)]](https://www.rsc.org/images/entities/char_2009.gif) :
:![[thin space (1/6-em)]](https://www.rsc.org/images/entities/char_2009.gif) 2 ratio, and analogous conclusions can be drawn upon comparison of the penetration indices of single, double and triple bonds. We note, however, that the definition of a bond order is related to the relative occupation of bonding and antibonding molecular orbitals, and from this point of view, a bond order of one-half should be assigned to both one- and three-σ-electron bonds.
2 ratio, and analogous conclusions can be drawn upon comparison of the penetration indices of single, double and triple bonds. We note, however, that the definition of a bond order is related to the relative occupation of bonding and antibonding molecular orbitals, and from this point of view, a bond order of one-half should be assigned to both one- and three-σ-electron bonds.
In the (NHC)B![[triple bond, length as m-dash]](https://www.rsc.org/images/entities/char_e002.gif) B(NHC) compounds,197,198 the B–B bond lengths of 1.45 Å (PBB = 111%) are clearly differentiated from double bonds in the penetration map (Fig. 30). It is interesting to observe that such high penetrations coexist with contacts between the H atoms of the substituents at the carbenes at distances as short as 2.33 Å, or a penetration pHH = 52%, much higher than that found for two interacting methane molecules (−5% or less, depending on the computational method used199).
B(NHC) compounds,197,198 the B–B bond lengths of 1.45 Å (PBB = 111%) are clearly differentiated from double bonds in the penetration map (Fig. 30). It is interesting to observe that such high penetrations coexist with contacts between the H atoms of the substituents at the carbenes at distances as short as 2.33 Å, or a penetration pHH = 52%, much higher than that found for two interacting methane molecules (−5% or less, depending on the computational method used199).
In the host–guest complex of XeO3 within a crown ether obtained by Schrobilgen and coworkers,200 the calculated Wiberg bond orders for both the Xe–O bonds and the Xe⋯O contacts present an interesting correlation with the corresponding penetration indices, reflecting an “all or nothing” situation (Fig. 31). Notice that the correlation represents not only the wide picture of high vs. low penetrations but also how the small variations in penetration are correlated with tiny variations in the Wiberg bond orders, as seen in the inset of Fig. 31. It is interesting to note that the same XeO3 molecule, co-crystallized with pyridine or p-(NMe2)-pyridine201 presents three X⋯N contacts at penetration indices (61–68%) not that different from those of the three Xe⋯O shortest ones in the 15-crown-5 compound (47–52%).
Electron-deficient bonds
Boranes
Diborane is a prototypical molecule with three-centre two-electron bonds (3c–2e), and it is an inescapable target of our study to calibrate the degrees of penetration that might be characteristic of electron-deficient bonds. In 7 different structural determinations in the gas phase, the B–H penetrations are 91.3% for the bridging hydrides, compared to 97.4% for the bonds to terminal hydrogen atoms. Interestingly, even if we usually think of (and depict) diborane as having two “banana bonds” covering the two B–H–B groups, we find that the B–B penetration is 96.1%, as high as the B–H ones and only slightly less than the two-electron B–B bonds (Fig. 30). Similar values are found for the organoboron analogues R2B(μ-H)2BR2: 94(1)% for the B–B and the same value for the B-μH penetrations (49 crystallographically independent data sets from the CSD).The related electron deficient B3H8− anion (10 in Chart 4) appears with various countercations in 22 crystallographically independent molecules found in the CSD with the usual restrictions (no disorder, R ≤ 7.5%). The average B–B penetration in this family is 94.8(9)%, almost identical to that in diborane, with no significant difference between the bridged and unbridged edges.
It is important to stress that the penetration in 3c–2e bonds is only slightly less than that in two-electron bonds. We think that this fact reflects a similar degree of overlap between valence orbitals of the two atoms required in both cases. A similar finding was mentioned for one-electron bonds. Thus, the different strength of one-electron, 3c–2e, and two-electron bonds reside in the different occupations of a σ-bonding MO (one- and two-electron bonds) or in the molecular topology that facilitates the formation of delocalized bonding between more than two atoms (3c–2e and two-electron bonds).
Two-electron bridging ligands
An important case of electron-deficient bonding is that of a hydride bridging two or more transition metals. The van der Waals crust formalism offers us a unique opportunity to check if one can find a common trend for all transition metals. To give a rough idea of the far-reaching applicability of the penetration indices, we have analysed for this study 8565 crystallographically independent data sets for 32 metals and 6 bonding modes (from non-bridging to μ6) of hydrido-bridged compounds. The results are represented by plotting the ranges of values found as a function of the number of metal atoms bridged by a hydride (Fig. 32a), where we see a clear tendency to go from a full bond (penetrations higher than 100%) to lower penetrations as the two electrons of the donor are shared by an increasing number of metal atoms, despite the different number of bridged metal atoms considered and the usual uncertainty in the hydrogen atom position in the X-ray structural determinations. | ||
| Fig. 32 (a) Ranges of M–H penetration indices for transition metal complexes with a terminal (n = 0) and bridging hydride (n = 2–6) ligand as a function of the nuclearity n. The superimposed narrower bar for n = 1 corresponds to neutron diffraction structures or X-ray structures with a deuteride ligand. (b) Correlation between the M–M and M–H penetrations in μ4-H tetrahedral tetranuclear complexes with (triangles) and without (squares) metal–metal bonds. (c) Ranges of M–C penetration indices for transition metals with a terminal and bridging carbonyl ligand as a function of the nuclearity n. The ranges are centred at the position of the maximum, and the extent of the bar corresponds to the width at half-height of the Gaussian distribution of the p values. Data are provided in the ESI (Table S26).‡ | ||
In the case of tetrahedral arrays of four metal atoms with a μ4 bridging hydride, two distinct cases are found, depending on whether the metal atoms form metal–metal bonds or are essentially held together by the hydride. In both cases, however, the M–H and M–M penetrations show nice linear correlations (Fig. 32b).
A similar analysis has been carried out for carbonyl-bridging compounds, also a highly frequent motif in transition metal chemistry, whence the lone pair of the carbonyl can be shared by two or more metal atoms at edges or faces, or even in the centre of clusters. From 285![[thin space (1/6-em)]](https://www.rsc.org/images/entities/char_2009.gif) 148 crystallographically independent data sets of 26 different metals in 4 coordination modes (from terminal coordination to μ4 bridges) we can deduce the ranges of penetration values for each nuclearity (Fig. 32c). Again, we see a clear tendency to go from a full bond (penetrations of a 100% or higher) in terminal M–CO links to lower penetrations as the two electrons of the donor are shared by an increasing number of metal atoms. The curve for the carbonyl-bridged systems is shifted to higher penetration values than that for the hydrido-bridged ones, undoubtedly an indication of the ability of CO to use both σ and π orbitals for bonding.
148 crystallographically independent data sets of 26 different metals in 4 coordination modes (from terminal coordination to μ4 bridges) we can deduce the ranges of penetration values for each nuclearity (Fig. 32c). Again, we see a clear tendency to go from a full bond (penetrations of a 100% or higher) in terminal M–CO links to lower penetrations as the two electrons of the donor are shared by an increasing number of metal atoms. The curve for the carbonyl-bridged systems is shifted to higher penetration values than that for the hydrido-bridged ones, undoubtedly an indication of the ability of CO to use both σ and π orbitals for bonding.
To complement this study, it is useful to briefly analyse the case of semi-bridging carbonyl202 ligands (Fig. 33a), limiting our analysis to the M–C![[triple bond, length as m-dash]](https://www.rsc.org/images/entities/char_e002.gif) O fragments with angles between 160 and 180°. In those M–CO-m systems, the penetration of the σ M–C bond in all molecules is higher than that of the C-m bond which implies the π system of the carbonyl, with an average difference of 16%. The penetration indices of the O-m bond are also around the 100% mark, similar to or slightly smaller than the C-m bonds that show a higher dispersion. Metals found at the M position are Ti, Mn, Co, Nb, Mo, W and Re, and at the m position Y, Ti, Mn, Zr, Nb and Mo. An exception to the general behaviour just described are the compounds with a purported semi-bridging carbonyl between a Mo atom and a d10 ion (CuI or AgI),203 whose m-C penetrations are smaller (70–78%) and m-O ones much smaller (30–39%) than those in all other cases.
O fragments with angles between 160 and 180°. In those M–CO-m systems, the penetration of the σ M–C bond in all molecules is higher than that of the C-m bond which implies the π system of the carbonyl, with an average difference of 16%. The penetration indices of the O-m bond are also around the 100% mark, similar to or slightly smaller than the C-m bonds that show a higher dispersion. Metals found at the M position are Ti, Mn, Co, Nb, Mo, W and Re, and at the m position Y, Ti, Mn, Zr, Nb and Mo. An exception to the general behaviour just described are the compounds with a purported semi-bridging carbonyl between a Mo atom and a d10 ion (CuI or AgI),203 whose m-C penetrations are smaller (70–78%) and m-O ones much smaller (30–39%) than those in all other cases.
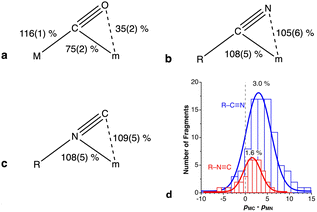 | ||
Fig. 33 Ranges of penetration indices for the different bonds in (a) semibridging carbonyl complexes, (b) η2-coordinated nitriles and (c) η2-coordinated isonitriles. (d) Distribution of the difference between the m-C and m-N penetrations in η2-nitrile (R–C![[triple bond, length as m-dash]](https://www.rsc.org/images/entities/char_e002.gif) N) and isonitrile (R–N N) and isonitrile (R–N![[triple bond, length as m-dash]](https://www.rsc.org/images/entities/char_e002.gif) C) complexes of transition metals. The values indicated at the tip of each peak are the positions of the maxima of Gaussian distribution fittings. Data are provided in the ESI (Tables S27 and S28).‡ C) complexes of transition metals. The values indicated at the tip of each peak are the positions of the maxima of Gaussian distribution fittings. Data are provided in the ESI (Tables S27 and S28).‡ | ||
In contrast to the semi-bridging carbonyls, which present an m-C penetration 8% higher on average than the m-O one, in the η2-nitrile and isonitrile complexes the m-C and m-N penetrations (Fig. 33b–d) are rather similar, with the former being on average 2% higher in the nitriles and 1% in the isonitriles. Data are provided in ESI, Table S28.‡
Noble gas – Lewis acid adducts
As the simplest example of donor–acceptor interactions between two neutral fragments, we consider the family of coordinative bonds between a noble gas (Ng) and a d10 M–X group, [Ng → M–X], where Ng = Ne, Kr, Ar, Xe; M = Cu, Ag, Au; X = F, Cl, Br, I), for which there is a reasonable amount of structural data obtained in the gas phase.In Fig. 34 we represent the Ng–M penetration in the [Ng → M–X] complexes as a function of the row of the periodic table of X (i.e., the principal quantum number n of its valence shell) for several combinations of noble gas and metal atoms. Such a plot allows us to analyse the effect of each of the three components of this family of molecules: (i) the halide X produces a significant trans influence on the Ng–M bond, whose penetration decreases linearly as we descend the halogen group, from F (98%) to I (92%), most clearly seen for the Ar → Ag–X series. (ii) Changing the noble gas from Ar to Kr affects little the degree of penetration for the same M–X fragment, with only a slight increase (of about 2%), even smaller than that effected by changing the halide. However, on going from Kr to Xe there is a larger increase in the penetration (around 7%). (iii) Surprisingly, the effect of the transition metal atom follows the opposite trend from that of the noble gas, with the penetration significantly decreasing as we descend the group from Cu to Ag (6–10%) and slightly increasing from Ag to Au (around 2%), undoubtedly related to the slightly smaller atomic radius of Au compared to Ag, due to the lanthanide contraction.
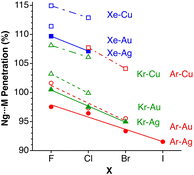 | ||
| Fig. 34 Penetration indices of the Ng–M bonds in Ng–M–X complexes in the gas phase (Ng = Ne, Ar, Kr, Xe; M = Cu, Ag, Au; and X = F, Cl, Br, I), represented as a function of the period of X. Data provided in the ESI (Table S29).‡ | ||
Silatranes, germatranes and [1.1.1]propellanes
Silatranes and germatranes
Silatranes are tripod-like molecules with the topology shown in 14–15, in which the pivotal nitrogen atom can be at varying distances from a group 14 atom (X), formally establishing an N → X donor–acceptor bond that makes X five coordinated, or keeping N and X at a longer distance, with X presenting a tetrahedral geometry and N retaining its lone pair with a pyramidal structure. Although there are multiple variations of the basic scheme shown here,204 the most common examples are silatranes (X = Si and Y = O), azasilatranes (X = Si and Y = NR) and germatranes (X = Ge and Y = O).In these compounds, however, the X⋯N distances cannot be too long due to the geometrical constraints of the tricyclic system and, correspondingly, the penetration indices cannot be too small. In the set of structures of sila- and germatranes retrieved from the CSD and gas phase structures from the MOGADOC database, we obtain a wide dispersion of penetration indices, between 14 and 98%. Such a wide interval no doubt includes molecules with and without X⋯N bonding interactions, so we opted for simultaneously calibrating the degree of pyramidalization of the X atom, defined as the C–N⋯X angle (α), which should be close to the tetrahedral angle (109.4°) when there is an N–X bond, but significantly smaller in the absence of a bonding interaction, reaching values below 90° for molecules in the exo conformation (16).
A scatterplot of the two parameters (Fig. 35a and b) shows that the Si and Ge compounds have the same behaviour, with a nice quadratic correlation between the C–N⋯X angle and the N⋯X penetration. Moreover, we can clearly distinguish two sets of structures: those with angles in the range 75–98° have penetration indices of 14–58%, corresponding clearly to molecules with no N–X bond, whose X and Si van der Waals crust interpenetrations are small enough to qualify for a bond, but large enough to produce some degree of orbital interaction that could compensate for an enhanced Pauli repulsion at such relatively short distances. The second set of points, much more abundant, cover the ranges 101–107° and 66–98% for the C–N⋯X angle and the N⋯X penetration index, respectively, clearly indicating the presence of an X–N bond. Looking now at the related fosfatranes (Fig. 35b), we find a similar behaviour and the common limit for the bonding regime corresponds to the values pXN > 63%, X⋯N–C > 101° (data provided in ESI, Table S30).‡
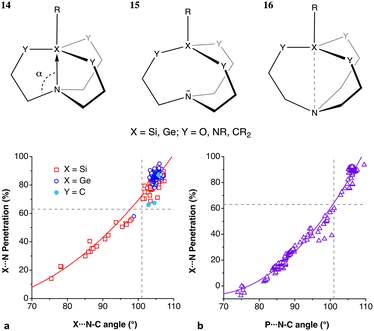 | ||
| Fig. 35 Scatterplots of the X⋯N penetration indices and the average X⋯N–C angle for (a) silatranes (X = Si), germatranes (X = Ge) and (b) fosfatranes (X = P). The least-squares curves are fittings to all the data shown in each plot; the dashed lines delimit the regions with X–N bonds (upper right section) and with varying degrees of X⋯N noncovalent interactions (lower left section). Data are provided in the ESI (Table S30).‡ | ||
[1.1.1]Propellanes and bicyclo[1.1.1]pentane
In the family of bicyclo[1.1.1]pentane derivatives (17) the two apical carbon atoms are constrained at a relatively short distance of 1.90(2) Å (average of 216 data sets from X-ray structures) by the bridging CR2 groups. Although no bond can be formally assigned between those two atoms, the interpenetration of their van der Waals crusts is large, with an average index of 81(1)%, comparable to the typical values in one-electron bonds discussed above. In contrast, the related [1.1.1]propellanes (18), despite the unusual coordination of the apical carbon atoms, present a much higher average penetration index of 99.7 (3)% (11 data sets from X-ray crystal structures), as one would expect for a regular single bond between tetrahedral carbon atoms. Interestingly, the peripheral C–C bonds are very similar in the two cases, with penetration indices of 100(3) and 98(4)% in 17 and 18 respectively. The distribution of penetration indices (Fig. 36) shows a binary situation with a gap separating the structures with and without an axial C–C bond. It is also to be noted that the wing and central C–C bonds in propellane, which are described according to valence bond calculations as having different bond types, covalent and charge-shift, respectively,205 have identical interpenetration of the van der Waals crusts of the bonded atoms.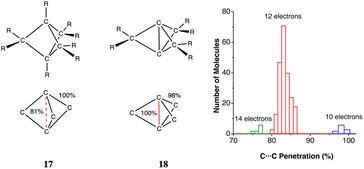 | ||
| Fig. 36 Distribution of the penetration indices between the two apical atoms in trigonal bipyramidal C5 cores 17 and 18, depending on the framework electron count. Data were compiled from 238 crystallographically independent molecules in the CSD (Table S31 in the ESI‡). | ||
We have shown earlier that [1.1.1]propellanes and bicyclo[1.1.1]pentanes are members of a wider family of compounds that comprise trinuclear transition metal complexes with two μ3 bridging ligands in an M3X2 core.206 Among those compounds, the propellane-like structure (17) with a short X–X distance appears when the number of framework electrons (FEC) is equal to 10, whereas the open structure without an X–X bond (18) appears for an FEC of 12. The organic C5 analogues analysed obey the electron counting rules, as seen in Fig. 36. Moreover, we find a group of 6 compounds with type 18 structures and 14 framework electrons with still smaller penetration between the two apical atoms, 76.1 (7)%.
Long C–C bonds
The interest in long carbon–carbon bonds has materialized in the last few years in several experimental and computational reports.17,113,207–210 In the context of this work, it is interesting to calibrate what a “long bond” means in terms of penetration indices. Let us consider the C–C distances in dicarbadodecaboranes, R2C2B10H10, which have been noted to be quite long.211 In a CSD search for crystal structures of such compounds, without disorder and an agreement factor R ≤ 10%, we have found 2515 crystallographically independent distances, covering the range between 1.429 and 2.156 Å, i.e., penetration indices from 68.5 to 104.5%, with an average of 92(2)%. The penetration indices significantly smaller than the 100% expected for a covalent C–C single bond can be attributed to their electron-deficient nature, while the dispersion of the penetration indices should be attributed to electronic and steric effects of the substituents at the carbon atoms.With a different approach, Schreiner and co-workers obtained long C–C bonds between adamantyl, diamantyl and triamantyl groups.208 The longest distance, 1.704 Å, appears in the diamantyl-triamantyl compound, in which the C–C penetration is 91% (19). Its high stability towards dissociation despite the long bond distance was attributed to the existence of several H⋯H contacts between the diamantyl and triamantyl groups in the range 1.9–2.6 Å, i.e., twelve interactions with penetration indices of 10 to 28%, comparable to those found above for O–H⋯N hydrogen bonds.
In a quite different chemical system, a long Pb–Pb bond in a diplumbylene compound with SiMe3 groups close to the Pb atoms,212 a similar Pb⋯Pb penetration results from the X-ray data, 94%, supplemented by a wealth of H⋯H contacts with penetrations as high as 22%. In a recent review,207 Power has also discussed the effect of H⋯H dispersion interactions between bulky ligands on the element–element bond distances of a variety of organometallic and inorganic compounds. In summary, the long carbon–carbon two-electron bond in 19 has a penetration index of 91%, while in the dicarbadodecaborates, R2C2B10H10, they can range from 68 to 104%, with an average of 92(2)%.
The radical anion of tetracyanoethylene (TCNE˙−, 20) has shown a tendency to form dimers with C⋯C inter-radical distances of 2.80–3.10 Å. The penetration index for each one-electron C–C bond adopts values between 22 and 37% (the average and standard deviation for 24 structural data sets are shown in 21). Those values are significantly smaller than those found for other one-electron bonds in a previous section of this work, higher than 50% in all cases (Fig. 28 and 29). The long C–C distances have been attributed to the electrostatic repulsion between the two anionic monomers, but a qualitative MO interaction diagram (Fig. 37) points to a strong Pauli repulsion between the π bonding MOs, which is absent in other one-electron bonds analysed here. The C![[double bond, length as m-dash]](https://www.rsc.org/images/entities/char_e001.gif) C double bonds, in contrast, are little affected by the combined effect of occupying with one electron the π* orbital and the formation of the dimer (21) which can be explained by the formation of one-electron bonds between the unpaired electrons occupying the π* orbital of each monomer213 (Fig. 37).
C double bonds, in contrast, are little affected by the combined effect of occupying with one electron the π* orbital and the formation of the dimer (21) which can be explained by the formation of one-electron bonds between the unpaired electrons occupying the π* orbital of each monomer213 (Fig. 37).
Metal-cyclopentadienide η5- and metal–benzene η6-bonding
The cyclopentadienide anion, C5H5− (abbreviated Cp), and its ability to coordinate in an η5 mode (i.e., through the five carbon atoms of the ring simultaneously) to a Lewis acid, has been a cornerstone for the explosive ongoing development of organometallic chemistry since the middle of the last century. This anion and a variety of differently substituted derivatives appear as M(η5-C5R5) fragments in well over 60![[thin space (1/6-em)]](https://www.rsc.org/images/entities/char_2009.gif) 000 crystal structures in the CSD, including the quite common and versatile (η5-C5Me5) ring, abbreviated as Cp*. For simplicity, we will use in what follows the symbol Cp for any cyclopentadienide derivative, regardless of its substitution pattern. The wide family of molecules with an MCp fragment, thus, appears as an excellent target for a study of the interpenetration of the van der Waals crusts of the M and C atoms. We have therefore calculated penetration indices from the average M–C distance found in the CSD for η5-coordinated cyclopentadienides with most of the naturally occurring chemical elements, and the results are graphically displayed in Fig. 38, summarizing data for 117
000 crystal structures in the CSD, including the quite common and versatile (η5-C5Me5) ring, abbreviated as Cp*. For simplicity, we will use in what follows the symbol Cp for any cyclopentadienide derivative, regardless of its substitution pattern. The wide family of molecules with an MCp fragment, thus, appears as an excellent target for a study of the interpenetration of the van der Waals crusts of the M and C atoms. We have therefore calculated penetration indices from the average M–C distance found in the CSD for η5-coordinated cyclopentadienides with most of the naturally occurring chemical elements, and the results are graphically displayed in Fig. 38, summarizing data for 117![[thin space (1/6-em)]](https://www.rsc.org/images/entities/char_2009.gif) 278 independent MCp fragments of 73 elements.
278 independent MCp fragments of 73 elements.
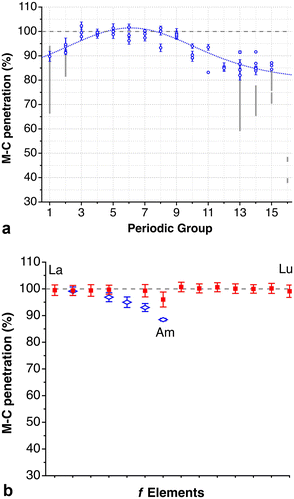 | ||
| Fig. 38 M–C penetration indices and esds in M(η5-C5R5) groups, where M is any element of groups 1–16 (a) or a rare earth (b). The continuous line is provided only as a guide to the eye; the dashed line marks the 100% value. For main group elements, the grey bars indicate the averages (± one standard deviation) of hypercoordinated MCp fragments, while the circles correspond to those fragments that obey the octet rule (Chart 5). Data are provided in the ESI (Table S32).‡ | ||
Let us first discuss the behaviour of the transition metal-containing MCp groups, for which the following observations can be made: (a) most transition metals of groups 3–9 show penetrations characteristic of metal-carbon σ bonds, i.e., between 90 and 105%; (b) the behaviour of the transition metals of the same group presents practically the same penetration values, regardless of their period; (c) Zn and Cd present smaller penetrations, at around 85%, and so does the only identified AgCp fragment in [(η5-C5H2(SiMe3)3AgPnBu3],214 most likely due to the closed shell nature of their d orbitals that cannot, therefore, act as acceptors as in earlier transition metals. Substantial modification of the electronic properties of the Cp ring through the recent introduction215 of the perfluorinated Cp* ligand, C5(CF3)5−, gives penetration indices of 95% in two Rh complexes, well within the range presented by a large number of known RhCp fragments.
The main group MCp fragments deserve a more detailed discussion. On average, they have significantly lower penetration indices than the transition metal analogues as well as wider dispersion. A detailed analysis of the structural data reveals that the smaller penetrations are associated with the hypercoordination of the M atom (represented by the grey bars in Fig. 39a), whereas those fragments that obey the octet rule (represented by blue circles) have penetration indices similar to those of transition metals of groups 10–12. Record low penetrations are found in the three group 16 compounds, Cp*SePh3, Cp*TePh3, and Me4CpTePh3.216
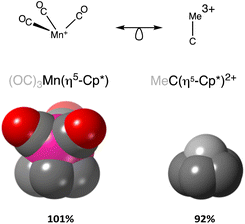 | ||
| Fig. 39 Space-filling models of [(OC)3MnCp*] and the Hogeveen dication (MeC–Cp*)2+, and the corresponding Mn–C and C–C penetration indices. The methyl groups are omitted for clarity. | ||
Central to the series of electron precise main group MCp fragments is the MeC-(η5-C5Me5)2+ cation (Chart 5), commonly referred to as Hogeveen's dication, with a penetration index close to those of transition metals (92%). This carbocation was prepared and characterized by NMR in 1973,217,218 and its structure has been confirmed by X-ray crystallography quite recently.219 In the meantime, Hoffmann established its isolobal analogy with an MCp fragment220 that explains the transition metal-like behaviour of this carbocation. Such an analogy makes the Mn(CO)3+ and CMe3+ fragments orbitally and electronically comparable and, combined with the anionic aromatic Cp* ring, makes the Hogeveen dication isolobal to the [(OC)3MnCp*] complex (Fig. 39).
 | ||
| Chart 5 Main group MCp fragments that follow the octet rule, and an example of a similar Sn compound that does not follow the octet rule. | ||
Isoelectronic groups extend the isolobal analogy for the five early s and p groups (Chart 5), including MCp molecular ions of Si, Ge, Sn, Pb, P, As and Sb. The hypercoordinated fragments appear, e.g., in the MCp2 sandwich compounds and in molecules with more than one extra ligand at the M atom, such as ClSnCp (Chart 5),221 formally a tin(II) compound, in which the Sn–Cl bond forms an angle with the symmetry axis of Cp of 117° to make room for the lone pair, thus leaving only two sp3 hybrids available for bonding with Cp, i.e., not isolobal with Hogeveen's dication.
While no structures of cyclopentadienide-noble gas fragments have been found, some argon adducts with isoelectronic neutral rings have been determined in the gas phase: pyrrole,222 pyrazole,223 imidazole224 and furan.225,226 In all these cases, the average Ar–E penetrations for each compound (E = C, N or O) are around 0%, clearly indicating the van der Waals nature of these complexes. Finally, the rare earths show a quite homogeneous behaviour (Fig. 38b), with penetration indices very close to 100%. The actinides, in contrast, show a continuous decrease from U to Am, with the latter having an average pAmC value of 88.5(5)%.
Given the excellent performance of the penetration indices for the description of bonding in MCp groups throughout the periodic table, it is natural to turn to the bonds and/or contacts of elements with arenes in an η6-mode. Moreover, given the similar behaviour found for elements of the same group, we go a step further and look now at the E–C penetration indices of all the elements of a group combined. The results of such a study are summarized in Fig. 40. The first thing we see in this figure is that MBz fragments of transition metals of groups 3–11, as well as those of rare earths, behave similarly to those of MCp systems, with penetrations close to 100%. Among group 11 compounds, several structures coded as η6-coordinated have hapticities of 4 or lower, notably the carbene complexes (NHC)Cu-Bz,227,228 in which the difference between the shortest and longest Cu–CBz distance is in the range 0.6–1.0 Å, that are not included in Fig. 40. In other compounds from this group, the metal atom is hypercoordinated and the M–Bz penetration is much smaller. The group 12 metals show a very different behaviour, and they are found connected in an η6-mode only by non-covalent contacts with a correspondingly low average penetration index of 26(3)%. The lanthanide (Ln) and actinide (An) families are represented in Fig. 40 by the averages of each of the f series, 87(5) and 96(10)%, respectively.
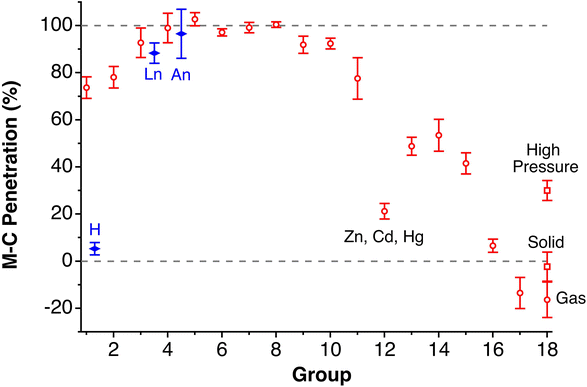 | ||
| Fig. 40 E–C penetration indices and esds for all elements of the same periodic group in η6-bonded or weakly interacting E–benzene fragments (circles). The diamonds represent the average values and esds of all the lanthanides (Ln) and actinides (An) η6-coordinated by benzene, placed close to group 3 elements for comparison and of the intermolecular H⋯benzene contacts. The data for groups 1, 2, 16, 17, and 18 have been retrieved as intermolecular contacts. Data are provided in the ESI (Table S32).‡ | ||
The MBz fragments, where M is a group 1 element, behave similarly to the transition metal-containing MCp fragments, with somewhat smaller penetrations than the transition metals. These are further separated in electron precise and hypercoordinated situations, with average values of pMC of 82(3)% and 72(5%), respectively. The highest penetration within this group in electron precise complexes, 87%, is found for the interaction of the highly charged arene C6H3(BMe3)33− with Li(thf)+,229 undoubtedly favoured by a strong coulombic attraction. A slightly higher penetration, however, appears for a hypercoordinated Cs compound.230 Unlike alkaline ions, the proton is not found as an η6 adduct with benzene, which corresponds to a high energy second order transition state,231 but it forms a σ bond with one carbon atom. A covalently bonded hydrogen atom R–H, however, can establish η6 noncovalent interactions through small positive RH⋯C penetrations, with an average penetration index of 5(3)%, indicative of essentially dispersion-governed interactions.
Alkaline-earth MBz fragments also reach relatively high penetrations, with an average index of 80 (6)%, most likely due to the supplementary coulombic attraction of the alkaline-earth cations. The highest penetration (96%) is found in a half-sandwich Ca complex,232 and penetrations in excess of 80% are found as well for Mg,233 Sr,234 and Ba,235 and similar values are obtained from the calculated distances236 for Ca, Sr and Ba (84–92%). The Mg and Ca ions coordinated by NacNac (abbreviation for the ligands with the pentane-1,3-diiminato skeleton, 22) are found bonded to aryl rings that achieve in general quite high penetrations, in the range 78–95%.237–240 The recently reported241 Be2Cp2 fits nicely into this picture.
The elements of groups 13–15 present penetration indices significantly lower than those of the earlier groups, except for the Zn group. They are coded in the CSD as bonded, and slight differences appear between the electron precise and hypercoordinated systems, except for the group 15 ones, for which no electron precise structures have been found. It is interesting to stress the presence of pristine group 13 MBz+ molecular cations with hemispherical coordination, whose electronic structure is schematically depicted in 23, where M is Ga,242,243 In244 or Tl,245 all with similar penetration indices between 50 and 62%.
The elements of the rightmost two groups, the halides and the noble gases, have negative average penetration indices, −13(7) and −17(8)% for groups 17 and 18, respectively. Such a small approach points to purely dispersion-dominated interactions with the arene rings. The penetration indices with the noble gases, moreover, are seen to increase asymptotically with the covalent radius (Fig. 41), a result that is consistent with the dependence of the London attraction on the polarizability which, in turn, increases with the atomic number of the interacting atoms,246 according to the Fajans rules.
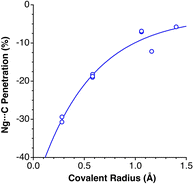 | ||
| Fig. 41 Dependence of the noble gas-benzene penetration index on the covalent radius of the former. The line shown is a fitting to an exponential function with a limiting value of −3%. Data are provided in the ESI (Table S33).‡ | ||
Ionic solids
In solid state chemistry it is common to analyse structural data using Shannon and Prewitt's ionic radii.247,248 It might thus, in principle, seem odd to use penetration indices for ionic solids, since they are defined based on the covalent and van der Waals radii. Certainly, the values of the ionic and covalent radii for a given element are quite different; in addition, while a covalent radius is representative of the distribution of bond distances of an element in different coordination numbers and oxidation states, the ionic radius is in most cases specific for only one oxidation state and a fixed coordination number. Yet, for a pair of elements with different electronegativities, their covalent radii sum is rather similar to the corresponding ionic radii sum in their common oxidation states. For instance, for the Ba–O couple, the covalent and ionic radii sums are 2.81 and 2.75 Å, respectively, or 2.60 and 2.71 Å for K and F. In some cases, they may even differ by 0.02 Å or less, well below the uncertainty of those atomic parameters, as for the Sr–Cl, Ba–Cl, As–O, Cs–F, Ca–F, Sr–F, Cs–Br, Cs–S and other atom pairs (more information provided in ESI, Table S40 and Fig. S8a‡). Further support for the use of covalent radii comes from the good agreement between the M–O distances in aqueous solution for a set of 33 monoatomic cations compiled by Marcus.249 For most of the main group and transition metal cations, the average deviation of the M–O distances from the covalent radii sum is less than 0.11 Å (see Fig. S8b in the ESI‡), and only for Ag+ and Hg2+ is it between 0.3 and 0.4 Å. The lanthanides, Y, and Th, show an excellent correlation between the two parameters, in such a way that the Ln–O distance is equal to the sum of covalent radii minus 0.19 Å.The NaCl structure
In one of the commonest and most symmetric solid-state structures of binary AX compounds, the NaCl structure, the main stabilizing factor is assumed to be the electrostatic attraction between neighbouring An+ and Xn− ions, counterbalanced in part by the anion–anion and cation–cation coulombic repulsions. These strictly ionic interactions are usually modelled with the well-known Madelung potential.250 In the face-centred cubic NaCl structure, the A⋯A and X⋯X distances are identical and are related to the A–X distance (24). But what if we consider this structure from the point of view of the penetration of the van der Waals crusts? Even with the same distance, each pair may have quite different penetrations, depending on the relative sizes of A and X and the width of their van der Waals crusts.Our present exploration focuses on a sample set of 103 structures of binary AX solids (see ESI, Table S34‡). In Fig. 42a we show the distribution of the A–X, A⋯A, and X⋯X penetration indices in that data set. Unsurprisingly, the A–X penetrations are centred around the 100% mark, showing that it is reasonable to use the same set of atomic radii for covalent and ionic bonds. It is also natural that the X⋯X penetrations are small or negative. In contrast, the A⋯A penetrations are rather large, their distribution sensibly overlapping with that of the A–X bonds, a fact that results from the generally larger size of the electropositive elements, compared to elements of groups 15–17 that form anions.6 In some cases, the “non-bonded” cation–cation penetration is even higher than the cation–anion one, as in CsD, CsF, FeD, CsF, NaD, BaO, LaN, and UC.
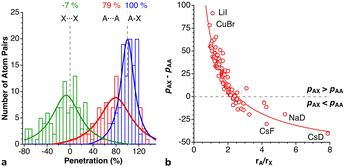 | ||
| Fig. 42 (a) Distribution of the cation–anion (A–X), cation–cation (A⋯A), and anion–anion (X⋯X) penetrations in a sample of 102 AX compounds with the NaCl structure. (b) Relationship between the difference in A–X and A⋯A penetrations and the ratio of covalent radii. Data are provided in the ESI (Table S34).‡ | ||
Given the relationship between the A–X and A⋯A distances imposed by the cubic symmetry (24), the differences between the A–X and A⋯A penetrations should depend on the relative size of atoms A and X, as can indeed be seen in Fig. 42b. There we see that the penetration between the two “non-bonded” cations (pAA) becomes higher than that between the bonded cation–anion pair (pAX) for a covalent radii ratio rA/rX higher than 2.5, which comprises compounds such as AmN, CmN, ZrC, HfC, VO, VN, MgO, and the high-temperature structure of CsCl. There are many binary compounds with smaller size ratios and pAX > pAA, in which the A–X penetration is much higher than the A⋯A one, as expected for bonding and non-bonding situations, respectively, including the case in which the cation and anion have the same size (rA/rX ≈ 1.0), as in the cases of PbTe, AgI, HgTe, InSb, LiBr, NaI, LiI and CuBr, or in the elemental fcc structures of Rh, Al, Cu, or La. At the other extreme of the curve, we find compounds in which the cation is much larger than the anion, of which there are only a few examples in our sample, notably deuterides/hydrides and CsF. The very high interpenetration between the Cs atoms in the latter compound (130%), compared to a standard 100% penetration for the Cs–F bonds, challenges the simple ionic model in this case, despite the large electronegativity difference between Cs and F, since it indicates a higher penetration of the van der Waals crusts of two ions of the same charge than for those of atoms with opposite charges.
The structure of NaCl itself, studied at variable temperatures or pressures (see ESI, Fig. S9‡), is highly illustrative of the effect of those external factors. The Na–Cl distance increases little under applied pressure, and the penetration correspondingly increases from 91% at ambient pressure to 104% at 31.1 GPa.251 In contrast, the non-bonded atom pairs become much closer, their penetration indices increasing from 60 to 118% (Na⋯Na) and from −22 to 39% (Cl⋯Cl) in the same pressure range. It is well known that the main effect of increasing the temperature on most solids is an expansion of the crystal lattice, i.e., a decrease in the interatomic penetrations, except for the special family of materials with a negative thermal expansion coefficient. However, the effect is rather small, compared to the effect of applied pressure, and in the case of NaCl, the penetrations decrease by only 5–6% for the Na–Cl bonds as well as for the Na⋯Na and Cl⋯Cl contacts on going from room temperature to 873 K. Interestingly, such a small interpenetration decrease seems to be enough to allow for a higher mobility of the sodium cations and to enhance the ionic conductivity by several orders of magnitude.252
The perovskite structure
Similarly to what is shown in the previous sub-section for binary compounds with the NaCl structure, we have carried out a penetration study on ABO3 compounds with a perovskite structure. In that structure, the B cations occupy octahedral sites and form strong coordination bonds with the oxo ions, whereas the more electropositive A cations are commonly considered to be held by electrostatic interactions in cubic O8 sites.The first case studied here is a prototypical perovskite, BaTiO3. The Ba–O, Ti–O and Ba–Ti interpenetrations decrease by at most 4% from room temperature to 1645 K. More interestingly, the Ti–O and Ba–Ti penetrations are practically identical, at around 115%, clearly higher than the still high 96–100% values of the Ba–O pairs. The other two perovskites explored, CaGeO3 and CaSnO3, present distinct penetration ranges for the three atom pairs considered, but all of them are within the 90 to 110% interval (see Fig. S10 in the ESI‡). The high penetration indices are consistent with the observation of Vegas and coworkers,253 that in MSnO3 perovskites (M = Ca, Sr, Ba) the MSn substructure has the same topology than the high-pressure structure of MSn alloys and, in the case of M = Ba, even the same unit cell parameters. In a wider context, much work has been devoted to the recognition of metal structures in metal compounds.254
Covalent bonds: single and multiple
Common main group element–element bonds
In this section, we wish to explore how the applicability of penetration indices can be extended to covalent bonds, from single to triple bonds between main group elements. To this end, we have analysed the penetration indices for some of the commonest bonds involving second-row elements. First, we look at the structures of simple prototypical molecules in the gas phase (Table 2), which seem to present a good correlation between the bond order and penetration index (Fig. 43a).| B. o. | C–C | N–N | O–O | C–O | C–N | Range |
|---|---|---|---|---|---|---|
| a C2H6. b Hydrazine. c H2O2. d Me2O. e MeNH2. f Benzene. g Pyridazine. h O3. i M(acetylacetonate)n (M = Mn, Cu, Zn; n = 2, 3). j Pyridine. k Ethylene. l N2Me2. m O2. n H2CO. o H2CNH. p C2H2+. q O2+. r CO+. s HCN+. t HCCH. u N2. v O22+.255 w CO. x HCN. y MeN3. | ||||||
| 1.0 | 99.4a | 98.6b | 91.6c | 100.5d | 100.4e | 92–101 |
| 1.5 | 106.3f | 104.6g | 102.8h | 107.7i | 106.7j | 103–107 |
| 2.0 | 109.2k | 108.9l | 106.5m | 110.2n | 110.1o | 106–110 |
| 2.5 | 113.1p | 115.2y | 112.1q | 116.5r | 113.1s | 112–117 |
| 3.0 | 115.6t | 116.9u | 116.3v | 115.8w | 116.2x | 116–117 |
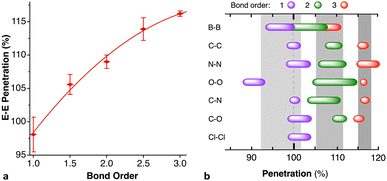 | ||
| Fig. 43 (a) Average penetration indices and esds found for element–element bonds with different bond orders in some prototypical compounds (Table 2) in the gas phase. (b) Progression of the penetration indices (average ± two standard deviations) of several single, double and triple element–element bonds, as deduced from the analysis of crystal structural data from the CSD (see ESI, Tables S35–S37‡). The shaded areas correspond to the ranges of values found for the gas phase bonds (Table 2). | ||
The good bond order-penetration index correlation found for a limited set of prototypical compounds in the gas phase might not be representative of what may happen for a much wider set of molecules. For this reason, we analysed the same element–element bonds in the CSD crystal structure database. The results, shown in Fig. 43b, indicate that, except for the relatively low penetration found in peroxides, all single bonds appear close to the 100% mark, the double bonds at around 108%, and the triple bonds at about 117%, consistent with the ranges found for our reduced set of gas phase molecules. For the specific case of the B–B bonds, we also show in the ESI‡ (Fig. S11) the dependence of the penetration on bond order similar to that shown in Fig. 43a for the CSD structures, including the non-bonding distance of compound 9 as an example of bond order zero, and we find that the B–B penetration in diborane can be interpolated to a bond order of 0.86.
In a recent study,256 Bickelhaupt and co-workers showed the relevance of the atomic size of the interacting atoms in determining the bond dissociation energy for a series of small R–R′ molecules (R, R′ = CH3, NH2, OH, F, SiH3, PH2, SH and Cl). That work reported the energy difference and the overlap between the SOMOs of the two interacting groups for Me–R′ (R′ = Me, Cl, F) at their energy minima. We find both parameters to be nicely correlated with the corresponding penetration indices: the penetration decreases as the gap increases, and the overlap increases with the penetration. Despite the small amount of data available, this seems like another promising direction for the application of penetration indices in computational and theoretical chemistry which deserves further exploration in the future.
Metal–metal multiple bonding
Having seen how the penetration indices allow us to compare bonds of different pairs of main group elements, an obvious test is to carry out a similar analysis for transition metals that can span five bond orders, such as Cr or Mo in their different oxidation states. The distribution of Cr–Cr bond distances as a function of the bond order, commented on by us in previous work,257 can be easily translated to the penetration index language. The results are summarized in Fig. 44, where we can see that there is a practically linear correlation between the centre of the Cr–Cr penetration index distribution and the bond order (r2 = 0.989), spanning the range from 100 to 145%, even if there is some overlap of the penetration distributions between the sets of structures whose bond orders differ by only one unit. A similar trend can be found for the Mo–Mo bonds, although with higher penetration than the Cr–Cr ones for the same bond order.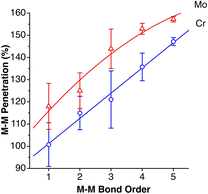 | ||
| Fig. 44 Average penetration indices and esd for M–M bonds of a given bond order (M = Cr, Mo). Data were adapted from ref. 257. | ||
Although actinide–actinide bonds are less common, interest in U–U bonding has led several researchers to carry out computational studies on some simple molecules such as U2, (μ-H)2U2 and H2U2H2, which had been previously detected in the gas phase or by matrix isolation. In a diatomic molecule, even if six bonding electron pairs could in principle be formed, high-level calculations have led to assigning a U–U bond order of five.258 Notwithstanding the bond order, the penetration index corresponding to the optimized distance has an amazingly large value of 199%. Earlier DFT calculations259 for (μ-H)2U2 and H2U2H2 also give very high penetration indices (216 and 210%, respectively), even if in the latter case the maximum possible bond order would be four. Crystallographically characterized U–U bonds all show much smaller penetrations (125–146%), comparable to those found for Cr–Cr and Mo–Mo double and triple bonds (Fig. 44). For comparison, the Th–Th bonds in 75 independent structural data sets from 17 structures found in the CSD have penetration indices of 105–129%, consistent with the lower ability of this element to form multiple bonds due to its smaller number of valence electrons. The absence of bridging ligands in U2 and the unusually large penetration make it an interesting case for further investigation.
Multiple bonding in actinyl groups
One of the most common motifs in the chemistry of actinides is the actinyl group, formed by two bonds between an actinide and bare oxygen atoms in a trans-position, i.e., forming a practically linear O![[triple bond, length as m-dash]](https://www.rsc.org/images/entities/char_e002.gif) An
An![[triple bond, length as m-dash]](https://www.rsc.org/images/entities/char_e002.gif) O group, to which triple bond character is attributed.260 Analogous groups can be found for transition metals, as in molybdenyl or osmyl ions, that can be compared to the CO2 molecule. By analysing the structural data for actinyl compounds, we wish to test if the penetration index can be used as a general bonding indicator for all the actinides and to compare the An–O bonds with similar bonds involving other elements of the periodic table.
O group, to which triple bond character is attributed.260 Analogous groups can be found for transition metals, as in molybdenyl or osmyl ions, that can be compared to the CO2 molecule. By analysing the structural data for actinyl compounds, we wish to test if the penetration index can be used as a general bonding indicator for all the actinides and to compare the An–O bonds with similar bonds involving other elements of the periodic table.
The results of such an analysis are presented in Fig. 45. Notice that each of the four types of oxyl bonds analysed there covers a relatively narrow range of penetration indices (less than 25%), with the actinyl groups showing significantly higher penetration values than the other bonds to oxygen studied. Also notice that the estimated standard deviation of the distribution peak (Table 3) for one single molecule, CO2, in different crystal environments, is significantly larger than those of the other M![[double bond, length as m-dash]](https://www.rsc.org/images/entities/char_e001.gif) O bond families considered, even if they contain a wide variety of M and An atoms bonded to oxygen or of substituents R in the case of ketones. This shows what a powerful tool the penetration index is for summarizing structural information of large groups of analogous bonds implying atoms of different sizes. Despite the experimental uncertainty in the penetration values for CO2, they are within the upper part of the distribution function for C
O bond families considered, even if they contain a wide variety of M and An atoms bonded to oxygen or of substituents R in the case of ketones. This shows what a powerful tool the penetration index is for summarizing structural information of large groups of analogous bonds implying atoms of different sizes. Despite the experimental uncertainty in the penetration values for CO2, they are within the upper part of the distribution function for C![[double bond, length as m-dash]](https://www.rsc.org/images/entities/char_e001.gif) O bonds in the large family of acyclic ketones.
O bonds in the large family of acyclic ketones.
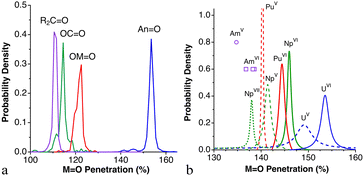 | ||
| Fig. 45 (a) Distribution of penetration indices in ethers, CO2, transition metal MO2 and actinyl AnO2 groups. (b) Breakdown of the actinyl peak by element and oxidation state. Data are provided in the ESI (Tables S38 and S39).‡ | ||
| p av | p max | N | |
|---|---|---|---|
O![[triple bond, length as m-dash]](https://www.rsc.org/images/entities/char_e002.gif) An An![[triple bond, length as m-dash]](https://www.rsc.org/images/entities/char_e002.gif) O O |
153 (1) | 153.6 | 6509 |
O![[double bond, length as m-dash]](https://www.rsc.org/images/entities/char_e001.gif) M M![[double bond, length as m-dash]](https://www.rsc.org/images/entities/char_e001.gif) O O |
120 (1) | 121.8 | 208 |
O![[double bond, length as m-dash]](https://www.rsc.org/images/entities/char_e001.gif) C C![[double bond, length as m-dash]](https://www.rsc.org/images/entities/char_e001.gif) O O |
114 (6) | 114.4 | 177 |
R2C![[double bond, length as m-dash]](https://www.rsc.org/images/entities/char_e001.gif) O O |
111 (1) | 111.0 | 22![[thin space (1/6-em)]](https://www.rsc.org/images/entities/char_2009.gif) 192 192 |
We then zoom in on the peak of the actinides and treat the data for each element separately, showing fittings of the corresponding histograms to Lorentzian functions for clarity (Fig. 45b). We find that each of the elements appears in a distinct range of penetration indices, and they are even well separated by oxidation states (Table 4).
| N | M–O (Å) | p (%) | p av (%) | p max (%) | |
|---|---|---|---|---|---|
| All U | 6212 | 1.52–2.47 | 109–169 | 153.5 (10) | 153.6 |
| UVI | 2078 | 1.52–2.47 | 109–169 | 153.5 (10) | 153.5 |
| UV | 60 | 1.76–1.90 | 145–154 | 149.4 (19) | 149.1 |
| NpVII | 4 | 1.89–2.06 | 128–138 | 135.2 (35) | 138.0 |
| NpVI | 113 | 1.68–1.78 | 144–150 | 146.0 (6) | 146.0 |
| NpV | 96 | 1.73–1.90 | 137–147 | 141.4 (8) | 141.4 |
| PuVI | 74 | 1.71–1.78 | 142–146 | 144.4 (5) | 144.4 |
| PuV | 6 | 1.81–1.82 | 140–141 | 140.2 (2) | 140.3 |
| AmVI | 3 | 1.74–1.77 | 136–139 | 137.9 (9) | — |
| AmV | 1 | 1.81 | 135 | — | — |
Conclusions and perspective
Based on the standard empirical sets of covalent and van der Waals atomic radii, the periodic behaviour of the width of the atomic van der Waals crusts has been analysed and found to be between 0.60 and 1.20 Å for all naturally occurring elements, which represent over 60% of the volume of the atomic van der Waals spheres, reaching proportions higher than 90% for H, He, and B–Ne. The crusts of alkaline elements, on the other side, are found to occupy the smallest portion of the van der Waals sphere for a given period.We have shown how the Lennard-Jones potential energy curves as a function of the interatomic distance can be successfully replaced by energy as a function of the penetration index, which should greatly facilitate comparisons for pairs of elements with different atomic sizes and, consequently, quite different interatomic equilibrium distances. In the case of noble gas-noble gas or noble gas-molecule van der Waals adducts, in homopolar dihydrogen bonding between alkanes, or in the interlayer contacts of 2D solids, penetration indices are found around the 0% value. The penetrations, though, can be modulated using applied pressure or using the electronegativity difference between the interacting atoms.
As forces other than London dispersion appear in non-covalent bonding, higher penetrations are achieved, as in the σ-hole and metallophilic interactions, ion-dipole interactions or the wide variety of hydrogen bonding interactions. Higher penetration indices are found for one- and three-electron bonds, smaller than those for single bonds but, surprisingly, not much smaller, reaching values of up to 80%. A similar range of penetrations can be found for secondary metal–ligand interactions, 3 center-2 electron bonds or electron-deficient bonding.
In general, the penetration index and bond order evolve in parallel. In the case of Xe–O bonds and nonbonded contacts found in enclathrated XeO3 molecules, such a relationship is reflected in a good correlation between the calculated Wiberg index200 and the penetration index. It is still more remarkable that electron-deficient bonds, e.g., in boranes have penetration indices above 90%, very close to those of single bonds. Exceptions to these general trends are the C–C single bonds between adamantyl, diamantyl and triamantyl groups reported by Schreiner et al.,208 whose lengths correspond to penetrations as small as 91%, and the intermonomer C–C distances in the dimer of the TCNE˙− radical anion,213 formally one-electron bonds, with penetrations of around 30%.
In ionic solids or highly polar molecules, penetration indices between atoms with opposite charges are similar to those found for covalent single bonds and to covalent coordinating bonds. An unexpected finding for ionic solids is that the interpenetrations of crusts of two neighbouring, “non-bonded” cations cover a wide range of penetration indices, between 60 and 120%, becoming higher than those between the bonded cation–anion pair for a covalent radii ratio rA/rX higher than 2.5.
All in all, the ranges of penetration indices found for a host of systems analysed in this work (Fig. 46) describe a continuous path between non-bonded and strongly bonded atom pairs. Such a pathway between nonbonding and bonding is nicely represented by the ranges of stability of three types of O–H interactions calibrated by Lobato et al.,17 expressed in terms of penetration indices, which go from 4 to 23% for van der Waals contacts, to 42–62% for O⋯H hydrogen bonds, and from 81 to 124% for O–H covalent bonds, although the distribution of the hydrogen bonds obtained from crystallographic data (Fig. 22a) reveals a still wider range (25–60%).
The highest penetration indices were found in quintuple Cr–Cr (144–150%) and Mo–Mo (156–158%) bonds. Interestingly, the corresponding values for the sextuple bonds calculated by Roos et al.261 for diatomic Cr2 (153%) and Mo2 (162%) molecules are not significantly higher than those of the quintuple bonds, considering that the attribution of a sextuple bond implies the existence of two σ components. The record high penetration (199%), however, results from calculations on the U2 molecule,258 to which a formal bond order of five has been attributed.
An important question addressed in this paper is whether there is some general trend relating the degree of interpenetration to the interaction energy for non-covalent interactions. As a first attempt at answering such a question, we collect in Fig. 47 data for a wide variety of systems for which interaction energies have been reported by several authors, from weak van der Waals interactions to covalent triple bonds, with the only restriction that at least one of the two interacting moieties must be neutral. There, we plot the interaction energies published by several authors as a function of the penetration index, calculated by us from the optimized distance reported. Briefly, these are the data sources:
(a) The van der Waals family includes homo- and heteroatomic dimers of noble gases discussed in this work, as well as those reported by Zhou et al.,19 and the homopolar C–H⋯H–C interactions between simple alkanes and polyhedranes reported earlier by us,199 those between the hydrogen atoms in dimers of tri(3.5-tert-butylphenyl)-methane or unsubstituted and triphenylmethane reported by Schreiner and coworkers113 and between two E2H6 molecules (E = B, Ga).262
(b) The metallophilic interactions include dimers of d8 square planar complexes81 and of linear d10 complexes of Hg,80 or group 11 elements (Cu, Ag, and Au),263,264 disregarding some [L–Cu–X] complexes in which the dimer is held together mostly via intermolecular Cu⋯X interactions.
(c) σ-hole interactions include atom pairs grouped under the umbrellas of halogen bonding,166,169,172 chalcogen bonding, tetrel bonding,165 Br⋯CO interactions,265 and M⋯XC6F5 interactions.266
(d) A sample of 58 different hydrogen bonds analysed by Srivastava267 and the classical hydrogen bonds in adducts of water, ammonia and HF reported by Freindorf et al.268
(e) A sample of covalent bonds, that comprises C–C bonds and H2269,270 and the triple bonds in N2 and CO.270
(f) Characteristic charge-shift bonds.271,272
(g) Metal–ligand bonds in 18-electron complexes of Fe, Ru, Os, Cr, Mo and W with ethylene and acetylene273 or with N-heterocyclic carbenes274 and Ru–L bonds.
The different types of non-covalent interactions cover different ranges of penetration values, consistent with Fig. 46. Moreover, it can be seen that the dependence of the interaction energies reported by different authors on the penetration index follows a general trend, according to which the interaction energy decreases gradually for penetration indices of up to 60% and drops sharply for higher degrees of interpenetration, offering a non-linear continuum of bonding intensities from the very weak van der Waals interactions to the triple bonds of molecules such as N2 and CO, although a more extensive study should be performed to have a better representation of the penetration indices higher than 100%. A sample of coordinative bonds in transition metal complexes computationally analysed by several authors appears to follow a trend similar to that of the covalent bonds (Fig. 47a). It is also noteworthy that the highly polar covalent bond in the NaCl molecule behaves similarly to the non-polar bonds.
As could be expected, the interactions involving charged species enhance the attractive energy between the interacting species. This can be seen by comparing the penetration dependence of the interaction energy for neutral σ-hole systems with similar interactions involving one species with a +1 or −1 charge: chalcogen275 or tetrel bonds,165 involving a halide ion, and halonium ions,276i.e., ion-dipole or ion-induced dipole interactions (Fig. 47b). If the two interacting species are ions of opposite charge, as in the tetramethylammonium-halide ion pairs recently investigated by us,10 further stability is achieved for the same penetration index.
The present study has allowed us to detect that it is common to find a similar penetration dependence of the electrostatic and Pauli components of the interaction energy and there is consequently a correlation between these two terms in the case of dimers of noble gases (Fig. 4). As a result, there is a net repulsive effect of these two terms in uncharged systems, which can be compensated for by the weaker London dispersion forces only at quite low penetrations (long distances). In Fig. 48a we see how the EDA analysis of the interaction between two noble gases shows us that increasing the electrostatic attraction by decreasing the interatomic distance is destabilising because the Pauli repulsion increases even more. The addition of the London dispersion component, however, is enough to compensate for the net Pauli plus coulombic repulsion, making the interaction slightly attractive and very close to the total interaction energy. The same behaviour has been found by us in the set of covalent bonds and coordinative bonds and non-bonding interactions analysed by Kumar et al.277 (see Fig. S12a–c in the ESI‡), with only donor–acceptor complexes involving N or O as donor atoms and BR3 molecules as Lewis acids.
For comparison, we present in Fig. 48b a similar EDA analysis for the adducts of iodonium cations with N-donor Lewis bases (D), D–I+⋯D.276 It shows that, even if the electrostatic contribution is much stronger than that for the case of Ng2 dimers, it is the orbital interaction terms that make the adducts stable, resulting in much higher interaction energies (notice the different energy units used in Fig. 48a and b), and much higher penetrations (90–91%) than those in the case of noble gas dimers (between −12 and +2%). In a different direction, in the hydrogen-bonded systems studied by Grabowski,278 which show a similar correlation between the electrostatic and Pauli energy terms, the electrostatic attraction slightly overcomes the repulsion (Fig. S13a and b in the ESI‡).
Needless to say, when the two interacting species have charges of opposite signs as in tetramethylammonium-halide (TMA·X) ion pairs,10 the coulombic component is the predominant one, overwhelming the Pauli repulsion (Fig. 48c). A non-negligible orbital contribution is also apparent. In those ion pairs, two interaction topologies are considered, one in which the halide interacts with one methyl group, with a predominant X⋯C penetration but non-negligible X⋯H penetrations (termed κ-C), and another in which the interaction is with three hydrogen atoms of three different methyl groups of the TMA cation (3κ-H interaction). Interestingly, regardless of the interaction topology, the different contributions to the interaction energy are well correlated, and the resulting interaction energies are significantly higher than those of the ion-dipole interactions of the halonium systems (Fig. 48b), despite the lower penetration values of the closest contacts (32–54%). The wide variety of ion pairs formed by carbadodecaborate anions and a host of cations submitted by Madureira et al.279 to an energy decomposition analysis also present a correlation between the electrostatic and Pauli repulsion terms (Fig. S13c in the ESI‡), with an important net contribution to the interaction energy.
Additional directions for further applications of the penetration index can be foreseen, and preliminary studies on some of them are giving promising results. We can mention the study of reaction pathways and transition states, wherein the penetration indices between bonds being cleaved or formed can provide useful information on the associative or dissociative nature of the transition state, the effect of oxidation states or coordination number on bond strengths, a possible calibration of the degree of frustration of Lewis pairs, the correlations between bond distances and vibrational force constants (or infrared stretching frequencies), the structure of excited states and exciplexes, or the analysis of the nuclear spin coupling and the hyperfine coupling between unpaired electrons and nuclear spins of neighbouring atoms evaluating the core-valence interpenetrations, of importance in EPR and NMR spectroscopies.
In summary, we think that the present work provides solid support for the application of van der Waals penetration indices to the analysis of covalent and non-covalent bonding as well, which allows for the comparison of interatomic distances regardless of the size of the interacting atoms. Thus, we have shown the existence of good correlations of penetration indices with bonding and energetic parameters such as bond angles, interaction energies, contributions to the interaction energy obtained from EDA analysis, formal bond orders or calculated Wiberg bond indices, or the electronegativity difference between the interacting atoms. We wish to illustrate our take-home message with a last figure (Fig. 49) that presents a map of the wealth of interactions involving a Xe atom, covering the range of penetration indices between −69 and +121%).
Methodology
The methodology for the structural searches and the computational studies reported are given in the ESI.‡Data availability
The Methodology section, complementary figures and tables, and a spreadsheet with the raw data for all figures are available in the ESI.‡Author contributions
Both authors contributed to the conceptualization, funding acquisition, planning of the research and methodology, and revision of the original draft. JE carried out the DFT calculations and EDA analysis and visualization. SA carried out the data curation and the writing of the original draft.Conflicts of interest
There are no conflicts to declare.Acknowledgements
The authors are grateful to professors Stuart Macgregor, Wojciech Grochala, Matthias Bickelhaupt, Ángel Vegas, Pere Alemany, Sason Shaik and Roald Hoffmann for inspiring discussions. This work was supported by the Spanish Ministry of Economy and Competitiveness (PGC2018-093863-B-C21 and PID2019-109119GA-I00), the Spanish Structures of Excellence María de Maeztu program (grant MDM-2017-0767) and the Generalitat de Catalunya – AGAUR (grant 2017-SGR-1289). The allocation of computer time at CSUC is also acknowledged. J. E. is indebted to the Spanish MICCIN for a Ramón y Cajal research contract (RYC-2017-22853) and to the Gobierno de Aragón-ESF program (Research Group E07_23R) for financial support.References
- R. F. W. Bader, Atoms in Molecules, A Quantum Theory, Clarendon Press, Oxford, 1990 Search PubMed.
- S. Alvarez, De mujeres, hombres y moléculas, Edicions Universitat de Barcelona, Barcelona, 2020 Search PubMed.
- M. Rahm, R. Hoffmann and N. W. Ashcroft, Atomic and Ionic Radii of Elements 1-96, Chem. – Eur. J., 2016, 22, 14625–14632 CrossRef CAS PubMed.
- P. Politzer, Electrostatic potential–electronic density relationships in atoms, J. Chem. Phys., 1980, 72, 3027–3033 CrossRef CAS.
- R. J. Gillespie and P. L. A. Popelier, Chemical Bonding and Molecular Geometry, Oxford University Press, Oxford, 2001 Search PubMed.
- B. Cordero, V. Gómez, A. E. Platero-Prats, M. Revés, J. Echeverría, E. Cremades, F. Barragán and S. Alvarez, Covalent Radii Revisited, Dalton Trans., 2008, 2832–2838 RSC.
- S. Alvarez, A Cartography of the Van der Waals Territory, Dalton Trans., 2013, 42, 8617–8636 RSC.
- J. Vogt and S. Alvarez, Van der Waals Radii of the Noble Gases, Inorg. Chem., 2014, 53, 9260–9266 CrossRef CAS PubMed.
- P. Szarek and W. Grochala, Most Probable Distance between the Nucleus and HOMO Electron: The Latent Meaning of Atomic Radius from the Product of Chemical Hardness and Polarizabiity, J. Phys. Chem. A, 2014, 118, 10281–10287 CrossRef CAS PubMed; A. M. Mroz, A. M. Davenport, J. Sterling, J. Davis and C. H. Hendon, An electric field-based approach for quantifying effective volumes and radii of chemically affected space, Chem. Sci., 2022, 13, 6558 RSC.
- D. M. Gil, J. Echeverría and S. Alvarez, Tetramethylammonium Cation: Directionality and Covalency in Its Interactions with Halide Ions, Inorg. Chem., 2022, 61, 9082–9095 CrossRef CAS PubMed.
- M. Pérez-Jiménez, J. Campos, J. Jover, S. Alvarez and E. Carmona, Coordination of E-C Bonds (E = Zn, Mg, Al) and the Zn-H Bonds of (C5Me5)ZnH and (C5Me5)ZnZnH across a Quadruply Bonded Dimolybdenum Dihydride Complex, Organometallics, 2022, 41, 3225–3236 CrossRef.
- J. P. M. Lommerse, A. J. Stone, R. Taylor and F. H. Allen, The Nature and Geometry of intermolecular interactions between halogens and oxygen or nitrogen, J. Am. Chem. Soc., 1996, 118, 3108–3116 CrossRef CAS.
- J. Echeverría, G. Aullón and S. Alvarez, Intermolecular interactions in group 14 hydrides: Beyond C-H···H-C contacts, Int. J. Quantum Chem., 2017, 117, e25432 CrossRef.
- A. Bauzá, A. Frontera and T. J. Mooibroek, σ-Hole Interactions Involving Nitro Aromatic Ligands in Protein Structure, Chem.–Eur. J., 2019, 25, 13436–13443 CrossRef PubMed.
- F. Grandinetti, Noble Gas Chemistry. Structure, Bonding, and Gas Phase Chemistry, Wiley-VCH, Weinheim, 2018 Search PubMed.
- N. Bartlett, Xenon exafluoroplatinate(V) Xe+(PtF6)−, Prod. Chem. Soc., 1962, 6, 218 Search PubMed.
- A. Lobato, M. A. Salvadó, J. M. Recio, M. Taravillo and V. G. Baonza, Highs and Lows of Bond Lengths: Is There Any Limit?, Angew. Chem., Int. Ed., 2021, 60, 17028–17036 CrossRef CAS PubMed.
- T. van Mourik and J. H. van Lenthe, Benchmark full configuration interaction calculations on the helium dimer, J. Chem. Phys., 1995, 102, 7479–7483 CrossRef CAS.
- N. Zhou, Z. Lu, Q. Wu and Y. Zhang, Improved parametrization of interatomic potentials for rare gas dimers with density-based energy decomposition analysis, J. Chem. Phys., 2014, 140, 214117 CrossRef PubMed.
- A. Wüest and F. Merkt, Determination of the interaction potential of the ground electronic state of Ne2 by high-resolution vacuum ultraviolet laser spectroscopy, J. Chem. Phys., 2003, 118, 8807–8812 CrossRef.
- P. R. Herman, P. E. LaRocque and B. P. Stoicheff, Vacuum ultraviolet laser spectroscopy. V. Rovibronic spectra of Ar2 and constants of the ground and excited states, J. Chem. Phys., 1088, 89, 4535–4549 CrossRef.
- M. Molski and J. Konarski, Modified Dunham potential for rovibrational diatomic systems, Can. J. Phys., 1995, 73, 59–62 CrossRef CAS.
- P. E. LaRocque, R. H. Lipson, P. R. Herman and B. P. Stoicheff, Vacuum ultraviolet laser spectroscopy. IV. Spectra of Kr2 and constants of the ground and excited states, J. Chem. Phys., 1986, 84, 6627–6641 CrossRef CAS.
- J. Vogt, N. Vogt, R. Rudert, E. Popov, S. Schlagenhauf, K. Deutzmann and R. Kramer, New Features in the MOGADOC Database, Struct. Chem., 2015, 26, 1725–1727 CrossRef CAS.
- D. Zagorac, H. Müller, S. Ruehl, J. Zagorac and S. Rehme, Recent developments in the Inorganic Crystal Structure Database: theoretical crystal structure data and related features, J. Appl. Crystallogr., 2019, 52, 918–925 CrossRef CAS PubMed.
- R. Feltgen, H. Kirst, K. A. Köhler and H. Pauly, Unique determination of the He2 ground state potential from experiment by use of a reliable potential model, J. Chem. Phys., 1982, 76, 2360–2378 CrossRef CAS.
- J. A. Barker, R. O. Watts, J. K. Lee, T. P. Schafer and Y. T. Lee, Interatomic potentials for krypton and xenon, J. Chem. Phys., 1974, 61, 3081–3089 CrossRef CAS.
- A. Shee, S. Knecht and T. Saue, A theoretical benchmark study of the spectroscopic constants of the very heavy rare gas dimers, Phys. Chem. Chem. Phys., 2015, 17, 10978–10986 RSC.
- A. F. Schuch and R. L. Mills, New allotropic form of He(3), Phys. Rev. Lett., 1961, 6, 596–597 CrossRef CAS.
- J. de Smedt, W. H. Keesom and H. H. Mooy, On the crystal structure of neon, Proc. K. Ned. Akad. Wet., Ser. B: Phys. Sci., 1930, 33, 255–257 CAS.
- D. G. Henshaw, Atomic distribution in liquid and solid neon and solid argon by neutron diffraction, Phys. Rev., 1958, 111, 1470–1475 CrossRef CAS.
- L. H. Bolz and F. A. Mauer, Measurements of the lattice constants of neon isotopes in the temperature range 4-24 K, Adv. X-Ray Anal., 1962, 6, 242–249 CrossRef CAS.
- Z. M. Geballe, H. Liu, A. K. Mishra, M. Ahart, M. Somayazulu, Y. Meng, M. Baldini and R. J. Hemley, Synthesis and Stability of Lanthanum Superhydrides, Angew. Chem., Int. Ed., 2018, 57, 688–692 CrossRef CAS PubMed.
- R. J. Hemley, C. S. Zha, A. P. Jephcoat, H. K. Mao, L. W. Finger and D. E. Cox, X-ray diffraction and equation of state of solid neon to 110 GPa, Phys. Rev. B: Condens. Matter Mater. Phys., 1989, 39, 11820–11827 CrossRef CAS PubMed.
- M. P. Housden and N. C. Pyper, The noble gas dimers as a probe of the energetic contributions of dispersion and short-range electron correlation in weakly bound system, Mol. Phys., 2007, 105, 17–18 CrossRef.
- W. Caminati, Free-jet rotational spectrum and tunneling motion of difluoromethane···xenon, J. Phys. Chem. A, 2006, 110, 4359–4362 CrossRef CAS PubMed.
- I. E. Collings and M. Hanfland, Packing Rearrangements in 4-Hydroxycyanobenzene Under Pressure, Molecules, 2019, 24, 1759 CrossRef PubMed.
- T. Higashi and K. Osaki, p-Cyanophenol, Acta Crystallogr., 1977, B33, 607–609 CrossRef CAS.
- C. Desplanches, E. Ruiz, A. Rodríguez-Fortea and S. Alvarez, Exchange Cupling of Transition-Metal Ions through Hydrogen Bonding: A Theoretical Investigation, J. Am. Chem. Soc., 2002, 124, 5197–5205 CrossRef CAS PubMed.
- J. Mohanraj, E. Capria, L. Benevoli, A. Perucchi, N. Demitri and A. Fraleoni-Morgera, XRD- and infrared-probed anisotropic thermal expansion properties of an organic semiconducting single crystal, Phys. Chem. Chem. Phys., 2018, 20, 1984–1992 RSC.
- M. Chokiewicz, S. Pawledzio, M. Woinska and K. Wozniak, Fragmentation and transferability in Hirshfeld atom refinement, IUCrJ, 2022, 9, 298–315 CrossRef PubMed.
- A. Y. Manakov, V. I. Voronin, A. V. Kurnosov, a. E. Teplykh, V. Y. Kormarov and Y. A. Dyadin, Structural Investigations of Argon Hydrates at Pressures up to 10 kbar, J. Inclusion Phenom. Macrocyclic Chem., 2004, 48, 11–18 CrossRef CAS.
- E. Cerpa, A. Krapp, A. Vela and G. Merino, The Implications of Symmetry of the External Potential on Bond Paths, Chem. – Eur. J., 2008, 14, 10232–10234 CrossRef CAS PubMed.
- M. Ilczyszyn, M. Selent and M. M. Ilczyszyn, Participation of Xenon Guest in Hydrogen Bond Network of β-Hydroquinone Crystal, J. Phys. Chem. A, 2012, 116, 3206–3214 CrossRef CAS PubMed.
- Y. Morinaka, S. Sato, A. Wakamiya, H. Nikawa, N. Mizorogi, F. Tanabe, M. Murata, K. Komatsu, K. Furukawa, T. Kato, S. Nagase, T. Akasaka and Y. Murata, X-ray observation of a helium atom and placing a nitrogen atom inside He@C60 and He@C70, Nat. Commun., 2013, 4, 1554 CrossRef PubMed.
- G. Hoffman, M. C. Walkey, J. Gräsvik, G. R. Bacanu, S. Alom, S. Bloodworth, M. E. Light, M. H. Levitt and R. J. Whitby, A Solid-State Intramolecular Wittig Reaction Enables Efficient Synthesis of Endofullerenes Including Ne@C60, 3He@C60, and HD@C60, Angew. Chem., Int. Ed., 2021, 60, 8960–8966 CrossRef CAS PubMed.
- H. M. Lee, M. M. Olmstead, T. Suetsuna, H. Shimotani, N. Dragoe, R. J. Cross, K. Kitazawa and A. L. Balch, Crystallographic characterization of Kr@C60 in (0.09Kr@C60/0.91C60)·{NiII(OEP)}·2C6H6, Chem. Commun., 2002, 1352–1353 RSC.
- R. Sure, R. Tonner and P. Schwerdtfeger, A Systematic Study of Rare Gas Atoms Encapsulated in Small Fullerenes using Dispersion Corrected Density Functional Theory, J. Comput. Chem., 2015, 36, 88–96 CrossRef CAS PubMed.
- A. Krapp and G. Frenking, Is This a Chemical Bond? A Theoretical Study of Ng2@C60 (Ng=He, Ne, Ar, Kr, Xe), Chem. – Eur. J., 2007, 13, 8256–8270 CrossRef CAS PubMed.
- E. Cerpa, A. Krapp, R. Flores-Moreno, K. J. Donald and G. Merino, Influence of Endohedral Confinement on the Electronic Interaction between He atoms: A He2@C20H20 Case Study, Chem. – Eur. J., 2009, 15, 1985–1990 CrossRef CAS PubMed.
- A. Wueest and F. Merkt, Potential energy curves of diatomic molecular ions from high-resolution photoelectron spectroscopy. III. The low-lying ungerade states of Kr2+, Mol. Phys., 2005, 103, 1285–1300 CrossRef CAS.
- C. A. Reed and R. D. Bolskar, Discrete Fulleride Anions and Fullerenium Cations, Chem. Rev., 2001, 100, 1075–1120 CrossRef PubMed.
- R. M. Badger, A relation between internuclear distances and bond force constants, J. Chem. Phys., 1934, 2, 128–131 CrossRef CAS.
- R. Saha, G. Jana, S. Pan, G. Merino and P. K. Chattaraj, How Far Can One Push the Noble Gases Towards Bonding?: A Personal Account, Molecules, 2019, 24, 2933 CrossRef CAS PubMed.
- B. Mallada, A. Gallardo, M. Lamanec, B. de la Torre, V. Spirko, P. Hobza and P. Jellinek, Real-space imaging of anisotropic charge of σ-hole by means of Kelvin probe force microscopy, Science, 2021, 374, 863–867 CrossRef CAS PubMed.
- Y. Li, Y. Lu, P. Adelhelm, M.-M. Titirici and Y.-S. Hu, Intercalation chemistry of graphite: alkali metal ions and beyond, Chem. Soc. Rev., 2019, 48, 4655–4687 RSC.
- J. Xu, Y. Dou, Z. Wei, J. Ma, J. Deng, Y. Li, H. Liu and S. Dou, Recent Progress in Graphite Intercalation Compounds for Rechargeable Metal (Li, Na, K, Al)-Ion Batteries, Adv. Sci., 2017, 4, 1700146 CrossRef PubMed.
- P. Trucano and R. Chen, Study of graphite by neutron diffraction, Nature, 1975, 258, 136–137 CrossRef CAS.
- O. Dolotko, A. Sensyshyn, M. J. Muehlbauer, K. Nikolowski and H. Ehrenberg, Understanding structural changes in NMC Li-ion cells by in situ neutron diffraction, J. Power Sources, 2014, 255, 197–203 CrossRef CAS.
- L. Boulet-Roblin, D. Sheptyakov, P. Borel, C. Tessier, P. Novak and C. Villevieille, Crystal structure evolution via operando neutron diffraction during long-term cycling of a customized 5 V full Li-ion cylindrical cell LiNi0.5Mn1.5O4 vs. graphite, J. Mater. Chem. A, 2017, 5, 25574–25582 RSC.
- R. C. Asher, A lamellar compound of sodium and graphite, J. Inorg. Nucl. Chem., 1959, 10, 238–249 CrossRef CAS.
- P. Lagrange, D. Guerard and A. Herold, Sur la structure du composé KC8, Ann. Chim., 1978, 3, 143–159 CAS.
- P. Lagrange, D. Guerard, D. El Makrini and A. Herold, Examen radiocristallographique du composé d’insertion de premier stade RbC8, C. R. Seances Acad. Sci., Ser. C, 1978, 287, 179–182 CAS.
- T. Janowski and P. Pulay, A Benchmark Comparison of σ/σ and π/π Dispersion: the Dimers of Naphthalene and Decalin, and Coronene and Perhydrocoronene, J. Am. Chem. Soc., 2012, 134, 17520–17525 CrossRef CAS PubMed.
- C. Boisseau, I. Simbotin and R. Côté, Macrodimers: ultralong range Rydberg molecules, Phys. Rev. Lett., 2002, 88, 133004 CrossRef PubMed.
- V. Bendkowsky, B. Butscher, J. Nipper, J. P. Shafer, R. Löw and T. Pfau, Observation of ultralong-range Rydberg molecules, Nature, 2009, 458, 1005–1008 CrossRef CAS PubMed.
- C. H. Greene, A. S. Dickinson and H. R. Sadeghpour, Creation of Polar and Nonpolar Ultra-Long-Range Rydberg Molecul, Phys. Rev. Lett., 2000, 85, 2458–2461 CrossRef CAS PubMed.
- N. Zuber, V. S. V. Anasuri, M. Berngruber, Y.-Q. Zou, F. Meinert, R. Löw and T. Pfau, Observation of a molecular bond betweenions and Rydberg atoms, Nature, 2022, 605, 454–456 CrossRef PubMed.
- J. Simons and M. Gutowski, Double-Rydberg Molecular Anions, Chem. Rev., 1991, 91, 669–677 CrossRef CAS.
- A. C. J. Lawson, R. B. J. Roof, J. D. Jorgensen, B. Morosin and J. E. Schirber, Structure of ND4F - II, Acta Crystallogr., Sect. B: Struct. Sci., 1989, 45, 212–218 CrossRef.
- M. W. Crofton and T. Oka, Observation of forbidden transitions of ammonium ion (NH4+) ν3 band and determination of ground state rotational constants. Observation of ν3 band allowed transitions of ND4+, J. Chem. Phys., 1987, 35, 5893 Search PubMed.
- J. Melin, G. Seabra and J. V. Ortiz, in Theoretical Aspects of Chemical Reactivity, ed. A. Toro-Labbé, Elsevier B. V., Amsterdam, 2007, pp. 87–100 Search PubMed.
- A. I. Boldyrev and J. Simons, On the Possibility of Mixed Rydberg-Valence Bonds, J. Phys. Chem. A, 1999, 103, 3575–3580 CrossRef CAS.
- A. I. Boldyrev and J. Simons, Rydberg bonding in ammonium dimer ((NH4)2), J. Phys. Chem., 1992, 96, 8840–8843 CrossRef CAS.
- P. Pyykkö, Strong Closed-Shell Interactions in Inorganic Chemistry, Chem. Rev., 1997, 97, 597–636 CrossRef PubMed.
- H. Schmidbaur and H. G. Raubenheimer, Excimer and Exciplex Formation in Gold(I) Complexes Preconditioned by Aurophilic Interactions, Angew. Chem., Int. Ed., 2020, 59, 14748–14771 CrossRef CAS PubMed.
- P. K. Mehrotra and R. Hoffmann, Cu(I)-Cu(I) Interactions. Bonding Relationships in d10d10 Systems, Inorg. Chem., 1978, 17, 2187–2189 CrossRef CAS.
- Y. Jiang, S. Alvarez and R. Hoffmann, Binuclear and Polynuclear Gold(I) Complexes, Inorg. Chem., 1985, 24, 749–757 CrossRef CAS.
- A. Carvajal, X.-Y. Liu, P. Alemany, J. J. Novoa and S. Alvarez, Ligand Effects and Dimer Formation in Bicoordinate Copper(I) Complexes, Int. J. Quantum Chem., 2002, 86, 100–105 CrossRef CAS.
- J. Echeverría, J. Cirera and S. Alvarez, Mercurophilic interactions: A Theoretical Study of the Importance of the Ligands, Phys. Chem. Chem. Phys., 2017, 19, 11645–11654 RSC.
- J. J. Novoa, G. Aullón, P. Alemany and S. Alvarez, On the Bonding Nature of the M···M Interactions in Dimers of Square-Planar Pt(II) and Rh(I) Complexes, J. Am. Chem. Soc., 1995, 117, 7169–7171 CrossRef CAS.
- G. Aullón, P. Alemany and S. Alvarez, On the Existence of a Pyramidality Effect in d8···d8 Contacts. Theoretical Study and Structural Correlation, Inorg. Chem., 1996, 35, 5061–5067 CrossRef PubMed.
- G. Aullón and S. Alvarez, Chain Conformation and Metal⋯Metal Contacts in Dimers and Stacks of d8-ML4 Complexes: Electronic Effects, Chem. – Eur. J., 1997, 3, 655–664 CrossRef.
- A. Kobayashi, Y. Sasaki and H. Kobayashi, Structural Studies of Commensurate Peierls State of Rb1.67[Pt(C2O4)2]·1.5H2O, Bull. Chem. Soc. Jpn., 1979, 52, 3682–3691 CrossRef CAS.
- A. E. Pullen, C. Faulmann, H.-L. Liu, D. B. Tanner, K. A. Abboud and J. R. Reynolds, Electrocrystallization and characterization of phosphonium-based radical anion salts [MePh3P] [Pd(dmit)2]3 and [Ph4P] [Pd(dmit)2]3 (dmit = 1,3-dithiole-2-thione-4,5-dithiolate). Comparison with related Pd and Ni isologues, Inorg. Chim. Acta, 1998, 282, 90–95 CrossRef CAS.
- A. Galstyan, P. J. Sanz-Miguel, J. Wolf, E. Freisinger and B. Lippert, Discrete Molecular Squares {[(en)M(CN)]4}4+ Derived from [(en)M(CN)2] (M = PtII, PdII), Eur. J. Inorg. Chem., 2011, 1649–1666 CrossRef CAS.
- K. Kitano, R. Tanaka, T. Kimura, T. Tsuda, S. Shimizu, H. Takagi, T. Nishioka, D. Shiomi, A. Ichimura, I. Kinoshita, K. Isobe and S. Ooi, Lantern-type dinuclear CrIIIPtII and VIVPtII complexes bridged by pyridine-2-thiolate. Synthesis and characterization, J. Chem. Soc., Dalton Trans., 2000, 995–1000 RSC.
- K. Meelich, M. Galanski, V. B. Arion and B. K. Keppler, Bis(2-amino alcohol-κN)dicarboxylatoplatinum(II) Complexes – Elegant Synthesis via Ring-Opening of Bis(2-amino alcoholato-κ2N,O)platinum(II) Species with Dicarboxylic Acids, Eur. J. Inorg. Chem., 2006, 2476–2483 CrossRef CAS.
- B. T. Watson, M. Vanga, A. Noonikara-Poyil, A. Muoz-Castro and H. V. R. Dias, Copper(I), Silver(I), and Gold(I) Ethylene Complexes of Fluorinated and Boron-Methylated Bis- and Tris(pyridyl)borate Chelators, Inorg. Chem., 2023, 62, 1636–1648 CrossRef CAS PubMed.
- T. Nguyen, A. D. Sutton, M. Brynda, J. C. Fettinger, G. J. Long and P. P. Power, Synthesis of a Stable Compound with Fivefold Bonding Between Two Chromium(I) Centers, Science, 2005, 844, 844–847 CrossRef PubMed.
- R. Wolf, C. Ni, T. Nguyen, M. Brynda, G. J. Long, A. D. Sutton, R. C. Fischer, J. C. Fettinger, M. Hellman, L. Pu and P. P. Power, Substituent Effects in Formally Quintuple-Bonded ArCrCrAr Compounds (Ar = Terphenyl) and Related Species, Inorg. Chem., 2007, 46, 11277–11290 CrossRef CAS PubMed.
- M. Carrasco, M. Faust, R. Peloso, A. Rodríguez, J. López-Serrano, E. Alvarez, C. Maya, P. P. Power and E. Carmona, Quadruply bonded dimolybdenum complexes with highly unusual geometries and vacant coordination sites, Chem. Commun., 2012, 48, 3954–3956 RSC.
- M. Carrasco, I. Mendoza, M. Faust, J. López-Serrano, R. Peloso, A. Rodríguez, E. Alvarez, C. Maya, P. P. Power and E. Carmona, Terphenyl Complexes of Molybdenum and Tungsten with Quadruple Metal–Metal Bonds and Bridging Carboxylate Ligands, J. Am. Chem. Soc., 2914, 136, 9173–9180 CrossRef PubMed.
- M. Carrasco, I. Mendoza, E. Alvarez, A. Grirrane, C. Maya, R. Peloso, A. Rodríguez, A. Falceto, S. Alvarez and E. Carmona, Experimental and Computational Studies of the Molybdenum-Flanking Arene Interaction in Quadruply Bonded Dimolybdenum Complexes with Terphenyl Ligands, Chem. – Eur. J., 2015, 21, 410–421 CrossRef CAS PubMed.
- A. Velian, S. Lin, J. M. Miller, M. W. Day and T. Agapie, Synthesis and C−C Coupling Reactivity of a Dinuclear NiI−NiI Complex Supported by a Terphenyl Diphosphine, J. Am. Chem. Soc., 2010, 132, 6296–6297 CrossRef CAS PubMed.
- G. A. Landrum and R. Hoffmann, Secondary Bonding between Chalcogens or Pnicogens and Halogens, Angew. Chem., Int. Ed., 1998, 37, 1887–1890 CrossRef CAS.
- H. A. Jahn and E. Teller, Stability of Polyatomic Molecules in Degenerate Electronic States. I. Orbital Degeneracy, Proc. R. Soc. London, Ser. A, 1937, 161, 220–235 CAS.
- I. B. Bersuker, The Jahn-Teller effect, Cambridge University Press, Cambridge, UK, 2006 Search PubMed.
- M. A. Halcrow, Jahn-Teller distortions in transition metal compounds, and their importance in functional molecular and inorganic materials, Chem. Soc. Rev., 2013, 42, 1784–1795 RSC.
- J. Echeverría, E. Cremades, A. J. Amoroso and S. Alvarez, Jahn-Teller Distortions of Six-coordinate Copper(II) Compounds: Cis or Trans?, Chem. Commun., 2009, 4242–4244 RSC.
- W. Grochala, Plasticity of the coordination sphere of Ag2+, Phys. Status Solidi, 2006, 243, R81–R83 CrossRef CAS.
- T. Hansen, X. Sun, M. Dalla Tiezza, W.-J. van Zeist, J. N. P. van Stralen, D. P. Geerke, L. P. Wolters, J. Poater, T. A. Hamlin and F. M. Bickelhaupt, C-X Bond Activation by Palladium: Steric Shielding versus Steric Attraction, Chem. – Eur. J., 2022, 28, 3202201093 Search PubMed.
- C. F. Matta, J. Hernández-Trujillo, T.-H. Tang and R. F. W. Bader, Hydrogen–Hydrogen Bonding: A Stabilizing Interaction in Molecules and Crystals, Chem. – Eur. J., 2003, 9, 1940–1951 CrossRef CAS PubMed.
- J. Poater, M. Solà and F. M. Bickelhaupt, Hydrogen–Hydrogen Bonding in Planar Biphenyl, Predicted by Atoms-In-Molecules Theory, Does Not Exist, Chem. – Eur. J., 2006, 12, 2889–2895 CrossRef CAS PubMed.
- J. Poater, R. Visser, M. Solà and F. M. Bickelhaupt, Polycyclic Benzenoids: Why Kinked is More Stable than Straight, J. Org. Chem., 2007, 72, 1134–1142 CrossRef CAS PubMed.
- S. Grimme, C. Mück-Lichtenfeld, G. Erker, G. Kehr, H. Wang, H. Beckers and H. Willner, When Do Interacting Atoms Form a Chemical Bond? Spectroscopic Measurements and Theoretical Analyses of Dideuteriophenanthrene, Angew. Chem., Int. Ed., 2009, 48, 2592–2595 CrossRef CAS PubMed.
- A. I. Proktavatilov and A. P. Isakina, An X-ray powder diffraction study of crystalline α-methane-d4, Acta Crystallogr., Sect. B: Struct. Crystallogr. Cryst. Chem., 1980, 36, 1576–1580 CrossRef.
- G. J. H. van Nes and A. Vos, Single-crystal structures and electron density distributions of ethane, ethylene and acetylene. I. Single-crystal X-ray structure determinations of two modifications of ethane, Acta Crystallogr., Sect. B: Struct. Crystallogr. Cryst. Chem., 1978, 34, 1947–1956 CrossRef.
- G. J. H. van Nes and A. Vos, Single-crystal structures and electron density distributions of ethane, ethylene and acetylene. III. Single-crystal X-ray structure determination of ethylene at 85 K, Acta Crystallogr., Sect. B: Struct. Crystallogr. Cryst. Chem., 1979, 35, 2593–2601 CrossRef CAS.
- A. Stein, C. W. Lehmann and P. Luger, Crystal structure of cyclobutane at 117 K, J. Am. Chem. Soc., 1992, 114, 7684–7687 CrossRef CAS.
- F. E. Kühn, M. Groarke, E. Bencze, E. Herdtweck, A. Prazeres, A. M. Santos, M. J. Calhorda, C. C. Romão, I. S. Gonçalves, A. D. Lopes and M. Pillinger, Octahedral Bipyridine and Bipyrimidine Dioxomolybdenum(VI) Complexes: Characterization, Application in Catalytic Epoxidation, and Density Functional Mechanistic Study, Chem. – Eur. J., 2002, 8, 2370–2383 CrossRef.
- H. Imgartinger, A. Goldmann, R. Jahn, M. Nixdorf, H. Rodewald, G. Maier, K.-D. Malsch and R. Emrich, Tetra-tert-butyltetrahedrane—Crystal and Molecular Structure, Angew. Chem., Int. Ed., 1984, 23, 993–994 CrossRef.
- S. Rösel, H. Quanz, C. Legomenn, J. Becker, E. Mossou, L. Cañadillas-Delgado, E. Aldeweyher, S. Grimme and P. R. Schreiner, London Dispersion Enables the Shortest Intermolecular Hydrocarbon H···H Contact, J. Am. Chem. Soc., 2017, 139, 7428–7431 CrossRef PubMed.
- M. Brookhart and M. L. H. Green, Carbon-hydrogen-transition metal bonds, J. Organomet. Chem., 1983, 250, 395–408 CrossRef CAS.
- M. J. Calhorda, Weak hydrogen bonds: theoretical studies, Chem. Commun., 2000, 801–809 RSC.
- W. Scherer and G. S. McGrady, Agostic Interactions in d0 Metal Alkyl Complexes, Angew. Chem., Int. Ed., 2005, 43, 1782 CrossRef PubMed.
- E. Clot and O. Eisenstein, Agostic Interactions from a computational Perspective: One Name, Many Interpretations, Struct. Bonding, 2004, 113, 1–36 CrossRef CAS.
- M. Brookhart, M. L. H. Green and G. Parkin, Agostic interactions in transition metal compounds, Proc. Natl. Acad. Sci. U. S. A., 2007, 104, 6908–6914 CrossRef CAS PubMed.
- Q. Lu, F. Neese and G. Bistoni, London dispersion effects in the coordination and activation of alkanes in σ-complexes: a local energy decomposition study, Phys. Chem. Chem. Phys., 2019, 21, 11569–11577 RSC.
- R. D. Young, Characterisation of Alkane σ-Complexes, Chem. – Eur. J., 2014, 20 CrossRef CAS PubMed.
- R. H. Crabtree, E. M. Holt, M. Lavin and S. M. Morehouse, Inter- vs. intramolecular carbon-hydrogen activation: a carbon-hydrogen-iridium bridge in [IrH(mq)L2]BF4 and a CH + M → CMH reaction trajectory, Inorg. Chem., 1985, 24, 1986–1992 CrossRef CAS.
- J. Fernández-Valparís and S. Alvarez, Design of a Structural Database for Homoleptic Transition Metal Complexes, Struct. Chem., 2015, 26, 1715–1723 CrossRef.
- F. M. Chadwick, N. H. Rees, A. S. Weller, T. Krämer, M. Iannuzzi and S. A. Macgregor, A Rhodium–Pentane Sigma-Alkane Complex: Characterization in the Solid State by Experimental and Computational Techniques, Angew. Chem., Int. Ed., 2016, 55, 3677–3681 CrossRef CAS PubMed.
- S. D. Pike, F. M. Chadwick, N. H. Rees, M. P. Scott, A. S. Weller, T. Kramer and S. A. Macgregor, Solid-State Synthesis and Characterization of σ-Alkane Complexes, [Rh(L2)(η2,η2-C7H12)][BArF4] (L2 = Bidentate Chelating Phosphine), J. Am. Chem. Soc., 2015, 137, 820–833 CrossRef CAS PubMed.
- S. Kleinhenz, V. Pfennig and K. Seppelt, Preparation and Structures of [W(CH3)6], [Re(CH3)6], [Nb(CH3)6]−, and [Ta(CH3)6]−, Chem. – Eur. J., 1998, 4, 1687–1691 CrossRef CAS.
- S. H. Crosby, G. J. Clarkson and J. P. Rourke, A Delicate Balance between sp2 and sp3 C-H Bond Activation: A Pt(II) Complex with a Dual Agostic Interaction, J. Am. Chem. Soc., 2009, 131, 14142–14143 CrossRef CAS PubMed.
- W. Scherer, T. Priermeier, A. Haaland, H. V. Volden, G. S. McGrady, A. J. Downs, R. Boese and D. Bläser, Molecular Structures of EtTiCl3 and EtTiCl3(dmpe) (dmpe = Me2PCH2CH2PMe2): New Insights into β-Agostic Bonding, Organometallics, 1998, 17, 4406–4412 CrossRef CAS.
- E. D. Bloch, W. L. Queen, R. Krishna, J. M. Zadorzny, C. M. Brown and J. R. Long, Hydrocarbon Separations in a Metal–Organic Framework with Open Iron(II) Coordination Sites, Science, 2012, 335, 1606–1610 CrossRef CAS PubMed.
- V. Lavallo, Y. Canac, A. DeHope, B. Donadieu and G. Bertrand, A Rigid Cyclic (Alkyl)(amino)carbene Ligand Leads to Isolation of Low-Coordinate Transition-Metal Complexes, Angew. Chem., Int. Ed., 2005, 44, 7236–7239 CrossRef CAS PubMed.
- G. Bruno, S. Lanza and F. Nicolò, Structure of [Pt(C6H5)2(btz-N,N')].CHCl3, btz = 2,2'-bi-5,6-dihydro-4H-1,3-thiazine, Acta Crystallogr., 1990, C46, 765–767 CAS.
- T. M. Boyd, B. E. Tegner, G. J. Tizzard, A. J. Martínez-Martínez, S. E. Neale, M. A. Hayward, S. J. Coles, S. A. Macgregor and A. S. Weller, A Structurally Characterized Cobalt(I) σ-Alkane Complex, Angew. Chem., Int. Ed., 2019, 59, 6177–6181 CrossRef PubMed.
- A. J. Bukvic, A. L. Burnage, G. J. Tizzard, A. J. Martínez-Martínez, A. I. McKay, N. H. Rees, B. E. Tegner, T. Krämer, H. Fish, M. R. Warren, S. J. Coles, S. A. Macgregor and A. S. Weller, A Series of Crystallographically Characterized Linear and Branched σ-Alkane Complexes of Rhodium: From Propane to 3-Methylpentane, J. Am. Chem. Soc., 2021, 143, 5106–5120 CrossRef CAS PubMed.
- A. J. Martínez-Martínez, B. E. Tegner, A. I. McKay, A. J. Bukvic, N. H. Rees, G. J. Tizzard, S. J. Coles, M. R. Warren, S. A. Macgregor and A. S. Weller, Modulation of σ-Alkane Interactions in [Rh(L2)(alkane)]+ Solid-State Molecular Organometallic (SMOM) Systems by Variation of the Chelating Phosphine and Alkane: Access to η2,η2-σ-Alkane Rh(I), η1-σ-Alkane Rh(III) Complexes, and Alkane Encapsulation, J. Am. Chem. Soc., 2019, 140, 14958–14970 CrossRef PubMed.
- L. R. Doyle, M. R. Galpin, S. K. Furfari, B. E. Tegner, A. J. Martínez-Martínez, A. C. Whitwood, S. A. Hicks, G. C. Lloyd-Jones, S. A. Macgregor and A. S. Weller, Inverse Isotope Effects in Single-Crystal to Single-Crystal Reactivity and the Isolation of a Rhodium Cyclooctane σ-Alkane Complex, Organometallics, 2022, 41, 284–292 CrossRef CAS PubMed.
- A. I. McKay, T. Krämer, N. H. Rees, A. L. Thompson, K. E. Christensen, S. A. Macgregor and A. S. Weller, Formation of a σ-alkane Complex and a Molecular Rearrangement in the Solid-State: [Rh(Cyp2PCH2CH2PCyp2)(η2:η2-C7H12)][BArF4], Organometallics, 2017, 36, 22–25 CrossRef CAS.
- B. Eguillor, M. A. Esteruelas, V. Lezáun, M. Oliván, E. Oñate, J.-Y. Tsay and C. Xia, A Capped Octahedral MHC6 Compound of a Platinum Group Metal, Chem. – Eur. J., 2016, 22, 9106–9110 CrossRef CAS PubMed.
- G. J. Kubas, R. R. Ryan, B. I. Swanson, P. J. Vergamini and H. J. Wasserman, Characterization of the First Examples of Isolable Molecular Hydrogen Complexes, M(CO)3(PR3)2(H2) (M = Mo, W; R = Cy,/-Pr). Evidence for a Side-on Bonded H2 Ligand, J. Am. Chem. Soc., 1984, 106, 451–452 CrossRef CAS.
- G. J. Kubas, Metal–dihydrogen and σ-bond coordination: the consummate extension of the Dewar–Chatt–Duncanson model for metal–olefin π bonding, J. Organomet. Chem., 2001, 635, 37–68 CrossRef CAS.
- F. Maseras, A. Lledós, E. Clot and O. Eisenstein, Transition Metal Polyhidrides: From Qualitative Ideas to Reliable Computational Studies, Chem. Rev., 2000, 100, 601–636 CrossRef CAS PubMed.
- M. Yousufuddin, T. B. Wen, S. A. Mason, G. J. McIntyre, G. Jia and R. Bau, A Neutron Diffraction Study of [OsClH3(PPh3)3]: A Complex Containing a Highly “Stretched” Dihydrogen Ligand, Angew. Chem., Int. Ed., 2005, 44, 7227–7230 CrossRef CAS PubMed.
- A. A. Zuzek and G. Parkin, Si–H and Si–C Bond Cleavage Reactions of Silane and Phenylsilanes with Mo(PMe3)6: Silyl, Hypervalent Silyl, Silane, and Disilane Complexes, J. Am. Chem. Soc., 2014, 136, 8177–8180 CrossRef CAS PubMed.
- W. Chen, S. Shimada and M. Tanaka, Synthesis and Structure of Formally Hexavalent Palladium Complexes, Science, 2002, 295 CAS.
- P. Gualco, A. Amgoune, K. Miqueu, S. Ladeira and D. Bourissou, A Crystalline σ Complex of Copper, J. Am. Chem. Soc., 2011, 133, 4257–4259 CrossRef CAS PubMed.
- S. Shimada, M. L. N. Rao, T. Hayashi and M. Tanaka, Isolation of Dinuclear (μ-Silylene)(silyl)nickel Complexes and Si−Si Bond Formation on a Dinuclear Nickel Framework, Angew. Chem., Int. Ed., 2001, 40, 213–216 CrossRef CAS PubMed.
- G. A. Jeffrey, An Introduction to Hydrogen Bonding, Oxford University Press, New York, 1997 Search PubMed.
- G. R. Desiraju and T. Steiner, The Weak Hydrogen Bond. Its Structural Chemistry and Biology, Oxford University Press, Oxford, 1999 Search PubMed.
- T. Steiner, The Hydrogen Bond in the Solid State, Angew. Chem., Int. Ed., 2002, 41, 48–76 CrossRef CAS.
- S. J. Grabowski and W. A. Sokalski, Different types of hydrogen bonds: correlation analysis of interaction energy components, J. Phys. Org. Chem., 2005, 18, 779–784 CrossRef CAS.
- J. W. Steed and J. L. Atwood, Supramolecular Chemistry, Wiley, Hoboken, NJ, 3rd edn, 2022 Search PubMed.
- F. Dankert, K. Reuter, C. Donsbach and C. von Hänisch, A structural study of alkaline earth metal complexes with hybrid disila-crown ethers, Dalton Trans., 2017, 46, 8727–8735 RSC.
- K. Kawaguchi and E. Hirota, Diode laser spectroscopy of the v3 and v2 bands of FHF− in 1300 cm−1 region, J. Chem. Phys., 1987, 87, 6838 CrossRef CAS.
- K. Kawaguchi and E. Hirota, Infrared diode laser spectroscopy of FDF−, J. Mol. Struct., 1995, 352/353, 389–394 CrossRef CAS.
- K. Kawaguchi and E. Hirota, Infrared diode laser study of the hydrogen bifluoride anion: FHF− and FDF−, J. Chem. Phys., 1986, 84, 2953 CrossRef CAS.
- J. A. Ibers, Refinement of Peterson and Levy's neutron diffraction data on KHF2, J. Chem. Phys., 1964, 40, 402–404 CrossRef CAS.
- A. R. Mahjoub, D. Leopold and K. Seppelt, Iodine pentafluoride - hydrogen fluoride co-crystallisates, directed weak interactions, Eur. J. Solid State Inorg. Chem., 1992, 29, 635–647 CAS.
- B. Dereka, Q. Yu, N. H. C. Lewis, W. B. Carpenter, J. M. Bowman and A. Tokmakoff, Crossover from hydrogen to chemical bonding, Science, 2021, 371, 160–164 CrossRef CAS PubMed.
- A. Haaland, Molecules and Models. The Molecular Structures of Main Group element Compounds, Oxford University Press, Oxford, 2008 Search PubMed.
- J. O. Lundgren and I. Olovsson, Hydrogen Bond Studies. XV. The Crystal Structure of Hydrogen Chloride Dihydrate, Acta Crystallogr., 1967, 23, 966–971 CrossRef CAS.
- R. Attig and J. M. Williams, The H5O2+ Ion in Hydrogen Bromide Dihydrate, Angew. Chem., Int. Ed., 1976, 15, 491–492 CrossRef.
- N. Lebrun, F. Mahe, J. Lamiot, M. Foulon and J. C. Petit, A new crystalline phase of nitric acid dihydrate, Acta Crystallogr., Sect. C: Cryst. Struct. Commun., 2001, 57, 1129–1131 CrossRef CAS PubMed.
- G. Gilli and P. Gilli, The Nature of the Hydrogen Bond, Oxford University Press, Oxford, 2009 Search PubMed.
- H. A. Fargher, T. J. Sherbow, M. M. Haley, D. W. Johnson and M. D. Pluth, C–H···S hydrogen bonding interactions, Chem. Soc. Rev., 2022, 51, 1454 RSC.
- H. Keil, R. Herbst-Irmer, S. Rathjen, C. Girschik, T. Müller and D. Stalke, Si–H···Se Chalcogen–Hydride Bond Quantified by Diffraction and Topological Analyses, Inorg. Chem., 2022, 61, 6319–6325 CrossRef CAS PubMed.
- L. d. A. Santos, T. C. Ramalho, T. A. Hamlin and F. M. Bickelhaupt, Intermolecular Covalent Interactions: Nature and Directionality, Chem. – Eur. J., 2023, 29, e202203791 Search PubMed.
- A. Bauzà, T. J. Mooibroek and A. Frontera, Tetrel-Bonding Interaction: Rediscovered Supramolecular Force?, Angew. Chem., Int. Ed., 2013, 52, 12317–12321 CrossRef PubMed.
- Y. Mo, D. Danovich and S. Shaik, The roles of charge transfer and polarization in non-covalent interactions: a perspective from ab initio valence bond methods, J. Mol. Model., 2022, 28, 274 CrossRef CAS PubMed.
- S. J. Grabowski, Pnicogen and tetrel bonds—tetrahedral Lewis acid centres, Struct. Chem., 2019, 30, 1141–1152 CrossRef CAS.
- E. Bartashevich, Y. Matveychuk and V. Tsirelson, Identification of the Tetrel Bonds between Halide Anions and Carbon Atom of Methyl Groups Using Electronic Criterion, Molecules, 2019, 24, 1083 CrossRef CAS PubMed.
- C. Wang, D. Danovich, Y. Mo and S. Shaik, On The Nature of the Halogen Bond, J. Chem. Theory Comput., 2014, 10, 3726–3737 CrossRef CAS PubMed.
- H. I. Bioemink, S. A. Cooke, J. H. Holloway and A. C. Legon, Rotational spectroscopy of mixtures of trimethylamine and fluorine: Identification of the ion pair [(CH3)3NF]+··· F− in the gas phase, Angew. Chem., Int. Ed. Engl., 1997, 36, 1340–1342 CrossRef.
- P. Metrangolo and G. Resnati, Halogen Bonding: A Paradigm in Supramolecular Chemistry, Chem. – Eur. J., 2001, 7, 2511–2519 CrossRef CAS PubMed.
- J. S. Murray and P. Politzer, Interaction and Polarization Energy Relationships in σ-Hole and π-Hole Bonding, Crystals, 2020, 10, 76 CrossRef.
- L. Pauling, The Nature of the Chemical Bond. II. The One-electron Bond and the Three-electron Bond, J. Am. Chem. Soc., 1931, 53, 3225 CrossRef CAS.
- Ø. Burrau, Berechnung des Energiewertes des Wasserstoffmolekel-Ions (H2+) im Normalzustand, Naturwissensch, 1927, 15, 16–17 CrossRef.
- S. Stimson, M. Evans, C.-W. Hsu and C. Y. Ng, Rotationally resolved vacuum ultraviolet pulsed field ionization-photoelectron vibrational bands for HD+ (X2Σg+, v+=0-20), J. Chem. Phys., 2007, 126, 164303 CrossRef CAS PubMed.
- X. He, S. Lv, T. Hayat and K. Han, Potential Energy Surfaces for the First Two Lowest-Lying Electronic States of the LiH2+ System, and Dynamics of the H+ + LiH ⇌ H2+ + Li Reactions, J. Phys. Chem. A, 2016, 120, 2459–2470 CrossRef CAS PubMed.
- A. Carrington, C. H. Pyne, A. M. Shaw, S. M. Taylor, J. M. Hutson and M. M. Law, Microwave spectroscopy and interaction potential of the long-range H···Kr+ ion: An example of Hund's case, J. Chem. Phys., 1996, 105, 8602–8614 CrossRef CAS.
- M. W. Johnson, E. Sandor and E. Arzi, The crystal structure of deuterium fluoride, Acta Crystallogr., Sect. B: Struct. Crystallogr. Cryst. Chem., 1975, 31, 1998–2003 CrossRef.
- E. Sandor and R. F. C. Farrow, Crystal structure of solid hydrogen chloride and deuterium chloride, Nature, 1967, 213, 171–172 CrossRef CAS.
- A. Ikram, B. H. Torrie and B. M. Powell, Structures of solid deuterium bromide and deuterium iodide, Mol. Phys., 1993, 79, 1037–1049 CrossRef CAS.
- S. Biswas, I. M. Oppel and H. F. Bettinger, Synthesis and Structural Characterization of 9-Azido-9-Borafluorene: Monomer and Cyclotrimer of a Borole Azide, Inorg. Chem., 2010, 49, 4499–4506 CrossRef CAS PubMed.
- A. Hübner, A. M. Diehl, M. Bolte, H.-W. Lerner and M. Wagner, High-Temperature Reactivity of the Strongly Electrophilic Pristine 9H-9-Borafluorene, Organometallics, 2013, 32, 6827–6833 CrossRef.
- J. D. Hoefelmeyer and F. P. Gabbai, An Intramolecular Boron-Boron One-Electron σ-Bond, J. Am. Chem. Soc., 2000, 122, 9054–9055 CrossRef CAS.
- A. Hübner, A. M. Diehl, M. Diefenbach, B. Endeward, M. Bolte, H.-W. Lemer, M. C. Holthausen and M. Wagner, Confirmed by X-ray Crystallography: The B·B One-Electron σ Bond, Angew. Chem., Int. Ed., 2014, 53, 4832–4835 CrossRef PubMed.
- D. D. Danielson and K. Hedberg, The effect of temperature on the structure of gaseous molecules. 4. Molecular structure and barrier to internal rotation for diboron tetrabromide, J. Am. Chem. Soc., 1979, 101, 3199–3203 CrossRef CAS.
- N. Wiberg, T. Blank, K. Amelunxen, H. Noth, J. Knizek, T. Habereder, W. Kaim and M. Wanner, On the Gallanyls R*3Ga2· and R*4Ga3· As Well As Gallanides R*3Ga2− and R*4Ga3− (R* = SitBu3) − Syntheses, Characterization, Structures, Eur. J. Inorg. Chem., 2001, 1719–1727 CrossRef CAS.
- C. Pluta, K.-R. Pörschke, C. Kruger and K. Hildenbrand, An Al–Al One-Electron π Bond, Angew. Chem., Int. Ed., 1993, 32, 388–390 CrossRef.
- X. He, R. A. Bartlett, M. M. Olmstead, K. Ruhlandt-Senge, B. E. Sturgeon and P. P. Power, Reduction of a Tetraaryldigallane to Afford a Radical Anion with Ga–Ga Multiple Bonding Character, Angew. Chem., Int. Ed., 1993, 32, 717–719 CrossRef.
- Z. Feng, Y. Fang, H. Ruan, Y. Zhao, G. Tan and X. Wang, Stable Radical Cation and Dication of an N-Heterocyclic Carbene Stabilized Digallene: Synthesis, Characterization and Reactivity, Angew. Chem., Int. Ed., 2020, 59, 6769–6774 CrossRef CAS PubMed.
- S. Bontemps, G. Bouhadir, W. Gu, M. Mercy, C.-H. Chen, B. M. Foxman, L. Maron, O. V. Ozerov and D. Bourissou, Metallaboratranes Derived from a Triphosphanyl–Borane: Intrinsic C3 Symmetry Supported by a Z-Type Ligand, Angew. Chem., Int. Ed., 2008, 47, 1481–1484 CrossRef CAS PubMed.
- M.-E. Moret, L. Zhang and J. C. Peters, A Polar Copper–Boron One-Electron σ-Bond, J. Am. Chem. Soc., 2013, 135, 3792–3795 CrossRef CAS PubMed.
- M. Sircoglou, S. Bontemps, G. Bouhadir, N. Saffon, K. Miqueu, W. Gu, M. Mercy, C.-H. Chen, B. M. Foxman, L. Maron, O. V. Ozerov and d. Bourissou, Group 10 and 11 Metal Boratranes (Ni, Pd, Pt, CuCl, AgCl, AuCl, and Au+) Derived from a Triphosphine−Borane, J. Am. Chem. Soc., 2008, 130, 16729–16738 CrossRef CAS PubMed.
- B. J. Graziano, T. R. Scott, M. V. Vollmer, M. J. Dorantes, V. G. Young, E. Bill, L. Gagliardi and C. C. Lu, One-electron bonds in copper–aluminum and copper–gallium complexes, Chem. Sci., 2022, 13, 6525–6531 RSC.
- I. Østrom, A. O. Ortolan, F. S. S. Schneider, G. F. Caramori and R. L. T. Parreira, Quest for Insight into Ultrashort C−H···π Proximities in Molecular “Iron Maidens”, J. Org. Chem., 2018, 83, 5114–5122 CrossRef PubMed.
- N. A. Dodd, Y. Cao, J. Bacsa, E. C. Towles, T. G. Gray and J. P. Sadighi, Three-Electron Nickel(I)/Nickel(0) Half-Bond, Inorg. Chem., 2022, 61, 16317 CrossRef CAS PubMed.
- D. Oliveira de Sousa and M. A. C. Nascimento, Are One-Electron Bonds Any Different from Standard Two-Electron Covalent Bonds?, Acc. Chem. Res., 2017, 50, 2264–2272 CrossRef PubMed.
- H. Braunschweig, R. D. Dewhurst, K. Hammond, J. Mies, K. Radacki and A. Vargas, Ambient-Temperature Isolation of a Compound with a Boron-Boron Triple Bond, Science, 2012, 336, 1420–1422 CrossRef CAS PubMed.
- J. Böhnke, H. Braunschweig, P. Constantinidis, T. Dellermann, W. C. Ewing, I. Fischer, K. Hammond, F. Hupp, J. Mies, H.-C. Schmitt and A. Vargas, Experimental Assessment of the Strengths of B–B Triple Bonds, J. Am. Chem. Soc., 2015, 137, 1766–1769 CrossRef PubMed.
- J. Echeverría, G. Aullón, D. Danovich, S. Shaik and S. Alvarez, Dihydrogen contacts in alkanes are subtle but not faint, Nat. Chem., 2011, 3, 323–330 CrossRef PubMed.
- K. M. Marczenko, H. P. A. Mercier and G. J. Schrobilgen, A Stable Crown Ether Complex with a Noble-Gas Compound, Angew. Chem., Int. Ed., 2018, 57, 12448–12452 CrossRef CAS PubMed.
- J. T. Goettel, H. P. A. Mercier and G. J. Schrobilgen, J. Fluorine Chem., 2018, 211, 60 CrossRef CAS.
- R. H. Crabtree and M. Lavin, A Structural Analysis of the Semibridging Carbonyl, Inorg. Chem., 1986, 25, 805–812 CrossRef CAS.
- M. E. Moussa, S. Welsch, L. Dütsch, M. Piesch, S. Reichl, M. Seidl and M. Scheer, The Triple-Decker Complex [Cp*Fe(μ,η5:η5-P5)Mo(CO)3] as a Building Block in Coordination Chemistry, Molecules, 2019, 24, 325 CrossRef PubMed.
- J. K. Puri, R. Singh and V. K. Chahal, Silatranes: a review on their synthesis, structure, reactivity and applications, Chem. Soc. Rev., 2011, 40, 1791–1840 RSC.
- S. Shaik, D. Danovich, W. Wu and A. Haaland, Charge-shift bonding and its manifestations in chemistry, Nat. Chem., 2009, 1, 443–449 CrossRef CAS PubMed.
- R. Carrasco, G. Aullón and S. Alvarez, X-X Through-Cage Bonding in Cu, Ni and Cr Complexes with M3X2 Cores (X = S, As), Chem. – Eur. J., 2009, 15, 536–546 CrossRef CAS PubMed.
- D. J. Liptrot and P. P. Power, London dispersion forces in sterically crowded inorganic and organometallic molecules, Nat. Rev. Chem., 2017, 1, 0004 CrossRef.
- P. R. Schreiner, L. V. Chernish, P. A. Gunchenko, E. Y. Tikhonchuk, H. Hausmann, M. Serafin, S. Schlecht, J. E. P. Dahl, R. M. K. Carlson and A. a. Fokin, Overcoming lability of extremely long alkane carbon–carbon bonds through dispersion forces, Nature, 2011, 477, 308–311 CrossRef CAS PubMed.
- Y. Ishigaki, T. Shimajiri, T. Takeda, R. Katoono and T. Suzuki, Longest C–C Single Bond among Neutral Hydrocarbons with a Bond Length beyond 1.8 Å, Chem, 2018, 1, 795–806 Search PubMed.
- J. Li, R. Pang, Z. Li, G. Lai, X.-Q. Xiao and T. Müller, Exceptionally Long C−C Single Bonds in Diamino-o-carborane as Induced by Negative Hyperconjugation, Angew. Chem., Int. Ed., 2019, 58, 1397–1401 CrossRef CAS PubMed.
- J. Llop, C. Viñas, J. M. Oliva, F. Teixidor, M. A. Flores, R. Kivekas and R. Sillanpäa, Modulation of the C–C distance in disubstituted 1,2-R2-o-carboranes. Crystal structure of closo 1,2-(SPh)2-1,2-C2B10H10, J. Organomet. Chem., 2002, 657, 232–238 CrossRef CAS.
- H. Arp, J. Baumgartner, C. Marschner, P. Zark and T. Müller, Dispersion Energy Enforced Dimerization of a Cyclic Disilylated Plumbylene, J. Am. Chem. Soc., 2012, 134, 6409–6415 CrossRef CAS PubMed.
- J. J. Novoa, P. Lafuente, R. E. Del Sesto and J. S. Miller, Exceptionally Long (≥ 2.9 Å) C–C Bonds between [TCNE]− Ions: Two-Electron, Four-Center π*-π* C–C Bonding in π -[TCNE]22-, Angew. Chem., Int. Ed., 2001, 40, 2540–2545 CrossRef CAS PubMed.
- H.-G. Stammler, P. Jutzi, W. Wieland and B. Neumann, (Tributylphosphine-P.)[1,2,4-tris(trimethylsilyl)cyclopentadienyl]silver(I), Acta Crystallogr., 1998, C34, 9800064 Search PubMed.
- R. Sievers, M. Sellin, S. M. Rupf, J. Parche and M. Malischewski, Introducing the Perfluorinated Cp* Ligand into Coordination Chemistry, Angew. Chem., Int. Ed., 2022, e202211147, DOI:10.1002/anie.202211147.
- J. M. Kieser, L. O. Jones, M. C. Uible, M. Zeller, G. C. Schatz and S. C. Bart, Late to the Party: Synthesis and Characterization of Tellurium and Selenium Half-Sandwich Complexes, Organometallics, 2021, 40, 4104–4109 CrossRef CAS.
- H. Hogeveen and P. W. Kwant, Direct observation of a remarkably stable dication of unusual structure: (CCH3)62+, Tetrahedron Lett., 1973, 14, 1665–1670 CrossRef.
- H. Hogeveen and P. W. Kwant, Pyramidal Mono- and Dications, Acc. Chem. Res., 1975, 8, 413–420 CrossRef CAS.
- M. Malischewski and K. Seppelt, Crystal Structure Determination of the Pentagonal-Pyramidal Hexamethylbenzene Dication C6(CH3)62+, Angew. Chem., Int. Ed., 2016, 55, 1–4 CrossRef.
- R. Hoffmann, Building Bridges Between Inorganic and Organic Chemistry, Angew. Chem., Int. Ed. Engl., 1982, 21, 711–724 CrossRef.
- K. D. Bos, E. J. Bulten, J. G. Noltes and A. L. Spek, The crystal and molecular structure of cyclopentadienyltin(II) chloride. The bonding of the cyclopentadienyl group in tin(II) compounds, J. Organomet. Chem., 1975, 99, 71–77 CrossRef CAS.
- R. K. Bohn, K. W. Hillig and R. L. Kuczowski, Pyrrole-argon: Microwave spectrum, structure, dipole moment, and 14N quadrupole coupling constants, J. Phys. Chem., 1989, 93, 3456–3459 CrossRef CAS.
- W. Caminali, P. G. Favero and B. Velino, Adducts of aromatic molecules with rare gases: rotational spectrum of pyrazole-argon, Chem. Phys., 1998, 239, 223–227 CrossRef.
- W. Caminali, S. Melandri, A. Millemaggi and P. G. Favero, Rotational spectrum of the imidazole-argon complex, Chem. Phys. Lett., 1998, 294, 377–380 CrossRef.
- S. G. Kukolich, Microwave structure measurements on the furan-argon complex, J. Am. Chem. Soc., 1983, 105, 2207–2210 CrossRef CAS.
- R. M. Spycher, L. Hausherr-Primo, G. Grassi and A. Bauder, Rotational spectra of isotopic furan-(argon)n, n=1,2, complexes and their vibrationally averaged structures, J. Mol. Struct., 1995, 351, 7–17 CrossRef CAS.
- W. Drescher and C. Kleeberg, Terminal versus Bridging Boryl Coordination in N-Heterocyclic Carbene Copper(I) Boryl Complexes: Syntheses, Structures, and Dynamic Behavior, Inorg. Chem., 2019, 58, 8215–8229 CrossRef CAS PubMed.
- N. Parvin, J. Hossain, A. George, P. Parameswaran and S. Khan, N-heterocyclic silylene stabilized monocordinated copper(i)–arene cationic complexes and their application in click chemistry, Chem. Commun., 2020, 56, 273–276 RSC.
- D. Franz, A. H. Ilkhechi, M. Bolte, H.-W. Lemer and M. Wagner, A Quest for Ligand-Unsupported Li+–π Interactions in Mono-, Di-, and Tritopic Lithium Arylborates, Eur. J. Inorg. Chem., 2011, 5414–5421 CrossRef CAS.
- A. V. Zabula, A. Y. Rogachev, I. A. Buzei and R. West, Silicon in a Negatively Charged Shell: Anions of Spirosilabifluorene, Organomet, 2013, 32, 3760–3768 CrossRef CAS.
- N. Solcà and O. Dopfer, Protonated Benzene: IR Spectrum and Structure of C6H7+, Angew. Chem., Int. Ed., 2002, 41, 3628–3631 CrossRef.
- S. Krieck, H. Gorls, L. Yu, M. Reiher and M. Westerhausen, Stable “Inverse” Sandwich Complex with Unprecedented Organocalcium(I): Crystal Structures of [(thf)2Mg(Br)-C6H2-2,4,6-Ph3] and [(thf)3Ca{μ-C6H3-1,3,5-Ph3}Ca(thf)3], J. Am. Chem. Soc., 2009, 131, 2977–2985 CrossRef CAS PubMed.
- C. Jones, L. McDyre, D. M. Murphy and A. Stasch, Magnesium(i) reduction of benzophenone and anthracene: first structural characterisation of a magnesium ketyl, Chem. Commun., 2010, 46, 1511–1513 RSC.
- B. Freitag, J. Pahl, C. Farber and S. Harder, Syntheses of Heteroleptic Amidinate Strontium Complexes Using a Superbulky Ligand, Organometallics, 2018, 37, 469–475 CrossRef CAS.
- X. Shi and J. Cheng, Reversible addition and hydrogenation of 1,1-diphenylethylene with a barium complex, Dalton Trans., 2019, 48, 8565–8568 RSC.
- Q. Wang, S. Pan, Y.-B. Wu, G. Deng, J.-H. Bian, G. Wang, L. Zhao, M. Zhou and G. Frenking, Transition-Metal Chemistry of Alkaline-Earth Elements: The Trisbenzene Complexes M(Bz)3 (M=Sr, Ba), Angew. Chem., Int. Ed., 2019, 58, 17365–17374 CrossRef CAS PubMed.
- K. Yuvaraj and C. Jones, Reductive coupling of CO with magnesium anthracene complexes: formation of magnesium enediolates, Chem. Commun., 2021, 57, 9224–9227 RSC.
- J. Pahl, A. Friedrich, H. Elsen and S. Harder, Cationic Magnesium π–Arene Complexes, Organomet, 2018, 37, 2901–2909 CrossRef CAS.
- B. Rosch, T. X. Gentner, J. Langer, C. Farber, J. Eyselein, L. Zhao, C. Ding, G. Frenking and S. Harder, Dinitrogen complexation and reduction at low-valent calcium, Science, 2021, 371, 1125–1128 CrossRef CAS PubMed.
- A. S. S. Wilson, M. S. Hill and M. F. Mahon, Calcium Hydride Insertion Reactions with Unsaturated C–C Bonds, Organomet, 2018, 38, 351–360 CrossRef.
- J. T. Boronski, A. E. Crumpton, L. L. Wales and S. Aldridge, Diberyllocene, a stable compound of Be(I) with a Be–Be bond, Science, 2023, 380, 1147–1149 CrossRef CAS PubMed.
- U. Thewalt, T. Zafiropoulos and H. Schmidbaur, Isolation and Crystal Structure of (Hexamethylbenzene)gallium(I) Tetrachlorogallate(III), a Mono(arene) Complex of Gallium(I), Z. Naturforsch., B: Chem. Sci., 1984, 39, 1642–1646 CrossRef.
- L. Kuppers and W. Frank, Investigation of mesitylene-solvated group 13 mixed-metal halides: syntheses and crystal structures of bis(1,3,5-trimethylbenzene)gallium(I) tetrachlorido- and tetrabromidoaluminate(III) and (1,3,5-trimethylbenzene)gallium(I) tetraiodidoaluminate(III). Variation of the gallium-π-arene bond strength, Z. Naturforsch., B: Chem. Sci., 2019, 74, 773–782 CrossRef.
- M. Schorpp, S. Rein, S. Weber, H. Scherer and I. Krossing, Guilty and charged: a stable solution of the hexamethylbenzene radical cation as a ligand forming oxidising agent, Chem. Commun., 2018, 54, 10036–10039 RSC.
- Y. Sarazin, N. Kaltsoyannis, J. A. Wright and M. Bochmann, Mono(arene) Complexes of Thallium(I) Supported by a Weakly Coordinating Anion, Organometallics, 2007, 26, 1811–1815 CrossRef CAS.
- E. V. Anslyn, Modern Physical Organic Chemistry, University Science Books, Sausalito, CA, 2006 Search PubMed.
- R. D. Shannon and C. T. Prewitt, Effective Ionic Radii in Oxides and Fluorides, Acta Crystallogr., 1969, B25, 925–946 CrossRef.
- R. D. Shannon, Revised Effective Ionic Radii and Systematic Studies of Interatomic Distances in Halides and Chalcogenides, Acta Crystallogr., 1976, A32, 751–767 CrossRef CAS.
- Y. Marcus, Ionic Radii in Aqueous Solutions, Chem. Rev., 1988, 88, 1475–1498 CrossRef CAS.
- E. Madelung, Das elektrische Feld in Systemen von regelmässig angeordneten Punktladungen, Phys. Z., 1918, 19, 524–533 Search PubMed.
- L. Liu and W. A. Bassett, Compression of Ag and phase transformation of NaCl, J. Appl. Phys., 1973, 44, 1475–1479 CrossRef CAS.
- I. E. Hooton and P. W. M. Jacobs, Ionic conductivity of pure and doped sodium chloride crystals, Can. J. Chem., 1988, 66, 830–835 CrossRef CAS.
- L. A. Martínez-Cruz, A. Ramos-Gallardo and A. Vegas, MSn and MSnO3 (M = Ca, Sr, Ba): New Examples of Oxygen-Stuffed Alloys, J. Solid State Chem., 1994, 110, 397–398 CrossRef.
- A. Vegas, Structural Models of Inorganic Crystals, From the elements to the compounds, Universitat Politècnica de València, Valencia, 2018 Search PubMed.
- M. Fu, S. Pan, L. Zhao and G. Frenking, Bonding Analysis of the Shortest Bond between Two Atoms Heavier than Hydrogen and Helium: O22+, J. Phys. Chem. A, 2020, 124, 1087–1092 CrossRef CAS PubMed.
- E. Blokker, X. Sun, J. Poater, J. M. van der Schuur, T. A. Hamlin and F. M. Bickelhaupt, The Chemical Bond: When Atom Size Instead of Electronegativity Difference Determines Trend in Bond Strength, Chem. – Eur. J., 2021, 27, 15616–15622 CrossRef CAS PubMed.
- A. Falceto and S. Alvarez, Comparison of the Cr-Cr quadruple and quintuple bonding mechanisms, Struct. Bonding, 2016, 170, 149–164 Search PubMed.
- L. Gagliardi and B. O. Roos, Quantum chemical calculations show that the uranium molecule U2 has a quintuple bond, Nature, 2005, 433, 848–851 CrossRef CAS PubMed.
- P. F. Souter, G. P. Kushto, L. Andrews and M. Neurock, Experimental and Theoretical Evidence for the Formation of Several Uranium Hydride Molecules, J. Am. Chem. Soc., 1997, 119 Search PubMed.
- M. Autillo, R. E. Wilson, M. Vasiliu, G. F. de Melo and D. A. Dixon, Periodic Trends within Actinyl(VI) Nitrates and Their Structures, Vibrational Spectra, and Electronic Properties, Inorg. Chem., 2022, 61, 15607–15618 CrossRef CAS PubMed.
- B. O. Roos, A. C. Borin and L. Gagliardi, Reaching the Maximum Multiplicity of the Covalent Chemical Bond, Angew. Chem., Int. Ed., 2007, 46, 1469–1472 CrossRef CAS PubMed.
- J. Echeverría, G. Aullón and S. Alvarez, Dihydrogen Interactions in Group 13 Compounds: H···H or E···H (E = B, Al, Ga) Interactions?, Dalton Trans., 2017, 46, 2844–2854 RSC.
- M. B. Brands, J. Nitsch and C. Fonseca-Guerra, Relevance of Orbital Interactions and Pauli Repulsion in the Metal−Metal Bond of Coinage Metals, Inorg. Chem., 2018, 57, 2603 CrossRef CAS PubMed.
- A. Carvajal, S. Alvarez and J. J. Novoa, The Nature of Intermolecular CuI···CuI Interactions: A Combined Theoretical and Structural Database Analysis, Chem. – Eur. J., 2004, 10, 2117–2132 CrossRef PubMed.
- J. Echeverría, J. D. Velasquez and S. Alvarez, Understanding the Interplay of Dispersion, Charge Transfer, and Electrostatics in Noncovalent Interactions: The Case of Bromine−Carbonyl Short Contacts, Cryst. Growth Des., 2020, 20, 7180–7187 CrossRef.
- I. Benito, R. M. Gomila and A. Frontera, On the energetic stability of halogen bonds involving metals: implications in crystal engineering, CrystEngComm, 2022, 24, 4440–4446 RSC.
- A. K. Srivastava and N. Misra, Calculating interaction energies of hydrogen bonded dimers and complexes of HF, H2O and NH3: Super-molecular versus AIM Approach, J. Comput. Methods Mol. Des., 2014, 4, 19–23 Search PubMed.
- M. Freindorf, E. Kraka and D. Cremer, A Comprehensive Analysis of Hydrogen Bond Interactions Based on Local Vibrational Modes, Int. J. Quantum Chem., 2012, 112, 3174–3187 CrossRef CAS.
- L. Zhao, M. von Hopffgarten, D. M. Andrada and G. Frenking, Energy decomposition analysis, Wiley Interdiscip. Rev.: Comput. Mol. Sci., 2018, 8, e1345 Search PubMed.
- G. Gayatri, Y. Soujanya, I. Fernández, G. Frenking and G. N. Sastry, Further Shortening of the C-C Single Bond in Substituted Tetrahedranyl Tetrahedrane Systems: An Energy Decomposition Analysis, J. Phys. Chem. A, 2008, 112, 12919–12924 CrossRef CAS PubMed.
- L. Zhang, F. Ying, W. Wu, P. C. Hiberty and S. Shaik, Topology of Electron Charge Density for Chemical Bonds from Valence Bond Theory: A Probe of Bonding Types, Chem.–Eur. J., 2009, 15, 2979–2989 CrossRef CAS PubMed.
- M. Kaupp, D. Danovich and S. Shaik, Chemistry is about energy and its changes: A critique of bond-length/bond-strength correlations, Coord. Chem. Rev., 2017, 344, 355–362 CrossRef CAS.
- M. S. Nechaev, V. M. Rayón and G. Frenking, Energy Partitioning Analysis of the Bonding in Ethylene and Acetylene Complexes of Group 6, 8, and 11 Metals: (CO)5TM-C2Hx and Cl4TM-C2Hx (TM) Cr, Mo, W), (CO)4TM-C2Hx (TM) Fe, Ru, Os), and TM+-C2Hx (TM = Cu, Ag, Au), J. Phys. Chem. A, 2004, 108, 3134–3142 CrossRef CAS.
- R. Tonner, G. Heydernrych and G. Frenking, Bonding Analysis of N-Heterocyclic Carbene Tautomers and Phosphine Ligands in Transition-Metal Complexes: A Theoretical Study, Chem.–Asian J., 2007, 2, 1555–1567 CrossRef CAS PubMed.
- L. d. A. Santos, S. C. C. van der Lubbe, T. A. Hamlin, T. C. Ramalho and F. M. Bickelhaupt, A Quantitative Molecular Orbital Perspective of the Chalcogen Bond, ChemistryOpen, 2021, 10, 391–401 CrossRef PubMed.
- J. D. Velasquez, J. Echeverría and S. Alvarez, Structure and bonding of halonium compounds, Inorg. Chem., 2023, 23, 8980–8992 CrossRef PubMed.
- N. Kumar, S. Saha and G. N. Sastry, Towards developing a criterion to characterize non-covalent bonds: a quantum mechanical study, Phys. Chem. Chem. Phys., 2021, 23, 8478–8488 RSC.
- S. J. Grabowski, What Is the Covalency of Hydrogen Bonding?, Chem. Rev., 2011, 111, 2597–2625 CrossRef CAS PubMed.
- L. M. P. Madureira, L. G. Dias, R. L. T. Parreira and G. F. Caramori, Shedding light on the physical nature of ion pair involving carba-closo-dodecaborate anions. Insights from computation, Phys. Chem. Chem. Phys., 2023, 25, 5710–5717 RSC.
Footnotes |
| † Dedicated to Prof. Juan J. Novoa, in memoriam. |
| ‡ Electronic supplementary information (ESI) available. See DOI: https://doi.org/10.1039/d3sc02238b |
| This journal is © The Royal Society of Chemistry 2023 |

