 Open Access Article
Coreactant-free polyfluorene nanoparticles for the electrochemiluminescence quantitative analysis of dopamine and norepinephrine†
Guomin
Yang
,
Kejun
Tan
 *,
Jun
Yang
 ,
Ruo
Yuan
 and
Shihong
Chen
 *
*
Key Laboratory of Luminescence Analysis and Molecular Sensing (Southwest University), Ministry of Education, College of Chemistry and Chemical Engineering, Southwest University, Chongqing 400715, PR China. E-mail: tankj@swu.edu.cn; cshong@swu.edu.cn; Fax: +86 23 68253172; Tel: +86 23 68253172
First published on 19th December 2022
Abstract
Both dopamine (DA) and norepinephrine (NE) are important hormones and neurotransmitters in the human body. Their coreactant-free electrochemiluminescence (ECL) analysis is very promising and challenging. Herein, poly[(9,9-dioctylfluorenyl-2,7-diyl)-co-(1,4-benzo-{2,1′,3}-thiadazole)] nanoparticles (PFBT NPs) were prepared via a nanoprecipitation method and further developed as a coreactant-free ECL emitter due to its strong ECL emission without any exogenous coreactant. The ECL emission of PFBT NPs can be efficiently quenched by DA and NE rooting in the resonance energy transfer (RET) between excited PFBT NPs and oxidized DA and NE, thus achieving the coreactant-free ECL quantitative analysis of DA and NE. The corresponding linear ranges were 1.0 × 10⁻⁹–1.0 × 10⁻⁴ M and 5.0 × 10⁻⁹–5.0 × 10⁻⁴ M, corresponding detection limits were 4.0 × 10⁻¹⁰ M and 1.2 × 10⁻⁹ M, and corresponding quantification limits were 1.1 × 10⁻⁹ M and 3.5 × 10⁻⁹ M respectively. The PFBT NPs provided a coreactant-free ECL sensing platform for quantitative analysis of DA and NE and displayed promising applications in ECL analysis.
1. Introduction
Dopamine (DA) and norepinephrine (NE), as important hormones and neurotransmitters, play crucial roles in controlling the behavior and activities of the human body and regulating diversified physiological functions of each system. The dysregulation of DA and NE is implicated in a variety of neurodegenerative diseases such as Schizophrenia, Parkinson's disease, attention deficit hyperactivity disorder and depression.1–3 Therefore, their accurate detection is of great clinical value. The reported detection methods mainly include fluorescence,4,5 electrochemistry,6,7 colorimetry,8 and mass spectrometry.9 These methods are restricted by complicated operation or low sensitivity or expensive instruments. There is a compelling need to develop a sensitive, inexpensive, easy-to-operate analytical method for detecting DA and NE.Electrochemiluminescence (ECL) has emerged as a promising analytical technology in various fields because of its appealing merits such as rapidness, convenience, low background and high sensitivity.10–13 In particular, it has been applied to the analysis of DA and NE.14–17 For example, Cu@CdInS NCs/O2 and Pd nanocones/tripropylamine (TPrA) ECL systems were respectively constructed to achieve ECL detection of DA.14,15 Sun's group and Cui's group severally established luminol/O2 and Ru(II)/TPrA ECL systems to detect DA and NE.18,19 Nevertheless, these reported ECL assays involved the application of coreactants such as O2, TPrA or K2S2O8 for pursuing sensitive results. As is well known, the application of these coreactants may cause the toxicity, stability or repeatability problems.20,21 Therefore, it is imperative to develop a novel ECL platform without any exogenous reagent or dissolved O2 as coreactant for analyzing DA and NE.
Polyfluorene and its derivatives have attracted considerable attention in fluorescent imaging,22 cellular labeling23,24 as well as ECL sensing25,26 because of the high fluorescence quantum yield, excellent photostability and non-toxic.27,28 Two kinds of polymer dots were prepared using different polyfluorene derivatives to construct ECL biosensors for detecting Pb2+ and proteins in the case of amine as coreactant, respectively.26,29 Recently, the carboxylated PFBT nanoparticles were found to exhibit an excellent ECL property excluding exogenous coreactant and dissolved O2, so were used to construct enzyme biosensor for coreactant-free detection of organophosphorus pesticides by our group.30 At present, there is no report of using polyfluorene-based coreactant-free ECL system to quantitatively analyze DA and NE.
Illuminated by above studies, a coreactant-free ECL system with PFBT NPs as emitters was elaborately designed for sensitively analyzing DA and NE in this work. Initially, PFBT was carboxyl-functionalized using poly(styrene-co-maleic anhydride) (PSMA) to prepare PFBT NPs, which emitted a strong ECL signal without dissolved O2 and exogenous reagents as coreactant. Subsequently, the glass carbon electrode (GCE) was modified with PFBT NPs to construct a coreactant-free sensing. Since DA or NE are easily oxidized into ortho-benzoquinone derivatives, which would efficiently quench ECL emission from PFBT NPs to achieve sensitive determination of DA and NE. Significantly, PFBT NPs provided a facile and sensitive coreactant-free ECL sensing platform for quantitative analyzing DA and NE.
2. Experimental section
2.1 Instruments and materials
The descriptions of materials and instruments are displayed in the ESI.†2.2 Preparation of PFBT NPs
A facile nanoprecipitation method reported by the literature31 was applied to prepare PFBT NPs (Scheme 1A). In detail, PFBT (1.0 mg) and PSMA (0.2 mg) were severally dissolved in tetrahydrofuran (THF) with vigorous ultrasonication for 4 h to obtain corresponding solution (1.0 mg mL−1). Subsequently, the two solutions were mixed and sonicated continuously for 2 h. The resultant mixed solution was fleetly injected into ultrapure water (20 mL). After THF was completely volatilized under stirring at 75 °C, the dispersion of PFBT NPs was obtained.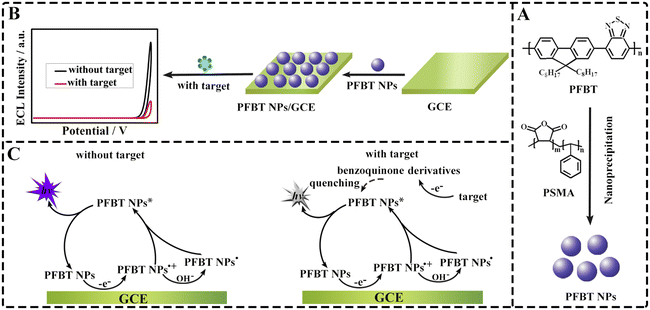 | ||
| Scheme 1 Schematic diagrams of (A) preparation PFBT NPs by PTBT and PSMA; (B) sensor construction and (C) ECL response mechanism of sensor to DA and NE. | ||
2.3 Construction of the sensor
The alumina slurries (0.3 and 0.05 μm) were used to scour repetitiously the glassy carbon electrode (GCE, Φ = 4 mm). After washed thoroughly with ethanol and deionized water, the surface of GCE was coated with 12 μL of PFBT NPs dispersion (0.05 mg mL−1) and then dried at ambient temperature for 12 h to obtain the sensor (PFBT NPs/GCE). Scheme 1B depicts the modification process of the sensor.2.4 ECL measurement
The ECL responses of PFBT NPs/GCE to different concentrations of DA and NE were collected through the MPI-E multifunctional electrochemical and chemiluminescent analytical system. A three-electrode system consisting of counter electrode (platinum wire electrode), reference electrode (Ag/AgCl (saturated KCl electrode)) and working electrode (modified GCE) was used. Unless otherwise stated (optimization of pH), the ECL test conditions included the test solution (0.10 M PBS, 3.0 mL, pH 7.4), potential scanning range (0–+1.25 V), scan rate (0.3 V s−1), amplifier series (4) and potential of photomultiplier tube (700 V).3. Results and discussion
3.1 Characterization of PFBT NPs
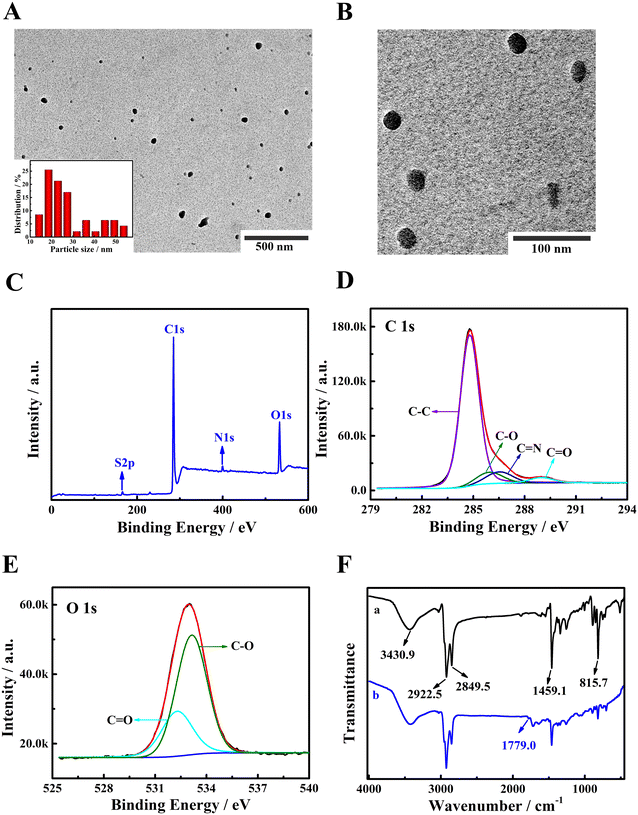
Transmission electron microscopy (TEM) was applied to investigate the morphology of PFBT NPs. As depicted in Fig. 1A and B, the spherical PFBT NPs can obviously be observed. The size distribution histogram image (insert of Fig. 1A) shows that the size of PFBT NPs was between 13–55 nm and an average size was around 28 nm.Subsequently, the synthesis of carboxyl-functionalized PFBT NPs was further confirmed using X-ray photoelectron spectroscopy (XPS) and Fourier transform infrared (FT-IR) spectroscopy. Fig. 1C displays the XPS survey of PFBT NPs, and the characteristic peaks of O 1s (532.94 eV), N 1s (399.52 eV), C 1s (284.8 eV), and S 2p (165.56 eV) were observed. Furthermore, for C 1s region (Fig. 1D), the peaks at 284.79, 285.95, 286.52 and 288.97 eV were attributed to the C–C, C–O, C![[double bond, length as m-dash]](https://www.rsc.org/images/entities/char_e001.gif) N and C
N and C![[double bond, length as m-dash]](https://www.rsc.org/images/entities/char_e001.gif) O, respectively. As shown in Fig. 1E, two peaks at 532.49 eV and 533.68 eV were ascribed to the corresponding C–O and C
O, respectively. As shown in Fig. 1E, two peaks at 532.49 eV and 533.68 eV were ascribed to the corresponding C–O and C![[double bond, length as m-dash]](https://www.rsc.org/images/entities/char_e001.gif) O from O 1s. Above results proved the existence of C
O from O 1s. Above results proved the existence of C![[double bond, length as m-dash]](https://www.rsc.org/images/entities/char_e001.gif) O, indicating the successful synthesis of carboxyl-functionalized PFBT NPs. In addition, FT-IR spectra of PFBT and PFBT NPs were collected and the results are shown in Fig. 1F. As for FT-IR spectrum of PFBT (curve a), the aromatic ring breathing vibration produced a strong peak at 1459.1 cm−1. The C–H stretching vibrations of the alkane chain of PFBT were situated at 2849.5 cm−1 and 2922.5 cm−1. The absorption peak at 815.7 cm−1 was ascribed to the out-of-plane deformation vibration of C–H. Compared with FT-IR spectra of PFBT, PFBT NPs (curve b) displayed a characteristic peak at 1779.0 cm−1, which belonged to the stretching vibrations of carbonyl species. FT-IR results also identified the successful preparation of carboxyl-functionalized PFBT NPs.
O, indicating the successful synthesis of carboxyl-functionalized PFBT NPs. In addition, FT-IR spectra of PFBT and PFBT NPs were collected and the results are shown in Fig. 1F. As for FT-IR spectrum of PFBT (curve a), the aromatic ring breathing vibration produced a strong peak at 1459.1 cm−1. The C–H stretching vibrations of the alkane chain of PFBT were situated at 2849.5 cm−1 and 2922.5 cm−1. The absorption peak at 815.7 cm−1 was ascribed to the out-of-plane deformation vibration of C–H. Compared with FT-IR spectra of PFBT, PFBT NPs (curve b) displayed a characteristic peak at 1779.0 cm−1, which belonged to the stretching vibrations of carbonyl species. FT-IR results also identified the successful preparation of carboxyl-functionalized PFBT NPs.
The water contact angles of PFBT and PFBT NPs were detected and the results are illustrated in Fig. S1A and B in ESI.† The water contact angle of PFBT was 131.09° while that of PFBT NPs was 0°. Compared with PFBT, the wettability of PFBT NPs distinctly increased, manifesting that carboxylation with PSMA was beneficial to improve hydrophilicity of PFBT. In addition, the zeta potential of PFBT NPs was detected as −16.02 mV (Fig. S1C†), proving that PFBT NPs were negatively charged, which was attributed to the –COOH on PFBT NPs surface. The above analysis revealed the successful preparation of PFBT NPs. Then, XRD characterization of PFBT NPs was performed. As seen from Fig. S1D,† no any sharp crystalline peaks were observed, indicating that PFBT NPs were non-crystalline structure. Finally, ECL responses of PFBT/GCE and PFBT NPs/GCE were compared in PBS (0.10 M, pH 7.4). As depicted in Fig. S2,† compared with PFBT/GCE (curve a), PFBT NPs/GCE showed significantly enhanced ECL emission (curve b), indicating that carboxylation with PSMA was beneficial to improve ECL emission of PFBT.
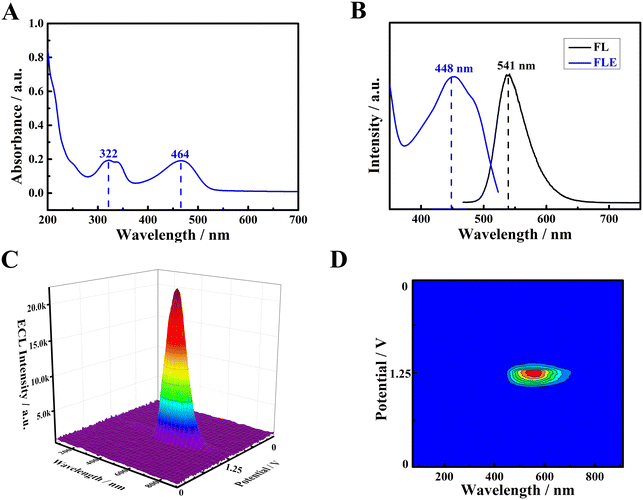
Additionally, the optical properties of PFBT NPs were also explored through ultraviolet-visible (UV-vis) spectrometer and fluorescence spectrometer. The UV-vis spectrum of PFBT NPs is shown in Fig. 2A and two strong characteristic absorption peaks at around 322 nm and 466 nm were observed. Meanwhile, as seen from Fig. 2B, PFBT NPs exhibited the maximum fluorescence emission wavelength (black curve) and fluorescence excitation wavelength (blue curve) at 541 nm and 448 nm, correspondingly. Next, ECL–potential–wavelength measurements of PFBT NPs were performed, and corresponding experimental details are presented in ESI.†Fig. 2C and D depict the 3D surface image and planar heat map, respectively, which displayed the maximum ECL emission wavelength of 545 nm at +1.25 V.
3.2 Characterization of the sensor assembly
The assembly of sensor was characterized by cyclic voltammetry (CV) in K3Fe(CN)6/K4Fe(CN)6 (1![[thin space (1/6-em)]](https://www.rsc.org/images/entities/char_2009.gif) :
:![[thin space (1/6-em)]](https://www.rsc.org/images/entities/char_2009.gif) 1) solution (5.0 mM) and Fig. 3A depictures the results. Curve a was the CV curve of bare GCE. Compared with it, a declined redox peak current was detected at PFBT NPs/GCE (curve b), which was ascribed to the poor conductivity of PFBT NPs. The electrochemical impedance spectroscopy (EIS) was further applied to characterize the assembly of sensor. As depicted in Fig. 3B, the bare GCE presented a small semicircle in impedance spectrum (curve a), while the semicircle augmented obviously with the modification of PFBT NPs on GCE, which indicated that PFBT NPs inhibited the electron transfer of redox probe [Fe(CN)6]3−/4− at electrode surface. Insert of Fig. 3B displays the equivalent circuit diagram for impedance. Obviously, the successful fabrication of the sensor (PFBT NPs/GCE) was confirmed by CV and EIS characterization.
1) solution (5.0 mM) and Fig. 3A depictures the results. Curve a was the CV curve of bare GCE. Compared with it, a declined redox peak current was detected at PFBT NPs/GCE (curve b), which was ascribed to the poor conductivity of PFBT NPs. The electrochemical impedance spectroscopy (EIS) was further applied to characterize the assembly of sensor. As depicted in Fig. 3B, the bare GCE presented a small semicircle in impedance spectrum (curve a), while the semicircle augmented obviously with the modification of PFBT NPs on GCE, which indicated that PFBT NPs inhibited the electron transfer of redox probe [Fe(CN)6]3−/4− at electrode surface. Insert of Fig. 3B displays the equivalent circuit diagram for impedance. Obviously, the successful fabrication of the sensor (PFBT NPs/GCE) was confirmed by CV and EIS characterization.
3.3 Feasibility analysis of the sensing platform
The feasibility of the constructed ECL sensing platform for DA and NE analysis was explored and Fig. 3C depictures the corresponding results. For bare GCE (curve a), no ECL signal was detected. However, a strong ECL signal was detected at PFBT NPs/GCE (curve b) without any exogenous coreactant. When 1.0 × 10⁻⁴ M DA was added in 0.10 M PBS (curve c), the ECL signal at PFBT NPs/GCE was dramatically quenched. In the presence of 5.0 × 10⁻⁴ M NE in 0.10 M PBS (curve d), a similar situation was observed, namely the ECL signal at PFBT NPs/GCE was also dramatically quenched.3.4 ECL emission and quenching mechanisms
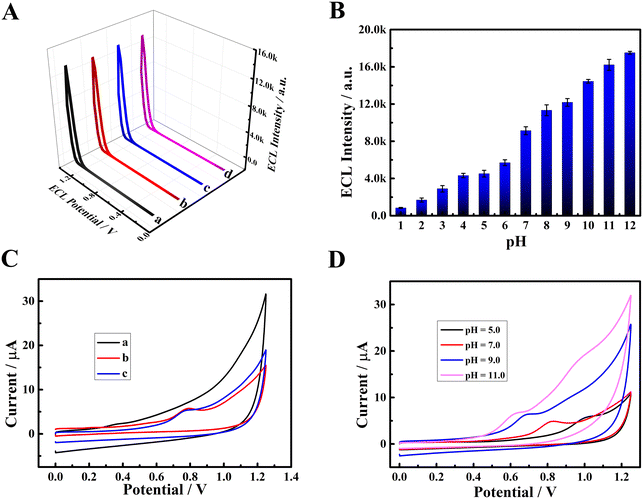
Initially, the influence of dissolved O2 and active oxygen species (O2˙− and OH˙) in PBS on the ECL emission of PFBT NPs was studied in detail (Fig. 4A). N2, superoxide dismutase (SOD) and L-cysteine (L-cys) were used to remove O2, superoxide radicals (O2˙−) and hydroxyl radicals (OH˙) in PBS, respectively. Compared with the ECL emission of PFBT NPs/GCE in air-saturated PBS (curve a), negligible changes were observed in air-free PBS (curve b) or O2˙−-free PBS (curve c) or OH˙-free PBS (curve d), demonstrating that dissolved O2 and active oxygen species (O2˙− and OH˙) in PBS have no significant influence on ECL emission of PFBT NPs. Subsequently, the effect of OH− on the ECL emission of PFBT NPs was explored in PBS at different pH, and the results are shown in Fig. 4B. The ECL signal of PFBT NPs/GCE significantly enhanced with pH increasing from 1.0 to 12.0, demonstrating that OH− played an important role. In addition, the CV behavior of bare GCE and PFBT NPs/GCE under different conditions were recorded to further investigate the effect mechanism of OH− on the ECL emission of PFBT NPs. As shown in Fig. 4C, compared with the CV curve of bare GCE in air-saturated PBS (pH 7.4, 0.10 M), an obvious oxidation peak at about +0.78 V was observed when PFBT NPs/GCE was tested in air-saturated (curve b) and air-free (curve c) PBS (pH 7.4, 0.10 M), indicating that the oxidation peak originated from PFBT NPs. Especially, with pH increasing from 5.0 to 11, the oxidation peak shifted from about +1.02 to +0.63 V (Fig. 4D), indicating that increased pH favored the oxidation of PFBT NPs. According to above experimental results and related literature report,30 the possible ECL mechanisms of PFBT NPs were speculated as following. Initially, PFBT NPs were oxidized to PFBT NPs+˙ at the electrode through an electrooxidation process. The produced PFBT NPs+˙ further reacted with OH− coming from the PBS (pH 7.4) to generate intermediate free radicals PFBT NPs˙. PFBT NPs+˙ reacted with PFBT NPs˙ to produce excited state PFBT NPs*. Finally, PFBT NPs* came back to the ground state accompanying with ECL emission (Scheme 1C). With the increase of pH, PFBT NPs were more easily oxidized to PFBT NPs+˙, and the ECL emission of PFBT NPs increased accordingly.In order to explore the possible quenching mechanisms of DA and NE to the ECL emission of PFBT NPs, the following experiments were carried out. Initially, CV was used to study the electrochemical oxidation of DA and NE, corresponding results are displayed in Fig. S3A and B.† As potential ranging from 0 to +1.25 V, an obvious oxidation peak appeared at about +0.22 V (Fig. S3A†) and +0.27 V (Fig. S3B†), respectively, indicating that DA and NE were electrooxidized. Additionally, as exhibited in Fig. S3C,† the UV-vis absorption spectrum of oxidized DA (curve b) and oxidized NE (curve c) could partially overlap with the ECL spectrum of PFBT NPs (curve a), indicating the existence of resonance energy transfer (RET) between PFNT NPs and oxidized DA and oxidized NE. According to related literatures,32–34 DA and NE, belonging to catecholamine neurotransmitters, were easily oxidized into ortho-benzoquinone (BQ) species, which served as accepter and could effectively quench the ECL emission of emitters through RET. Therefore, it was speculated that DA and NE are oxidized into BQ species, which could act as energy acceptors to quench the ECL emission from PFBT NPs through RET (Scheme 1C).
3.5 Analytical performance of sensor for DA and NE detection
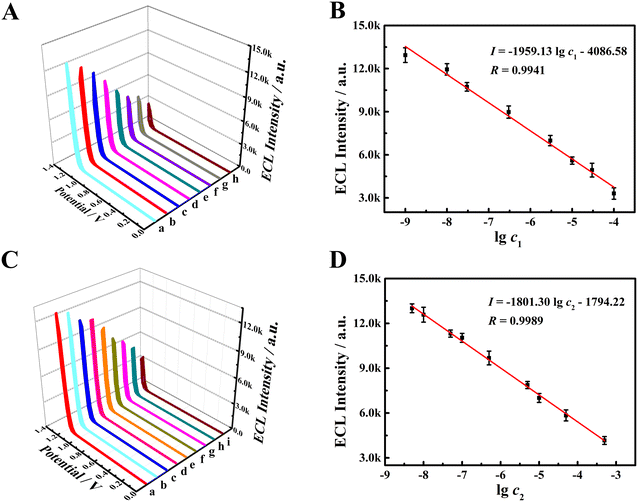
The modification amount of PFBT NPs dispersion and pH of PBS were optimized to obtain a good ECL response of the sensor. As a result, the optimal modification amount and pH were 12 μL and 7.4, respectively. The corresponding results are depicted in Fig. S4A and B† and corresponding descriptions are presented in ESI.†The ECL responses of the sensor to DA and NE were severally studied under the optimized experimental conditions. Fig. 5A depictures the ECL response of DA at the sensor. As DA concentration increased from 1.0 × 10⁻⁹ M to 1.0 × 10⁻⁴ M, the ECL intensity gradually descended. A good linear relationship between ECL intensity and logarithm of DA concentration is presented in Fig. 5B, and the linear regression equation (I = −1959.13![[thin space (1/6-em)]](https://www.rsc.org/images/entities/char_2009.gif) lg
lg![[thin space (1/6-em)]](https://www.rsc.org/images/entities/char_2009.gif) c1 − 4086.58), the detection limit (LOD, 4.0 × 10⁻¹⁰ M) at S/N = 3 and the quantification limit (LOQ, 1.1 × 10⁻⁹ M) at S/N = 10 were obtained. Similarly, the ECL response of NE at the sensor was tested and Fig. 5C and D display the results. The ECL intensity sharply declined with NE concentration growing (Fig. 5C). From the calibration curve (Fig. 5D), with the increase of NE concentration from 5.0 × 10⁻⁹ M to 5.0 × 10⁻⁴ M, a good linear relationship was observed between the ECL intensity and the logarithmic value of NE concentration, fitted as I = −1801.30
c1 − 4086.58), the detection limit (LOD, 4.0 × 10⁻¹⁰ M) at S/N = 3 and the quantification limit (LOQ, 1.1 × 10⁻⁹ M) at S/N = 10 were obtained. Similarly, the ECL response of NE at the sensor was tested and Fig. 5C and D display the results. The ECL intensity sharply declined with NE concentration growing (Fig. 5C). From the calibration curve (Fig. 5D), with the increase of NE concentration from 5.0 × 10⁻⁹ M to 5.0 × 10⁻⁴ M, a good linear relationship was observed between the ECL intensity and the logarithmic value of NE concentration, fitted as I = −1801.30![[thin space (1/6-em)]](https://www.rsc.org/images/entities/char_2009.gif) lg
lg![[thin space (1/6-em)]](https://www.rsc.org/images/entities/char_2009.gif) c2 − 1794.22. And the LOD of 1.2 × 10⁻⁹ M (S/N = 3) and the LOQ of 3.5 × 10⁻⁹ M (S/N = 10) were obtained. The comparison in the analytical performance was performed between our constructed sensor and other methods. As seen in Table S1 in ESI,† our sensor exhibited a more excellent analytical performance.
c2 − 1794.22. And the LOD of 1.2 × 10⁻⁹ M (S/N = 3) and the LOQ of 3.5 × 10⁻⁹ M (S/N = 10) were obtained. The comparison in the analytical performance was performed between our constructed sensor and other methods. As seen in Table S1 in ESI,† our sensor exhibited a more excellent analytical performance.
3.6 Selectivity, stability and repeatability of sensor
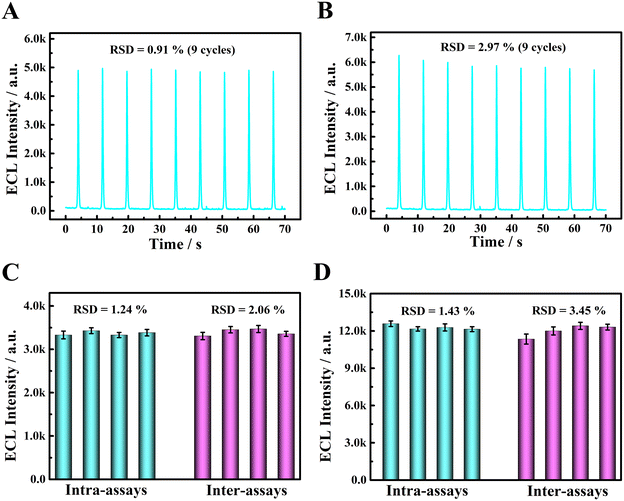
The selectivity is one of the important analytical performance of sensor. The ascorbic acid (AA), uric acid (UA), glucose (Glu), K+, glycine (Gly) L-arginine (L-Arg), L-cysteine (L-Cys), histidine (His), 5-hydroxytryptamine (5-HT) and epinephrine (Ep) were chosen as the potentially interfering substances to investigate the selectivity of the sensor. Their concentrations were all 1.0 × 10⁻³ M, which was equivalent to 100 times of DA or NE concentration (1.0 × 10⁻⁵ M). As displayed in Fig. S5,† compared to the blank (column a), the ECL intensity of the sensor presented a negligible change when AA, UA, Glu, K+, Gly L-Arg, L-Cys and His (column b–i) were present, manifesting negligible interference from these substances. However, both 5-HT (column j) and Ep (column k) can obviously decrease the ECL signal of the sensor. Although the sensor exhibited more sensitive ECL responses to targets DA (column l) and NE (column m), the interference of 5-HT and Ep was not negligible. In fact, our ECL sensor was not selective for catecholamine substances (DA, NE, Ep) and 5-HT and this is major limitations of our ECL system.Subsequently, the stability of the sensor was explored. On the one hand, the PFBT NPs/GCE was stored at room temperature for 30 days and their ECL signals were collected every 5 days in PBS (0.10 M, pH 7.4). As displayed in Fig. S6,† after 30 days, the ECL signal intensity remained 92% of its initial value, indicating an excellent storage stability of the sensor. On the other hand, 9 consecutive cyclic scans were performed at PFBT NPs/GCE in 0.10 M PBS (pH 7.4) containing 3.0 × 10⁻⁵ M DA and 5.0 × 10⁻⁵ M NE, respectively. As depicted in Fig. 6A and B, the relative standard deviations (RSD) of the ECL signals for 9 cycles were both below 5.0%, showing a pleasurable operational stability.
What's more, intra-assays and inter-assays were used to evaluate the reproducibility of the sensor. In the case of intra-assay, four different GCEs were pretreated in the same way and then were modified with 12 μL of PFBT NPs dispersion (0.05 mg mL−1), resulting in four ECL sensors from the same batch. In the case of inter-assay, the same GCE was pretreated and further modified with 12 μL of PFBT NPs dispersion (0.05 mg mL−1) four times in parallel, resulting in four ECL sensors from four different batches. Subsequently, the ECL responses of four sensors from the same batch towards 1.0 × 10⁻⁴ M DA and 1.0 × 10⁻⁸ M NE were collected in 3.0 mL PBS (0.10 M, pH 7.4), respectively, achieving intra-assays of DA and NE. Similarly, the ECL responses of four sensors from four different batches towards 1.0 × 10⁻⁴ M DA and 1.0 × 10⁻⁸ M NE were collected in 3.0 mL PBS (0.10 M, pH 7.4), respectively, achieving inter-assays of DA and NE. As shown in Fig. 6C, the RSDs were 1.24% and 2.06% for intra-assays and inter-assays of DA, respectively. The RSDs were 1.43% and 3.45% for intra-assays and inter-assays of NE, respectively (Fig. 6D). Above results indicated a favorable repeatability of the sensor.
3.7 Application of the sensor for the detection of DA and NE in ACSF
To evaluate the applicability of the constructed ECL sensor, recovery experiments were performed using artificial cerebral spinal fluid (ACSF) as the real sample. Meanwhile, the high performance liquid chromatography (HPLC) was adopted as standard technique to evaluate the accuracy and applicability of the sensor. The recovery experiments of DA and NA were performed in ACSF using HPLC and the ECL sensor and the results of the two test methods were compared. No DA and NA was detected in ACSF. When the added concentrations of DA and NA were chosen to be 100 μM, 50.0 μM, and 5.00 μM, the relative error (Er) of ECL detection results was calculated with HPLC detection results as standard values, and the calculation formula was presented as follows:| Er = [cdetected(ECL) − cdetected(HPLC)]/cdetected(HPLC) × 100% |
The detection results of DA in ACSF sample by HPLC and ECL sensor are presented in Table S2.† The recoveries of HPLC and ECL assays were in the range of 96.4–101% and 94.8–104%, respectively. The relative errors of ECL detection results were 2.0%, −1.7% and 5.3%, respectively. The detection results of NE in ACSF sample by HPLC and ECL sensor are displayed in Table S3.† The recoveries of HPLC and ECL assays were in the range of 97.8–105% and 100–106%, respectively. The relative errors of ECL detection results were 1.0%, 2.7% and 2.2%, respectively. About results confirmed the accuracy and applicability of our proposed ECL sensor.
4. Conclusions
A simple and sensitive coreactant-free ECL sensor with PFBT NPs as probes was developed to quantitatively analyze DA and NE. The prepared PFBT NPs exhibited a satisfactory dispersion and superior ECL performance in aqueous solution excluding dissolved O2 and exogenous reagent as coreactants. The sensor showed high sensitivity, excellent stability and reproducibility, and potential practical application capability for DA and NE assays. Moreover, the proposed ECL sensor displayed an acceptable selectivity against AA, UA, Glu, K+, Gly L-Arg, L-Cys and His. However, the interference of neurotransmitters 5-HT and Ep was not negligible. Such a strategy significantly overcame the limitations of the introduction of exogenous coreactant, and provided a promising ECL platform for quantitative analysis of DA and NE.Conflicts of interest
There are no conflicts to declare.Acknowledgements
This work was supported by National Natural Science Foundation of China (21775122), and Natural Science Foundation of Chongqing City (CSTB2022NSCQ-MSX0586, cstc2018jcyjAX0693), China.Notes and references
- C. Rangel-Barajas, I. Coronel and B. Florán, Aging Dis., 2015, 6, 349–368 CrossRef PubMed.
- K. L. Davis, R. S. Kahn, G. Ko and M. Davidson, Am. J. Psychiatry, 1991, 148, 1474–1486 CrossRef CAS PubMed.
- K. Y. Tong, J. Zhao, C. W. Tse, P. K. Wan, J. H. Rong and H. Y. Au-Yeung, Chem. Sci., 2019, 10, 8519–8526 RSC.
- W. J. He, R. J. Gui, H. Jin, B. Q. Wang, X. N. Bu and Y. X. Fu, Talanta, 2018, 178, 109–115 CrossRef CAS PubMed.
- A. Yildirim and M. Bayindir, Anal. Chem., 2014, 86, 5508–5512 CrossRef CAS PubMed.
- J. Yang, Y. Hu and Y. C. Li, Biosens. Bioelectron., 2019, 135, 224–230 CrossRef CAS PubMed.
- Y. R. Huang, Y. Tang, S. C. Xu, M. Feng, Y. S. Yu, W. W. Yang and H. B. Li, Anal. Chim. Acta, 2020, 1096, 26–33 CrossRef CAS PubMed.
- C. Y. Liu, F. A. Gomez, Y. Q. Miao, P. Cui and W. Lee, Talanta, 2019, 194, 171–176 CrossRef CAS PubMed.
- J. K. Lee, E. T. Jansson, H. G. Nam and R. N. Zare, Anal. Chem., 2016, 88, 5453–5461 CrossRef CAS PubMed.
- Z. Zhang, P. Y. Du, G. Q. Pu, L. P. Wei, Y. X. Wu, J. N. Guo and X. Q. Lu, Mater. Chem. Front., 2019, 3, 2246–2257 RSC.
- W. J. Miao, Chem. Rev., 2008, 108, 2506–2553 CrossRef CAS PubMed.
- Z. C. Jin, X. R. Zhu, N. N. Wang, Y. F. Li, H. X. Ju and J. P. Lei, Angew. Chem., Int. Ed., 2020, 59, 10446–10450 CrossRef CAS PubMed.
- H. P. Peng, Z. N. Huang, Y. L. Sheng, X. P. Zhang, H. H. Deng, W. Chen and J. W. Liu, Angew. Chem., 2019, 131, 11817–11820 CrossRef.
- F. Wang, J. Lin, H. Y. Wang, S. S. Yu, X. Q. Cui, A. Ali, T. Wu and Y. Liu, Nanoscale, 2018, 10, 15932–15937 RSC.
- H. M. Wang, C. C. Wang, A. J. Wang, L. Zhang, X. L. Luo, P. X. Yuan and J. J. Feng, Sens. Actuators, B, 2019, 281, 588–594 CrossRef CAS.
- Y. Tang, J. T. Xu, C. Y. Xiong, Y. Xiao, X. H. Zhang and S. F. Wang, Analyst, 2019, 144, 2643–2648 RSC.
- L. Cui, S. L. Yu, W. Q. Gao, X. M. Zhang, S. Y. Deng and C. Y. Zhang, ACS Appl. Mater. Interfaces, 2020, 12, 7966–7973 CrossRef CAS PubMed.
- X. Y. Chen, R. J. Zheng, L. Q. Ren and J. J. Sun, RSC Adv., 2016, 6, 16495–16499 RSC.
- F. Li, Y. Q. Pang, X. Q. Lin and H. Cui, Talanta, 2003, 59, 627–636 CrossRef CAS PubMed.
- Y. Zhang, Y. Q. Chai, H. J. Wang and R. Yuan, Anal. Chem., 2019, 91, 14368–14374 CrossRef CAS PubMed.
- M. J. Jiang, S. K. Li, X. Zhong, W. B. Liang, Y. Q. Chai, Y. Zhuo and R. Yuan, Anal. Chem., 2019, 91, 3710–3716 CrossRef CAS PubMed.
- C. F. Wu, B. Bull, C. Szymanski, K. Christensen and J. McNeill, ACS Nano, 2008, 2, 2415–2423 CrossRef CAS PubMed.
- Y. Yuan, W. Y. Hou, Z. Z. Sun, J. Liu, N. Ma, X. S. Li, S. Y. Yin, W. P. Qin and C. F. Wu, Anal. Chem., 2021, 93, 7071–7078 CrossRef CAS PubMed.
- C. Wu, Y. Jin, T. Schneider, D. R. Burnham, P. B. Smith and D. T. Chiu, Angew. Chem., Int. Ed., 2010, 49, 9436–9440 CrossRef CAS PubMed.
- N. N. Wang, Z. Y. Wang, L. Z. Chen, W. W. Chen, Y. W. Quan, Y. X. Cheng and H. X. Ju, Chem. Sci., 2019, 10, 6815–6820 RSC.
- N. N. Wang, Y. Q. Feng, Y. W. Wang, H. X. Ju and F. Yan, Anal. Chem., 2018, 90, 7708–7714 CrossRef CAS PubMed.
- H. B. Chen, J. B. Yu, X. X. Men, J. C. Zhang, Z. Y. Ding, Y. F. Jiang, C. F. Wu and D. T. Chiu, Angew. Chem., Int. Ed., 2021, 60, 12007–12012 CrossRef CAS PubMed.
- Q. Q. Miao, C. Xie, X. Zhen, Y. Lyu, H. W. Duan, X. G. Liu, J. V. Jokerst and K. Y. Pu, Nat. Biotechnol., 2017, 35, 1102–1110 CrossRef CAS PubMed.
- F. Sun, Z. Y. Wang, Y. Q. Feng, Y. X. Cheng, H. X. Ju and Y. W. Quan, Biosens. Bioelectron., 2018, 100, 28–34 CrossRef CAS PubMed.
- Y. He, J. W. Du, J. H. Luo, S. H. Chen and R. Yuan, Biosens. Bioelectron., 2020, 150, 111898 CrossRef CAS PubMed.
- D. Liu, X. L. Zhang, J. W. Zhao, S. H. Chen and R. Yuan, Biosens. Bioelectron., 2020, 150, 111872 CrossRef CAS PubMed.
- X. Liu, H. Jiang, J. Lei and H. Ju, Anal. Chem., 2007, 79, 8055–8060 CrossRef CAS PubMed.
- Y. Peng, Y. P. Dong, M. M. Ai and H. C. Ding, J. Lumin., 2017, 190, 221–227 CrossRef CAS.
- L. Cui, S. L. Yu, W. Q. Gao, X. M. Zhang, S. Y. Deng and C. Y. Zhang, ACS Appl. Mater. Interfaces, 2020, 12, 7966–7973 CrossRef CAS PubMed.
Footnote |
| † Electronic supplementary information (ESI) available. See DOI: https://doi.org/10.1039/d2sd00172a |
| This journal is © The Royal Society of Chemistry 2023 |

