 Open Access Article
Real-time, smartphone-based processing of lateral flow assays for early failure detection and rapid testing workflows†
Monika
Colombo‡
 ,
Léonard
Bezinge‡
 ,
Andres
Rocha Tapia
 ,
Chih-Jen
Shih
 ,
Andrew J.
de Mello
 * and
Daniel A.
Richards
 *
*
Institute for Chemical and Bioengineering, ETH Zurich, Vladimir-Prelog-Weg 1, 8093 Zürich, Switzerland. E-mail: andrew.demello@chem.ethz.ch; daniel.richards@chem.ethz.ch
First published on 1st December 2022
Abstract
Despite their simplicity, lateral flow immunoassays (LFIAs) remain a crucial weapon in the diagnostic arsenal, particularly at the point-of-need. However, methods for analysing LFIAs still rely heavily on sub-optimal human readout and rudimentary end-point analysis. This negatively impacts both testing accuracy and testing times, ultimately lowering diagnostic throughput. Herein, we present an automated computational imaging method for processing and analysing multiple LFIAs in real-time and in parallel. This method relies on the automated detection of signal intensity at the test line, control line, and background, and employs statistical comparison of these values to predictively categorise tests as “positive”, “negative”, or “failed”. We show that such a computational methodology can be transferred to a smartphone and detail how real-time analysis of LFIAs can be leveraged to decrease the time-to-result and increase testing throughput. We compare our method to naked-eye readout and demonstrate a shorter time-to-result across a range of target antigen concentrations and fewer false negatives compared to human subjects at low antigen concentrations.
1. Introduction
Since their introduction in the late 1980s,1 paper-based lateral flow immunoassays (LFIAs) have become indispensable tools for rapid, low-cost diagnostic testing.2 LFIAs are routinely used to detect a plethora of conditions,3 though their greatest medical utility arguably lies in infectious disease diagnosis. Indeed, due in large part to the COVID-19 pandemic, LFIAs are now synonymous with rapid, point-of-need testing.4,5 The ability to rapidly and affordably test large populations is invaluable during infectious disease outbreaks and crucial to successful track-trace-treat pathways.6 Moreover, mass testing can be leveraged to develop epidemiological models,7 monitor vaccine efficacy,8 and ultimately improve our understanding of diseases. Effective mass testing is contingent upon rapid diagnostic tests that can be reliably delivered, used, and analysed in populations most affected by the target disease, i.e. where demand is highest. As exemplified by the ongoing COVID-19 pandemic, LFIAs are key to meeting this demand. By circumventing the need for centralised facilities and highly-trained personnel, LFIAs can significantly increase testing throughput. However, due to multiple limitations, these gains are yet to be fully realised.9 Naked-eye readout, whilst advantageous for accessibility and affordability, relies on human interpretation. This can lead to both false positives and false negatives as a result of misunderstandings and conscious bias.10 Misunderstandings can result from an impaired ability to correctly distinguish and observe test/control lines or an inability to detect device failure.11 Conscious bias can be introduced when certain test outcomes are more desirable and incentives for dishonesty exist, such as the ability to attend social events or travel freely.12 Improvements in telemedicine have been developed in response to these issues, although they are far from perfect.13 Thus, despite the fact that LFIAs are compatible with self-testing, the practical reality is that these assays are still predominantly performed in mass testing centres or local medical facilities. A lack of parallelisation and connectivity also limits the throughput of LFIA testing; tests are typically performed one at a time by a single user, manually interpreted, and then the results are logged on a separate system. Such a workflow slows down the testing process and introduces multiple opportunities for human error. Integrating LFIAs into highly automated and parallelised workflows, in which multiple tests can be run, analysed, and reported with minimal human intervention and interpretation, is key to overcoming these limitations.Realising this, researchers have started to develop computerised lateral flow readers. These readers come in the form of both highly integrated stand-alone devices14–17 and software Apps that rely on existing hardware within smartphones and tablets.18–20 These developments demonstrate that replacing human interpretation with automated computational analysis yields benefits in terms of accuracy and reproducibility, ultimately improving test reliability.21 However, the vast majority of these devices still read only one test at a time. Though some parallelised approaches exist,22 they rely on end-point readings and cannot detect common assay failures caused by human error or device malfunction. Clearly, there is a need for innovation in this space if LFIAs are to reach their full potential.
Herein we report a novel computational image analysis algorithm capable of processing, analysing, and interpreting multiple LFIA tests in parallel. Inspired by the work of Miller et al.,23 who employed continuous imaging to derive binding kinetics in lateral flow systems, our method uses computational image analysis to simultaneously examine the flow profile, test (T) line, and control (C) line of lateral flow assays as they are running. We demonstrate that by continuously monitoring the intensity change at the test line, the algorithm can accurately predict end-point colour density and determine assay results for multiple LFIAs in real-time. Furthermore, we show that by analysing the flow profile and control line we can detect several common early failure scenarios and ultimately determine the validity of LFIAs as they are running. The method is supported by a simple 3D-printed housing, and the custom code can be run entirely on a smartphone (Fig. 1). Using a commercial LFIA for SARS-CoV-2 nucleocapsid, we demonstrate that this approach leads to significant improvements over standard human interpretation, in terms of both time-to-result and testing throughput.
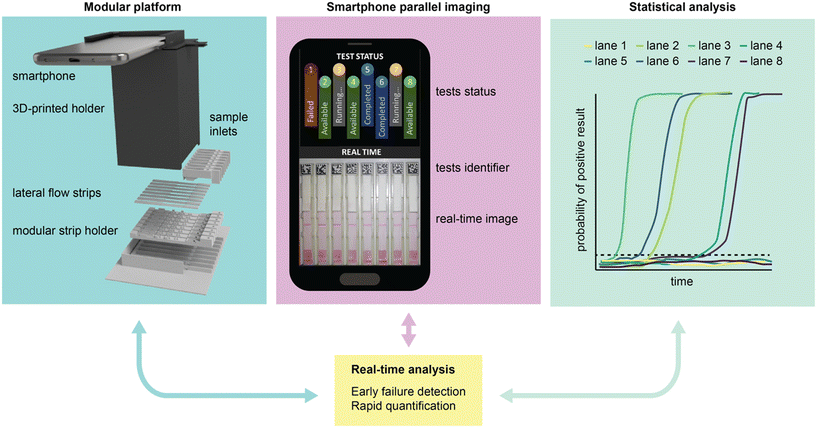 | ||
| Fig. 1 Overview of the LFIA processing platform, combining a 3D-printed modular platform, smartphone-assisted imaging, and advanced statistical analysis to monitor and read LFIA tests in real time. | ||
2. Results and discussion
The LFIA processing platform consists of a modular 3D-printed housing that can accommodate up to eight strips (Fig. 1 and S1†). Each strip is held by an individual insert (Fig. S2†), with the inserts being independently interchangeable (random access). Once inserted, the strips are imaged using a smartphone mounted atop the enclosure. The setup ensures consistent positioning of the strips and uniform lighting conditions using the integrated smartphone flashlight. The smartphone runs a bespoke App that identifies and analyses the strips in parallel. The App leverages computational methods and statistical analytics to 1) quantify and interpret the test results and 2) detect and identify technical failures at an early stage. All these processes are performed in parallel and in real time.2.1 Statistical line detection
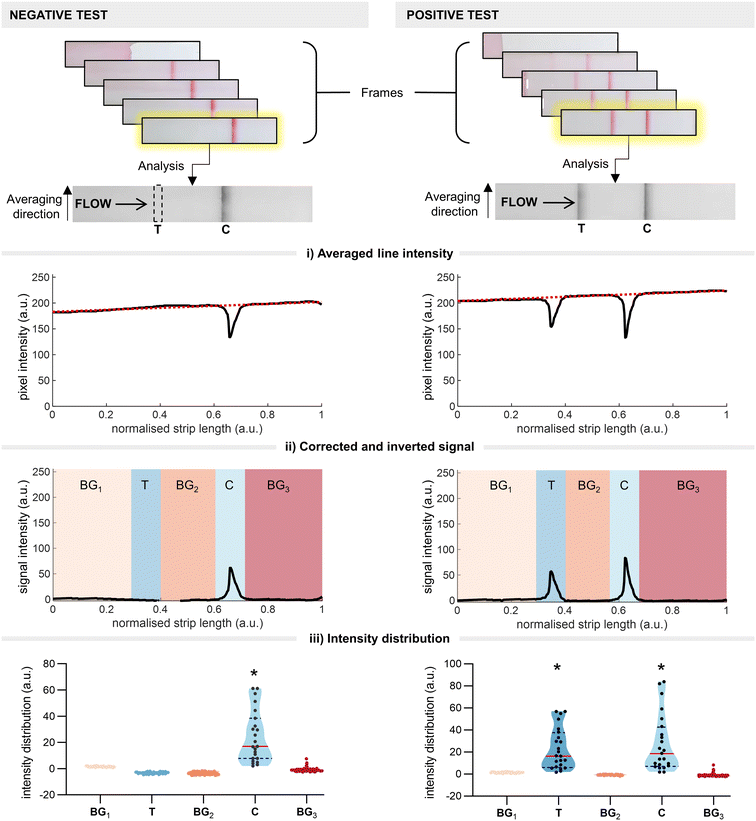
Traditional LFIA readout relies on qualitative/semi-quantitative assessment of the colour intensity at the test line (test line intensity) once the test has reached completion (the end point). This end-point intensity is highly influenced by the initial binding kinetics between the disease target (labelled with a detection probe) and the capture line. Understanding this, we theorised that we could predict the end point of a test (i.e. positive or negative) by monitoring early-stage colour changes at the test line. In doing so, we hoped to realise significant time savings over traditional end-point readouts. To this end, we developed a thresholding system in which we employ real-time imaging to determine the time point at which a signal at the test line becomes statistically significant over the background (i.e. the threshold time). Briefly, continuous images of the test strip are taken as the assay runs, with each frame being fed into a custom code. The code automatically crops the images and converts them to greyscale before identifying the regions of interest (ROIs; test line, control line, background) (Fig. 2). The code then calculates the average intensity within the ROIs and applies a baseline correction (Fig. 2i). The test line is considered present if the intensity distribution is significantly higher than the background regions (Fig. 2ii and iii). Once the presence of a test line is confirmed, the intensity distribution is then analysed for statistical significance; the signal is considered significant if the following conditions are met:1) The current intensity spatial distribution at the test line differs significantly (probability α < 0.05) from the prior intensity spatial distribution for at least 1 second;
2) The current intensity spatial distribution at the test line differs significantly (α < 0.05) from the signal acquired in the first ten seconds after the flow front passes the test region.
Once these requirements are satisfied, the test is deemed positive. If the above criteria are not met once the maximum assay time (as defined by the manufacturer) is reached, the test is deemed negative. The computational process is described in detail in the Methods section.
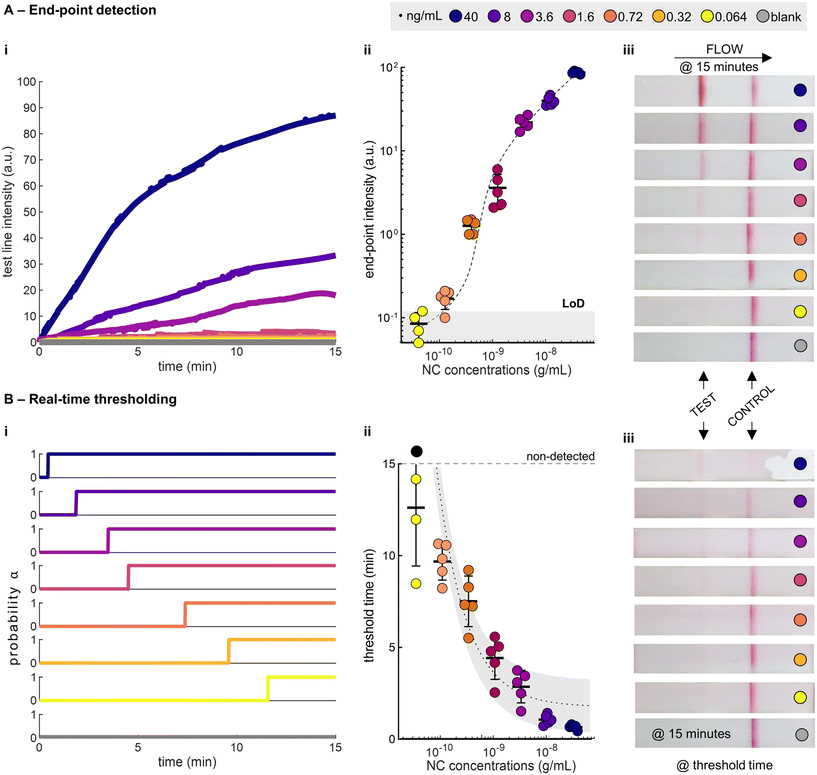
To demonstrate the potential of real-time thresholding, we compared our statistical thresholding method to traditional end-point readout (Fig. 3A and B). We ran a dilution series of SARS-CoV-2 nucleocapsid (NC), spiked into extraction buffer, on a commercial LFIA until completion (15 minutes, as defined by the manufacturer), and recorded the tests using a smartphone. We subsequently analysed the videos using a custom MATLAB script, as defined in the Methods section. The trends of the test line intensity from the recorded videos reflect the standard pseudo-first order binding kinetics (Fig. 3Ai), and the end-point test line intensities follow a Langmuir adsorption model (Fig. 3Aii, S3†). Using the intensity values at 15 minutes, we computed the limit-of-detection (LoD) as 0.12 ng mL−1 (defined from the blank mean intensity + 3 standard deviations). As anticipated, statistical detection results in threshold times that vary with NC concentration, with the highest concentrations giving statistically detectable signals at the shortest threshold times (Fig. 3Bi). The threshold times decrease with increasing NC concentrations and can be approximated using an inverse relationship (Fig. 3Bii and S4†). Visual inspection of the test strips at both the end-points and the threshold times demonstrates the differences between the two approaches (Fig. 3Aiii and Biii).
It is worth mentioning that the same definition of LoD (blank mean + 3 standard deviations) cannot be applied to the real-time thresholding approach, as blank tests do not have a defined threshold time (infinite time). Instead, the strictest definition of LoD is used, i.e. the lowest concentration that can be consistently detected (>97.5%). In this case, we report a LoD of 0.32 ng mL−1 (100% detected, n = 5). Below this concentration we observed undetected samples (75% detected, n = 4). Unsurprisingly, end-point and real-time approaches have similar LoDs. However, it is clear that the real-time thresholding method leads to considerable time savings (>50%) at higher antigen concentrations (>0.72 ng mL−1).
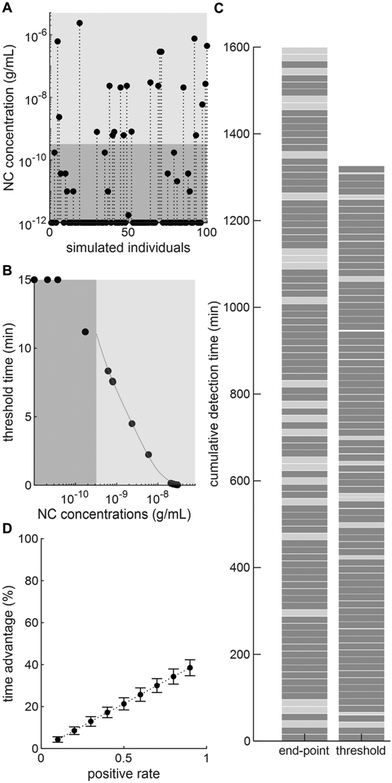
Next, we decided to further explore the potential of real-time thresholding to significantly reduce assay times. To this end, we simulated a case study in which one hundred LFIA tests are performed. To enable a fair comparison, we consider that only a single test is running at a given time (see section 2.3 for parallel processing). The positive test rate (i.e. the number of tests returning a positive result, 40%) was obtained from the Swiss Federal Office of Public Health – FOPH (Fig. S5†), whereas NC concentrations were selected from patient titres in nasopharyngeal swabs recorded by Pollock et al.24 Based on these data sets, we clustered individuals into positive detectable and negative/positive non-detectable cohorts and computed the associated threshold time by interpolation from the curve obtained from non-linear regression of our previous dilution series (Fig. 4B). As previously described, we set the lower LoD for a positive result as 0.32 ng mL−1.
Based on these data, we were able to demonstrate that for 100 tests performed under the simulated scenario (a 40% positive test rate, with titres between 0.064–40 ng mL−1), we could achieve time savings of ∼17% (17.1 ± 2.6%) (Fig. 4C). Furthermore, by varying the positive test rate parameter we observe a linear relationship between positive rate and time savings (Fig. 4D). This is expected, since in the extreme cases where all samples are negative, the test needs to run for the full 15 minutes before a negative result can be called. Accordingly, in such a scenario the thresholding method would provide no time saving. At the other extreme, where all samples are positive, we achieve much larger time gains (up to 40%). In summary, real-time thresholding has the potential to outperform end-point analysis in real-world scenarios and could provide significant time savings during infectious disease outbreaks.
2.2 Early failure detection
The ongoing COVID-19 pandemic has triggered a surge in the development and deployment of LFIA tests, with more than 1019 individual tests for SARS-CoV-2 antigen and/or antibody detection certified with the European CE-IVD Marking (as of October 2022).25 During the evaluation of these commercial LFIA tests, most publications have reported a low percentage (<2.5%) of invalid tests.26–30 However, for many LFIA tests, the rate of failed/inconclusive results can be as high as 30%.26 Evaluating failure rates is important, as failures lead to invalid or inconclusive results or false negatives/positives. This in turn leads to unnecessary treatments or otherwise irrelevant interventions that are likely to carry serious health, social and economic consequences.31,32During our study, we observed that many causes of test failure manifest as irregularities in the flow profiles of the antigen–nanoparticle immunocomplexes, differences in intensities at the test and control lines, and increased background signals. Furthermore, we realised that many of these manifestations could be detected using real-time imaging. Before investigating this, it was first necessary to identify possible causes of failures and link them to observables detectable using real-time imaging. Considering the entire life cycle of an LFIA test, we identified failures arising from issues related to manufacturing, storage or user operation (for details see the ESI†). Across these three categories, we have identified five classes of observables caused by LFIA failures: (i) disturbed flow profile, (ii) high relative background signal, (iii) lack of a control line, (iv) false negative (no test line with target present) and (v) false positive (test line visible in the absence of target) (Fig. S6†). Of these, the first three can be detected through real-time imaging, while the last two will go undetected. It is important to note that these observables are not independent, and we can expect a ‘cascade effect’ if one of them is present. For example, a sample flood will lead to a false negative, due to the decreased residence time of the immunocomplex at the test/control line. Based on the three identified detectable observables, we designed algorithms to automatically flag events indicative of test failure.
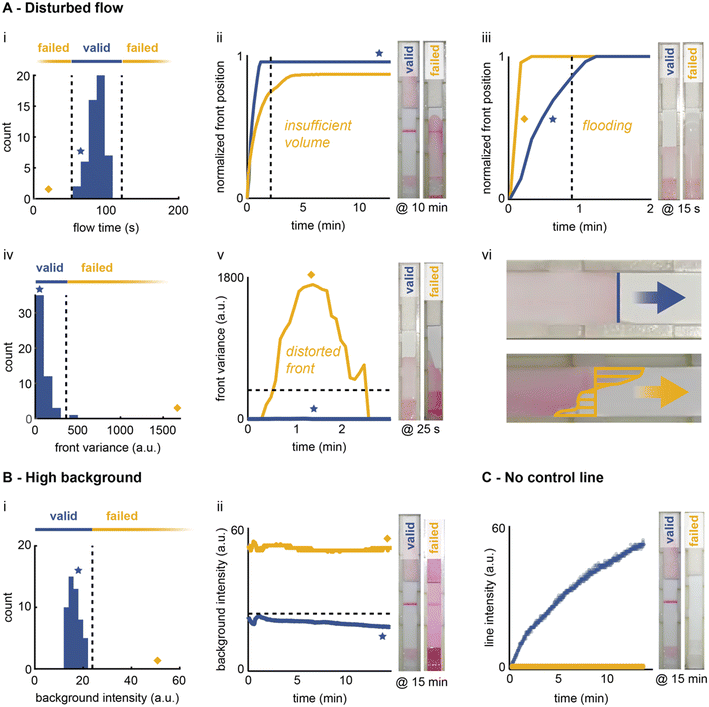 | ||
| Fig. 5 Early detection of LFIA failures through real-time image processing. The flow front (A) is monitored during the initial wetting phase. The time to reach the absorbent pad is determined and compared to a fully functional test (i). Abnormally slow (ii) or fast (iii) flow fronts are flagged by the algorithm. The shape of the front (iv) is also assessed, since a distorted front is indicative of device defects (v and vii). The colour intensity of the background (B) and the control line (C) are also checked at the end of the run to ensure that the values are within the expected range. Additional descriptions and illustrations of these failure scenarios can be found in Fig. S9.† | ||
It is important to note that all thresholds determined herein are defined for a specific LFIA device, type of sample specimen, and operational procedure. In our study, the use of an extraction buffer for nasopharyngeal swabs samples is advantageous as it provides for controlled sample properties and ensures consistent operation. It is expected that the detection of analytes in complex matrices, such as undiluted saliva or whole blood, will lead to broader variations of flow profiles and background intensities. In these assays, failures are more likely and their early detection by an automated imaging system would be highly valuable.
2.3 Smartphone-based real-time parallel platform
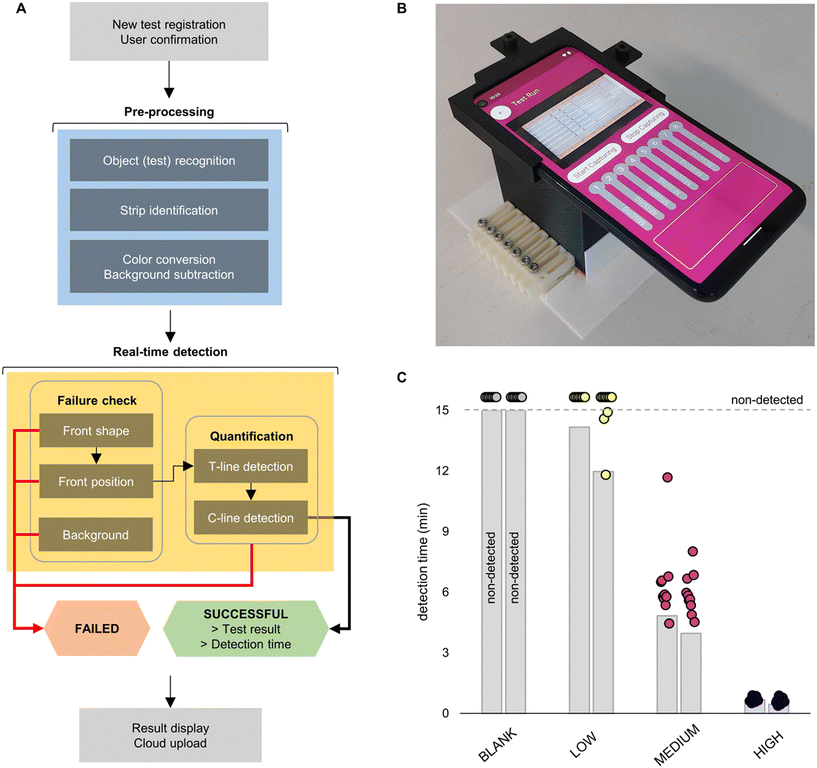
After verifying the potential benefits of early failure detection and real-time thresholding, we decided to integrate these methods directly into a smartphone App. Combined with a custom housing (Fig. S1 and S2†), this allows end-users to analyse multiple tests in parallel, all in real-time. We also coded additional features into the App, such as user registration and results display. The workflow of the App is briefly described in Fig. 6A. After registration of the user and insertion of the tests into the housing, the App pulls a frame from the video stream to perform an initial pre-processing step. The App checks for the presence of strips in each of the eight lanes using the unique QR codes located at the top of each insert. These QR codes are also used to link the tests to the unique identifiers assigned during registration. The App then uses the location of the QR codes and automated object recognition of the strip edges to delimit each individual test and create distinct regions of interest (ROIs) (Fig. S10†). The ROIs are then colour-converted into grayscale values and the background subtracted through linear approximation. The isolated, grayscale, and background subtracted test strips then enter the real-time detection phase, which combines the previously described failure analysis and statistical thresholding. For early failure detection, each strip is analysed frame-by-frame and features such as the shape and position of the liquid front and background intensity are used to determine test validity. Once the test is deemed valid, the pixel intensity at both the test line and control line is quantified for each frame. After satisfying the threshold conditions (as defined in section 2.1), a final check for signal intensity at the control line is made to rule out an invalid test. The results for that particular test are then displayed on the App (Fig. 6A and B). The entire process is random access; complete tests can be removed and replaced by a new test whilst other tests are running, and the process begins again. This prevents low-titre samples or negatives from causing a bottle-neck in the testing process and ensures maximal throughput. The entire testing process is further detailed in Fig. S11.†In addition to comparison with standard end-point signal readout, the App's functionality was evaluated against human readout. In brief, eight LFIA tests were divided into four categories: blank tests, and low (0.064 ng mL−1), medium (1.6 ng mL−1), and high (40 ng mL−1) NC concentrations. The lanes were randomly placed in the set-up and a full video of the test run was recorded. Along with the detection time measured through the App, ten human volunteers were asked to monitor the video and record the earliest time at which they could see the test line. While no difference in performance was observed for the highest concentration and blank tests, the time advantage at medium was notable (average time gain 2.2 minutes per test) (Fig. 6C). Moreover, out of the ten volunteers, the test line for low concentrations was successfully detected only in 20% of cases; the remaining tests (80%) were assigned as negative. This contrasts with the App, which assigned every test correctly. Accordingly, our detection system proved to be more effective, especially at lower antigen concentrations.
3. Conclusions
To conclude, we have presented a robust method for improving the throughput of LFIA testing by leveraging the power of parallelised real-time image analysis. This method leverages automated computational image processing to continuously monitor test line intensity, background, control line presence, and sample flow profiles. By exploiting the wealth of information gleaned from this continuous analysis, our approach significantly decreases the time-to-result and facilitates the early detection of test failures. Finally, we integrated our code into a smartphone App capable of automatically analysing up to eight tests in parallel and demonstrated significant improvements in testing performance compared to conventional human readout. This work highlights the potential of real-time imaging to augment and enhance lateral flow testing workflows and significantly improve testing throughput in point-of-need scenarios. Moving forwards, we anticipate that real-time automated imaging could be used to similarly improve the testing throughput of various colourimetric/fluorimetric biosensing diagnostic assays and become an established tool within point-of-need testing.Methods
3D-printed platform
The smartphone holder and main enclosure were printed using a fused deposition modelling (FDM) 3D printer (MK3S, Prusa Research) with a polyethylene terephthalate glycol (PETG) filament (Prusament PETG, Prusa Research) and standard printing parameters. The strip holders and inlets were printed using a stereolithography (SLA) 3D printer (SL1, Prusa Research) and ABS-like resin (PrimaCreator Tough, Prusa Research) with the recommended printing parameters. Once the strip was inserted in the strip holder, the inlet was screwed on with an M3 screw. All parts were designed in FreeCAD and the STL 3D model can be found in the Supplementary Materials.Lateral flow tests
A SARS-CoV-2 Rapid Antigen Test (Roche Diagnostics) was used as a model LFIA system. The strips were removed from the cassette and inserted in our in-house developed holders to fit in the imaging platform. The nasopharyngeal extracting buffer provided with the rapid tests was spiked with SARS-CoV-2 nucleocapsid recombinant (LA612, EastCoast Bio). A volume of 100 μL was injected into the LFIA inlet and the strips were imaged for up to 15 minutes. Failures were simulated by damaging critical points of the LFIA tests or by altering the concentration of gold nanoparticles.Computational methods
Videos (60 fps) of the LFIAs were analysed frame-by-frame, and in-house developed algorithms were used to segment and identify the ROIs. The algorithms, written in MATLAB (R2022a, Natick, MA, USA), were then converted into C++ (ISO C11+) through MATLAB Coder. The C++ code was generated for a generic device with 64-bit Embedded Processor.Smartphone App
The smartphone App was designed using the Flutter framework developed by Google (License BSD 3-Clause). This framework allows for App deployment to iOS and Android phones with a single App source code. The algorithms used for the image analysis of the LFIAs, once developed in MATLAB and converted into C++ scripts, are introduced as an in-house developed plugin. The source code of the smartphone App was written with the aid of integrated developments environments Android Studio (Google and JetBrains) and CLion (JetBrain). An Android phone (Huawei, P10 Plus, 2017) was employed to acquire the recordings and run the smartphone App.Statistical analysis
Statistical line detection is based on the differences among the intensity distributions of the test strip. In particular, a Mann Whitney U-test was employed to detect significantly different intensity values for the test- and control-line regions compared to background regions. Mean and standard deviation or median and interquartile range were used where appropriate (following the Kolmogorov–Smirnov normality test). Five repetitions were considered for each NC titre, and median values were extracted.Human readout
To compare our computational method and human naked-eye readout, we recruited ten volunteers (27.2 ± 3.6 years old) to participate in a controlled study. The device and smartphone were set up to run eight tests in parallel, in a randomised order from left to right, and the results were stored anonymously. The feed from the smartphone was recorded for later playback to the human participants. Each participant was then placed individually and separately in front of a monitor and instructed to record the first time instant when they could detect the test line for each test. The lighting conditions and distance from the monitor were consistent for each test. Five individuals (50%) wore corrective glasses/contact lenses, and no statistical difference in the performance of the two groups was found. Participants were screened for colour blindness and no cases were reported.Acronyms & Abbreviations
| NC | Nucleocapsid |
| C | Control |
| T | Test |
| LFIA | Lateral flow immunoassay |
| ROI | Region of interest |
| LoD | Limit-of-detection |
Author contributions
M. C. designed and coded the computational image analysis algorithms, performed the comparison with human subjects, and performed statistical analysis; L. B. designed and manufactured the custom housing and inserts, ran the LFIAs, and determined the causes of LFIA failure; A. R. T. designed and coded the App; D. A. R. conceived and managed the project; M. C., L. B., and D. A. R. wrote the first draft of the manuscript; C. J. S. provided supervision and resources. A. J. D. M. provided supervision, resources, and edited the final draft of the manuscript.Conflicts of interest
There are no conflicts to declare.Acknowledgements
D. A. R. acknowledges funding from the European Union's Horizon 2020 research and innovation programme under the Marie Skłodowska-Curie grant agreement 840232. M. C. acknowledges funding from Fondation Botnar (Basel, Switzerland), through the project titled “Development and Validation of a Lateral Flow Test to Detect COVID-19 Immunity in Saliva (DAVINCI)”.References
- D. E. Charlton, Church and Dwight Co Inc, United States, US6485982B1, 2002.
- E. B. Bahadır and M. K. Sezgintürk, TrAC, Trends Anal. Chem., 2016, 82, 286–306 CrossRef.
- S. Rosen, in Lateral Flow Immunoassay, ed. R. Wong and H. Tse, Humana Press, Totowa, NJ, 2009, pp. 1–15 Search PubMed.
- H. R. Boehringer and B. J. O'Farrell, Clin. Chem., 2022, 68, 52–58 CrossRef.
- Y. Zhang, Y. Chai, Z. Hu, Z. Xu, M. Li, X. Chen, C. Yang and J. Liu, Front. bioeng. biotechnol., 2022, 10 DOI:10.3389/fbioe.2022.866368.
- A. Suea-Ngam, L. Bezinge, B. Mateescu, P. D. Howes, A. J. de Mello and D. A. Richards, ACS Sens., 2020, 5, 2701–2723 CrossRef CAS.
- A scoping review of point-of-care testing devices for infectious disease surveillance, prevention and control, https://www.ecdc.europa.eu/en/publications-data/scoping-review-point-care-testing-devices-infectious-disease-surveillance, (accessed 12 October 2022).
- K. Lukaszuk, J. Kiewisz, K. Rozanska, M. Dabrowska, A. Podolak, G. Jakiel, I. Woclawek-Potocka, A. Lukaszuk and L. Rabalski, Vaccines, 2021, 9, 840 CrossRef CAS.
- N. K. Khosla, J. M. Lesinski, M. Colombo, L. Bezinge, A. J. deMello and D. A. Richards, Lab Chip, 2022, 22, 3340–3360 RSC.
- J. J. Deeks, A. Singanayagam, H. Houston, A. J. Sitch, S. Hakki, J. Dunning and A. Lalvani, BMJ, 2022, 376, e066871 CrossRef.
- D. S. Mouliou and K. I. Gourgoulianis, Expert Rev. Respir. Med., 2021, 15, 993–1002 CrossRef CAS PubMed.
- ECDC Technical Report, Considerations on the use of self-tests for COVID-19 in the EU/EEA, 17th March 2021.
- C. S. Wood, M. R. Thomas, J. Budd, T. P. Mashamba-Thompson, K. Herbst, D. Pillay, R. W. Peeling, A. M. Johnson, R. A. McKendry and M. M. Stevens, Nature, 2019, 566, 467–474 CrossRef CAS PubMed.
- L. P. Bheemavarapu, M. I. Shah, J. Joseph and M. Sivaprakasam, Biosensors, 2021, 11, 211 CrossRef CAS PubMed.
- A. E. Urusov, A. V. Zherdev and B. B. Dzantiev, Biosensors, 2019, 9, 89 CrossRef CAS PubMed.
- Lateral Flow Reader| From home to lab use, https://www.lateralflowreader.com/, (accessed 12 October 2022).
- operon, OPERON Lateral Flow Reader, https://operondx.com/operon-lateral-flow-reader/, (accessed 12 October 2022).
- V. Turbé, C. Herbst, T. Mngomezulu, S. Meshkinfamfard, N. Dlamini, T. Mhlongo, T. Smit, V. Cherepanova, K. Shimada, J. Budd, N. Arsenov, S. Gray, D. Pillay, K. Herbst, M. Shahmanesh and R. A. McKendry, Nat. Med., 2021, 27, 1165–1170 CrossRef PubMed.
- Y. Jung, Y. Heo, J. J. Lee, A. Deering and E. Bae, J. Microbiol. Methods, 2020, 168, 105800 CrossRef CAS PubMed.
- V. Turbé, E. R. Gray, V. E. Lawson, E. Nastouli, J. C. Brookes, R. A. Weiss, D. Pillay, V. C. Emery, C. T. Verrips, H. Yatsuda, D. Athey and R. A. McKendry, Sci. Rep., 2017, 7, 11971 CrossRef PubMed.
- N. C. K. Wong, S. Meshkinfamfard, V. Turbé, M. Whitaker, M. Moshe, A. Bardanzellu, T. Dai, E. Pignatelli, W. Barclay, A. Darzi, P. Elliott, H. Ward, R. J. Tanaka, G. S. Cooke, R. A. McKendry, C. J. Atchison and A. A. Bharath, Community Med., 2022, 2, 1–10 CrossRef PubMed.
- Lateral Flow Fluorescence Measurement|ESEQuant LR3, https://www.lateralflowreader.com/esequant-lr3/, (accessed 12 October 2022).
- B. S. Miller, C. Parolo, V. Turbé, C. E. Keane, E. R. Gray and R. A. McKendry, Chem. – Eur. J., 2018, 24, 9783–9787 CrossRef CAS PubMed.
- N. R. Pollock, T. J. Savage, H. Wardell, R. A. Lee, A. Mathew, M. Stengelin and G. B. Sigal, J. Clin. Microbiol., 2021, 59, e03077-20 CrossRef PubMed.
- Home| COVID-19 In Vitro Diagnostic Devices and Test Methods Database, https://covid-19-diagnostics.jrc.ec.europa.eu/, (accessed 12 October 2022).
- M. C. Tollånes, A.-M. B. Kran, E. Abildsnes, P. A. Jenum, A. C. Breivik and S. Sandberg, Clin. Chem. Lab. Med., 2020, 58, 1595–1600 CrossRef.
- J. Dinnes, J. J. Deeks, A. Adriano, S. Berhane, C. Davenport, S. Dittrich, D. Emperador, Y. Takwoingi, J. Cunningham, S. Beese, J. Dretzke, L. F. di Ruffano, I. M. Harris, M. J. Price, S. Taylor-Phillips, L. Hooft, M. M. Leeflang, R. Spijker, A. V. den Bruel and C. C.-19 D. T. A. Group, The Cochrane Database of Systematic Reviews, 2020 Search PubMed.
- G. C. Mak, P. K. Cheng, S. S. Lau, K. K. Wong, C. Lau, E. T. Lam, R. C. Chan and D. N. Tsang, J. Clin. Virol., 2020, 129, 104500 CrossRef CAS.
- N. Kohmer, S. Westhaus, C. Rühl, S. Ciesek and H. F. Rabenau, J. Clin. Virol., 2020, 129, 104480 CrossRef CAS PubMed.
- V. M. Corman, V. C. Haage, T. Bleicker, M. L. Schmidt, B. Mühlemann, M. Zuchowski, W. K. Jo, P. Tscheak, E. Möncke-Buchner, M. A. Müller, A. Krumbholz, J. F. Drexler and C. Drosten, Lancet Microbe, 2021, 2, e311–e319 CrossRef CAS PubMed.
- S. N. Ladhani, J. Y. Chow, S. Atkin, K. E. Brown, M. E. Ramsay, P. Randell, F. Sanderson, C. Junghans, K. Sendall, R. Downes, D. Sharp, N. Graham, D. Wingfield, R. Howard, R. McLaren and N. Lang, J. Infect., 2021, 82, 282–327 CrossRef CAS PubMed.
- Y. Shimazu, Y. Kobashi, T. Zhao, Y. Nishikawa, T. Sawano, A. Ozaki, D. Obara and M. Tsubokura, Clin. Case Rep., 2021, 9, e04122 Search PubMed.
Footnotes |
| † Electronic supplementary information (ESI) available. See DOI: https://doi.org/10.1039/d2sd00197g |
| ‡ Both authors contributed equally. |
| This journal is © The Royal Society of Chemistry 2023 |

