 Open Access Article
Synthesis of molybdenum nanoclusters from Vitex negundo leaves for sensing epinephrine in a pharmaceutical composition†
Harshita
a,
Sanjay
Jha
b,
Tae-Jung
Park
 c and
Suresh Kumar
Kailasa
 *a
*a
aDepartment of Chemistry, Sardar Vallabhbhai National Institute of Technology, Surat-395007, India. E-mail: sureshkumarchem@gmail.com; skk@chem.svnit.ac.in
bASPEE Shakilam Biotechnology Institute, Navsari Agricultural University, Surat 39500, Gujarat, India
cDepartment of Chemistry, Research Institute of Chem-Bio Diagnostic Technology, Chung-Ang University, 84 Heukseok-ro, Dongjak-gu, Seoul 06974, Republic of Korea
First published on 29th May 2023
Abstract
The fabrication of metal nanoclusters (NCs) obtained from medicinal plant extracts for the detection of biomolecules has attracted a lot of interest recently. In this work, green chemistry is used to synthesize cyan fluorescent molybdenum nanoclusters (MoNCs) for the selective detection of epinephrine. The MoNCs were synthesized by using MoCl5 as a metal precursor and Vitex negundo (V. negundo) plant extract as a capping agent. With the addition of epinephrine, the intensity of the emission peak of V. negundo-MoNCs at 495 nm was drastically quenched (68%) on the basis of the inner filter effect (IFE) between V. negundo-MoNCs and epinephrine demonstrating that V. negundo-MoNCs can be used as sensing probe for the epinephrine detection. Further, the effect of pH on the fluorescence response of V. negundo-MoNCs was investigated for sensing epinephrine. Moreover, the V. negundo-MoNCs fluorescent probe exhibited a good linear range of (0.25–10 μM) for epinephrine with a detection limit of 0.46 μM. The MTT assay was used to investigate the cytotoxicity of V. negundo-MoNCs on the A549 lung cancer cell line, demonstrating the biocompatibility of MoNCs. This approach was further successfully employed for quantifying epinephrine in pharmaceutical samples.
1. Introduction
Neurotransmitters, also known as the chemical messengers of the body, are the chemical molecules, which are responsible for transmitting messages as signals through neurons to the target cell.1 The adrenal gland secretes epinephrine, a crucial catecholamine neurotransmitter in the nervous system.2 By speeding up the heart rate, it can increase the chance that cardiac arrest patients will survive.3 In response to a violent event, intense emotions like fear, rage, or any other form of excitement trigger the secretion of epinephrine into the blood, which raises the heart rate, sugar metabolism, blood pressure, and muscle contractions. The body prepares for vigorous activity as a result of this reaction, known as the “flight or fight reaction”.4 Early-stage diagnosis is crucial since the usual level of epinephrine in the human body is 764.3 pM, and abnormalities in this level can cause detrimental disorders such Parkinson's disease, multiple sclerosis, hypertension and Alzheimer's disease.5Nanomaterials, for example, carbon nanomaterials, metal nanoparticles, metal oxide nanomaterials, polymers, biomaterials and nanohybrids,6,7 have gained prominence as effective investigative probes due to their outstanding physicochemical properties, high surface-to-volume ratios, high adsorption, and reactive capacities. It is challenging to achieve these characteristics while utilising conventional material.8 Various kinds of nanomaterials (0D–3D) have been utilized to enhance the sensor selectivity, sensitivity and limit of detection amongst various metrics. With the incorporation of these nanostructures into electrochemical,9,10 optical spectroscopy, high-performance liquid chromatography (HPLC) and gas/liquid chromatography-mass spectrometry (GC-MS) techniques, the analytical features of these techniques are greatly improved.11 For instance, in a report rGO nanosheets were decorated with Pd NPs by utilizing microwave-assisted in situ reduction and exfoliation methods in order to examine their hydrogen detection ability under various conditions. The detection capability further was evaluated at different hydrogen concentrations (up to 1%), temperatures, and relative humidities (up to ∼44%).12 An organoclay/polypyrrole-alginate (OC/Ppy-A) nanocomposite-modified glassy carbon sensor (MGCS) was developed for sensitive detection of greenhouse gas (CO2) in seawater and brackish samples and examined using electrochemical impedance spectroscopy and cyclic voltammetry (CV).13 Compared to the bare glassy carbon sensor (GCS), the fabricated MGCS demonstrated a superior five-fold CV signal for detection of CO2. Various techniques for the quantification of epinephrine using nanomaterials have been described in the literature such as electrochemistry,14,15 colorimetric,16 chemiluminescence,17 surface-enhanced Raman spectroscopy,18 HPLC,19 and capillary electrophoresis.20 However, the majority of these techniques are not capable of quick on-site detection, mainly in remote areas, because of their laborious operation and high cost. In this aspect, a fluorescence technique for detection is very appealing as it is simple and requires a low cost of operation. A fluorescent biosensor is advantageous because of its characteristics such as selectivity, simplicity, sensitivity, minimal cost instrument, fastness and visual identification.21–23 Furthermore, the use of nanomaterials as probes has significantly improved the effectiveness of numerous analytical approaches for the identification of epinephrine in several clinical biological fluids. For example, an ordered mesoporous carbon/nickel oxide nanocomposite was used as a substrate for the sensing of epinephrine with a limit of detection (LOD) of 8.5 × 10⁻⁸ M.14 Further, 3D-laccase–Cu3(PO4)2·3H2O microflowers were fabricated for the colorimetric detection of epinephrine.24 Similarly, a molecularly imprinted polymer was decorated on the surface of an MXene/carbon nanohorn for the voltammetric determination of epinephrine.25 Although the above analytical techniques exhibited good selectivity and impressive sensitivity, they required tedious synthetic routes and specific ligands. Hence, one of the most important ways to counteract the negative effects of producing nanomaterials chemically is through green synthesis.26 As a result, biosynthesis of nanomaterials using plants emerged as a secure, affordable, and more environmentally friendly substitute.27 The majority of the workers are interested in using plant extracts to synthesize nanomaterials because they contain a variety of phytoactive compounds that serve as stabilizing and reducing agents simultaneously, resulting in a simpler, quicker, and more affordable method.26 Fluorescent metal NCs have developed into promising fluorescent nanostructures due to their distinct physicochemical and optical properties, flexibility of surface modification, nontoxicity, size-dependent luminescence abilities, excellent photostability, and water dispersity.28,29 Because of their distinctive optical, electrical, and physical attributes, metal NCs have been successfully used for sensing, bioimaging, and catalysis applications.30 They have also been successfully used to detect a wide range of analytes, including biomarkers, drugs, biomolecules, and nucleic acids.31–34 Nowadays, MoNCs which are not been explored much yet have become a fascinating topic in nanoscience and analytical chemistry research.35,36 For example, 6-aza-2-thiothymine (ATT) capped MoNCs have been fabricated to recognize cancer drug methotrexate with a LOD of 1.28 nM.37 Similarly, another MoNCs using thiolated dithiothreitol (DTT) as capping agents were fabricated and used as bioimaging probes for imaging HaCaT, A549, and RPTEC cells owing to their smaller size and high biocompatibility.38
As far as we know, there are not many studies in the literature that utilize plant extracts for the green synthesis of fluorescent molybdenum NCs. The novelty of the method is the nontoxic approach for plant-based synthesis of MoNCs. The production proved to be easy and eco-friendly with natural reagents and less harsh chemicals as compared to chemically synthesized MoNCs. In addition, the presence of an array of phytochemicals in the V. negundo plant extract acts as natural reducing and stabilizing agents for MoNCs production. Therefore, we report herein the green synthesis of cyan colored fluorescent MoNCs as sensing probe for the detection of epinephrine by using V. negundo plant extract as a stabilizing agent. The as-fabricated V. negundo-MoNCs displayed a quantum yield (QY) of 24.04%. The synthesized V. negundo-MoNCs have good stability and specific selectivity towards the neurotransmitter biomarker epinephrine (Scheme 1). The as-synthesized V. negundo-MoNCs have the potential to sense epinephrine in its pharmaceutical samples, revealing the practical utility of probe in pharmaceutical industries.
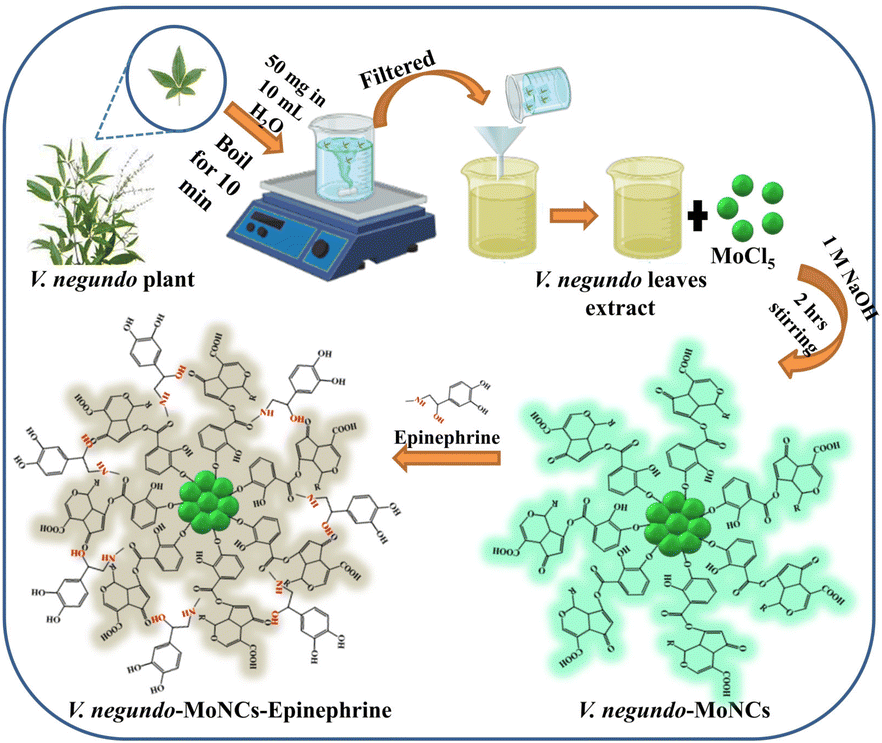 | ||
| Scheme 1 Schematic illustration of phytochemical extraction from V. negundo leaves for the synthesis of cyan colored fluorescent V. negundo-MoNCs for sensing epinephrine. | ||
2. Experimental
2.1. Chemicals and materials
Epinephrine used in this work was obtained from Sigma Aldrich. Vitex negundo leaves were bought from Navsari Agriculture University, Surat, Gujarat, India. MoCl5 was purchased from TCI Chemicals. The other biomarkers were bought from Sigma Aldrich, USA. The water utilized for the entire research was purified using a Milli-Q water purifying system. The solvents and chemicals utilized throughout the full analysis were of analytical standard.2.2. Instrumentation
A Cary Eclipse fluorescence spectrometer from Agilent Technologies and a Maya Pro 2000 spectrophotometer (Ocean Optics, USA) were used to accomplish fluorescence and absorption spectral investigations. An alpha II Fourier-transform infrared (FT-IR) spectrometer from Bruker, Germany was employed to measure the FT-IR spectra. The morphology of V. negundo-MoNCs was revealed through high-resolution transmission electron microscopy (HR-TEM) (JEM 2100, JEOL Japan).2.3. Extraction of phytochemicals from the V. negundo leaf extract
The green leaves of V. negundo were taken, cleaned, washed with tap water, and afterwards rinsed using deionized water to extract the phytochemicals. Further, crushing of the leaves was done followed by drying for 24 h. Later, 50 mg of green leaves were taken in 10 mL of distilled water which was then heated to boil for 10 till the solution was reduced to half of 10 mL. The leaf extract was obtained by filtering the supernatant through Whatman paper and was then kept at 4 °C for later use. The obtained extract served as a stabilizing and reducing agent for the synthesis of MoNCs.2.4. Preparation of V. negundo-MoNCs
The biosynthesis of cyan colored fluorescent MoNCs (V. negundo-MoNCs) was accomplished using MoCl5 as a precursor and V. negundo extract as a ligand. Briefly, 3 mL of the leaf extract was added into 7 mL (10 mM) of MoCl5 and stirred for 2 min. The solution pH was adjusted using 1.0 mL of NaOH (1 M), and the resulting orange colored mixture solution was stirred for 2 h at room temperature to obtain a pale yellowish solution which confirms the formation of V. negundo-MoNCs. The final green-synthesized MoNCs were refrigerated at 4 °C until further usage. The as synthesized V. negundo-MoNCs displayed cyan colored fluorescence at 365 nm in UV light, which further verified the synthesis of V. negundo-MoNCs.2.5. Fluorescence detection of epinephrine using V. negundo-MoNCs as probe
In a typical experiment for epinephrine detection, 1000 μL of V. negundo-MoNCs solution was added separately containing 500 μL of various biomarkers, namely myoglobin, normetanephrine, uric acid, cortisone, cortisol, dipicolinic acid, sodium selenite, methyl selenocysteine, and epinephrine, and the solution was vortexed for 60 s and left to stand for about 5 min. Furthermore, the fluorescence spectra of the above solutions were taken at 430 nm, and the change in their emission intensity was observed. An incredible change was obtained with 68% quenching in the fluorescence intensity of V. negundo-MoNCs for biomarker epinephrine. This illustrates that synthesized V. negundo-MoNCs behave as a sensor for the detection of epinephrine.3. Results and discussion
3.1. Characterization and synthesis of V. negundo-MoNCs
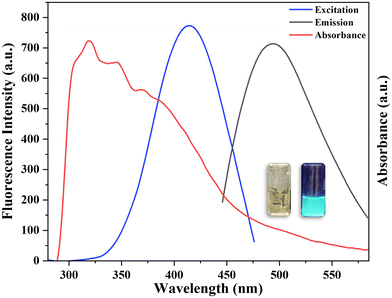
The V. negundo extract contains a variety of phytochemical constituents including resveratrol, phenol, taraxerol, tannin, vitamin, carotene, flavonoids, phytosterols, keto-steroids and indanes, providing good architecture for the fabrication of metal NCs. These characteristics make the V. negundo a suitable ligand for encapsulating MoNCs. The cyan colored fluorescent MoNCs were generated in a single step reaction using a solution containing the V. negundo extract and MoCl5 as precursors in the presence of NaOH solution. A range of concentrations (1, 5, 10 and 20 mM) of MoCl5 were investigated so as to identify the optimal concentration of MoCl5 for the fabrication of cyan color MoNCs from the V. negundo leaf extract. It was observed that the emission spectra at 495 nm were obtained with good intensity only after using 10 mM of MoCl5, suggesting the development of fluorescent MoNCs (Fig. S1a†). In a similar way, separate volumes from 1 mL to 5 mL of the V. negundo leaf extract have been explored for the synthesis of fluorescent MoNCs with an active phytochemical architecture. It was observed that using 3 mL of V. negundo solution and 7 mL of 10 mM MoCl5 resulted in generating a good emission spectrum of V. negundo-MoNCs (Fig. S1b†). Moreover, the time of reaction is a crucial factor in the development of NCs. To determine the optimal time of reaction, the emission spectrum of V. negundo-MoNCs was studied at various time intervals, and the optimum results were obtained from a reaction time of 150 min (Fig. S2†); after 150 min the fluorescence intensity of the V. negundo-MoNCs starts decreasing, indicating that 150 min is the optimal time for the generation of V. negundo-MoNCs. These results indicate that 7 mL of 10 mM MoCl5, 3 mL of the V. negundo extract, 1 mL of 1 M NaOH and 150 min as the time of reaction are the best parameters for the formation of V. negundo-MoNCs.The synthesized V. negundo-MoNCs were analyzed by fluorescence and UV-visible spectroscopy. The formed V. negundo-MoNCs have a pale yellow color solution in daylight and emit cyan color fluorescence when exposed to UV light at 365 nm. The absorbance peak maximum was observed at 319 nm. The V. negundo-MoNCs exhibited an emission peak maximum at 495 nm after exciting at 430 nm (Fig. 1). In order to determine the maximum emission intensity of V. negundo-MoNCs, the synthesized MoNCs were excited at various excitation wavelengths ranging from 370 nm to 450 nm, and the maximum emission intensity of V. negundo-MoNCs was observed at 495 nm upon exciting at 430 nm (Fig. S3†). The as-fabricated V. negundo-MoNCs are confirmed by the fluorescence and absorption spectrum spectral characteristics of MoCl5, V. negundo, and V. negundo-MoNCs, which are displayed in Fig. S4.† These results demonstrate that the spectral features of V. negundo-MoNCs differ significantly in comparison to their spectral characteristics of precursors. The emission spectra of V. negundo-MoNCs at various time intervals were studied to determine the stability of V. negundo-MoNCs (Fig. S5†). These data demonstrated that V. negundo-MoNCs are stable for up to 120 days, which suggests that V. negundo effectively protected MoNCs, increasing the stability of MoNCs. The QY of V. negundo-MoNCs was determined to be 24.04% by taking quinine sulphate as a standard.
FT-IR analysis of the V. negundo extract and V. negundo-MoNCs was carried out to identify the surface functional groups of V. negundo-MoNCs (Fig. S6†). The peak at 3445 cm−1 represents the OH stretching of V. negundo; however, the OH stretching peak intensity increases in V. negundo-MoNCs. The peaks around 2925 and 2857 cm−1 indicate the C–H stretching in V. negundo and V. negundo-MoNCs. There is a significant increase in the peak intensities of V. negundo-MoNCs at 1632, 1453 and 1383 cm−1, illustrating the carbonyl (–C![[double bond, length as m-dash]](https://www.rsc.org/images/entities/char_e001.gif) O) stretching, –CH stretching and OH bending. The FT-IR spectrum of V. negundo-MoNCs exhibits the sharp peaks at 1117 and 839 cm−1 corresponding to the –C–O stretching and C
O) stretching, –CH stretching and OH bending. The FT-IR spectrum of V. negundo-MoNCs exhibits the sharp peaks at 1117 and 839 cm−1 corresponding to the –C–O stretching and C![[double bond, length as m-dash]](https://www.rsc.org/images/entities/char_e001.gif) C bending, whereas these peaks for V. negundo are not observed, confirming the binding and interaction of phytochemicals of V. negundo on the surface of the MoNCs.
C bending, whereas these peaks for V. negundo are not observed, confirming the binding and interaction of phytochemicals of V. negundo on the surface of the MoNCs.
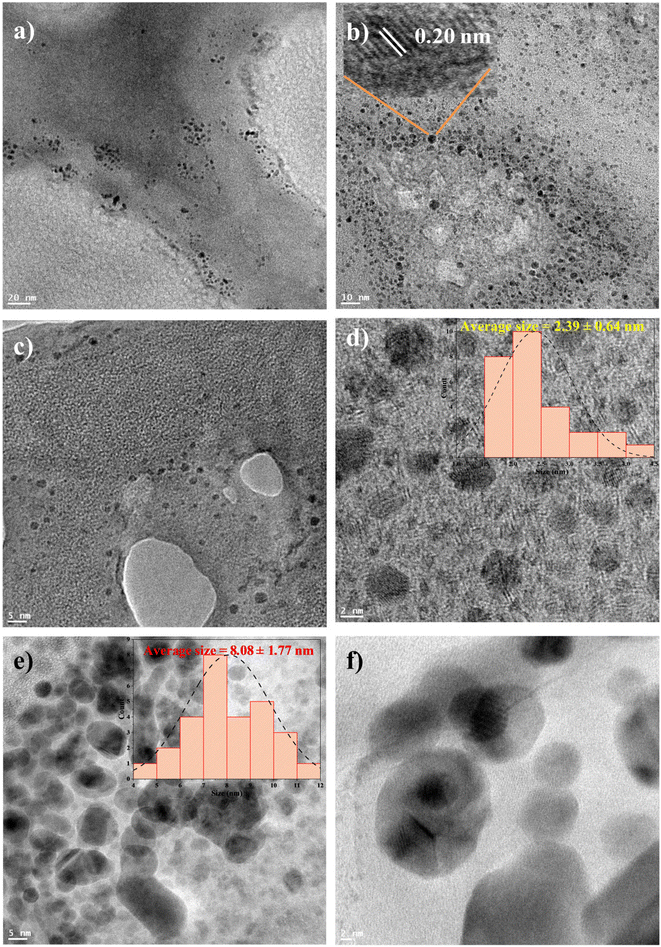
The size and morphology of V. negundo-MoNCs were investigated by an HR-TEM technique. The HR-TEM images of the V. negundo-MoNCs are shown in Fig. 2a–d, revealing a clear depiction of the fabrication of small spherical shaped V. negundo-MoNCs with uniform size distribution of 2.39 ± 0.64 nm (Fig. 2d). The time of decay for V. negundo-MoNCs was examined by the fluorescence lifetime study and observed that V. negundo-MoNCs displayed a lifetime of 3.02 ns (Fig. S7†). The X-ray diffraction (XRD) data reveal the formation of the crystalline structure of V. negundo-MoNCs (Fig. S8†). The sharp diffraction peaks (2θ) at 19.98°, 24.48°, 27.24°, 31.46°, 32.14°, 39.74°, and 49.40° representing the lattice planes (200), (110), (021), (130), (111), (060) and (002) confirm the crystalline structure of V. negundo-MoNCs.39–42
The elemental composition and oxidation states of V. negundo-MoNCs were explored by X-ray photoelectron spectroscopy (XPS). The presence of Mo, C, N, S and O in the obtained V. negundo-MoNCs was verified by the survey spectra of XPS (Fig. S9a†). Using the suitable fitting results, Fig. S9b† displays the Mo 3d core level XPS spectra. The Mo 3d spectrum deconvoluted into two peaks at 231.9 eV and 234.9 eV signifies the oxidation state of Mo3+ and Mo5+ 3d3/2 in the V. negundo-MoNCs.43,44 The results indicates the presence of distinctive peaks for Mo3+ and Mo5+ in V. negundo-MoNCs with the dominance peak for Mo is the 3+ oxidation state, confirming the formation of V. negundo-MoNCs.
3.2. Recognition ability of V. negundo-MoNCs towards epinephrine
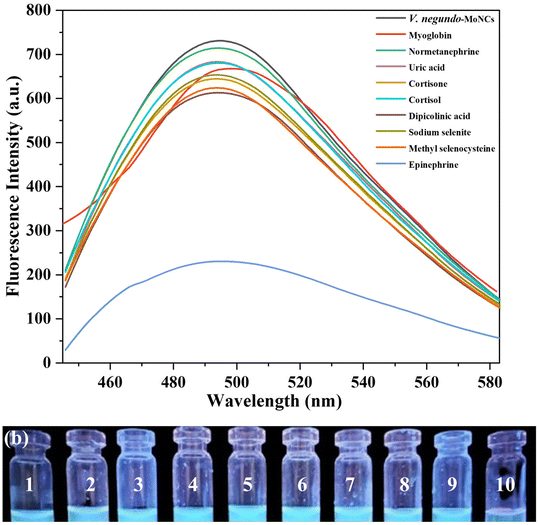
The molecular recognition ability of V. negundo-MoNCs was determined by the fluorescence spectra at 495 nm after adding a series of biomarkers (myoglobin, normetanephrine, uric acid, cortisone, cortisol, dipicolinic acid, sodium selenite, methyl selenocysteine, and epinephrine, 500 μM). Fig. 3a shows that the fluorescence intensity of V. negundo-MoNCs was quenched by 68% after the addition of epinephrine, whereas other biomarkers had no noticeable impact on the emission spectrum of V. negundo-MoNCs. This indicates that V. negundo-MoNCs exhibit high selectivity for epinephrine. Moreover, the cyan fluorescence of V. negundo-MoNCs was quenched after adding epinephrine, which was visible to the naked eye as shown in Fig. 3b. These results confirmed that V. negundo-MoNCs serve as a biosensor for the recognition of epinephrine by a “fluorescence turn-off” mechanism.3.3. pH study
To determine the impact of pH on the fluorescence response of V. negundo-MoNCs, the emission spectrum of the as-synthesized V. negundo-MoNCs with or without epinephrine was examined at a broad range of phosphate-buffered saline (PBS) pH values ranging from 2.0 to 12.0. As shown in Fig. S10a,† there is a decrement in the fluorescence intensity at pH 2 or 3 and a further rise in pH from 4 to 12 leads to an increase in intensity of the emission spectra, indicating the pH dependent response of V. negundo-MoNCs. Under highly acidic environment, the surface active carboxylic acid group of V. negundo-MoNCs is bonded to H+ ions, resulting in the generation of [V. negundo-MoNCs–H]+. It induces MoNCs to aggregate, which reduces the intensity of the fluorescence. In contrast, in an alkaline environment, the COOH group on the surface of V. negundo-MoNCs deprotonate into carboxylate, thereby increasing the fluorescence intensity. Similarly, when epinephrine was introduced into V. negundo-MoNCs at PBS pH ranging from 2.0 to 12.0 (Fig. S10b†), the V. negundo-MoNC emission spectra intensity was quenched in every pH. However, at pH 2 or 3 a further decrement in the fluorescence intensity was due to the aggregation of NCs as explained above. Thus, V. negundo-MoNCs function as a fluorescent sensor for quantifying epinephrine without optimization of buffer pH.3.4. Sensitivity of V. negundo-MoNCs towards epinephrine
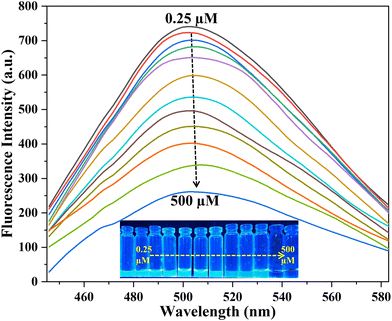
The sensitivity study of V. negundo-MoNCs after adding aliquots of epinephrine (0.25–500 μM) was performed as shown in Fig. 4. It was noticed that the emission spectra at 495 nm displayed a significant decline in intensity with an increasing concentration of epinephrine (0.25–500 μM). This demonstrates that V. negundo-MoNCs fluorescence response, which can be seen in Fig. S11,† is highly sensitive to epinephrine at 495 nm and is in linear relationship with the epinephrine concentration in the range of (0.25–10 μM). Using this, a linear equation and coefficient of correlation R2 (y = 0.035x + 1.049, R2 = 0.993 for epinephrine) were obtained between the fluorescence intensity ratio and concentration of epinephrine (Fig. S11†) for the detection of epinephrine (the ratio I0/I; here I0 refers to the intensity of V. negundo-MoNCs without epinephrine and I represents the intensity of V. negundo-MoNCs with epinephrine). The LOD is 0.46 μM, obtained by using the 3σ rule, wherein σ refers to the standard deviation for blank V. negundo-MoNCs. Comparison of the current method with the previously reported techniques for epinephrine detection is shown in Table 1, revealing that V. negundo-MoNCs acted as a promising fluorescent probe for the detection of epinephrine.| Method | Material | Linear range (μM) | LOD (μM) | Ref. |
|---|---|---|---|---|
| Fluorescent sensor | MoS2 quantum dots | 0.2–40 | 0.05 | 45 |
| Chemically modulated fluorescent sensor | — | 0.05–10 | 0.5 | 46 |
| Colorimetric sensor | Laccase-mineral hybrid microflowers | 1–400 | 0.6 | 47 |
| Electrochemical sensor | Multi-walled carbon nanotube modified glassy carbon electrode | 50–1150 | 7.20 | 48 |
| Electrochemical sensor | o-Phenylenediamine–epinephrine-molecularly imprinted polymer | 0–100 | Less than 13 | 49 |
| Electrochemical sensor | Nickel oxide-reduced graphene oxide | 50–1000 | 10 | 50 |
| Electrochemical sensor | Carbon quantum dots/copper oxide nanocomposite | 10–100 | 15.99 | 51 |
| Fluorescent sensor | V. negundo-MoNCs | 0.25–10 | 0.46 | Present method |
3.5. Sensing mechanism
To examine the mechanism for sensing of epinephrine using V. negundo-MoNCs as a fluorescent sensor, the fluorescence and UV-visible spectrum, HR-TEM, dynamic light scattering (DLS), fluorescence lifetime and zeta potential of V. negundo-MoNCs were investigated with or without epinephrine. The reason for the fluorescence quenching of V. negundo-MoNCs after addition of epinephrine might represent the IFE which takes place between the donor (V. negundo-MoNCs) and acceptor (epinephrine). The excitation spectra of V. negundo-MoNCs overlap with the epinephrine absorbance spectrum (Fig. S12a†), suggesting the quenching in the emission intensity of V. negundo-MoNCs by epinephrine via the IFE. The UV-visible spectra of V. negundo-MoNCs–epinephrine as shown in (Fig. S12b†) shifted to a longer wavelength with a sharp peak at 343 nm as compared to V. negundo-MoNCs, indicating the interaction of epinephrine with V. negundo-MoNCs. The HR-TEM image confirmed the aggregation of the V. negundo-MoNCs after adding epinephrine. It was found that the average size of the V. negundo-MoNCs increases to 8.08 ± 1.77 nm as depicted in the HR-TEM image (Fig. 2e and f). This is also confirmed by the DLS data since aggregation causes the hydrodynamic diameter of the V. negundo-MoNCs to rise from 4.86 ± 1.44 nm to 18.12 ± 8.16 nm on addition of epinephrine (Fig. S13†). The zeta potential of epinephrine observed was −1.3 mV (Fig. S14a†), and the zeta potential of V. negundo-MoNCs significantly decreased from −16.9 mV to −8.9 mV (Fig. S14b and c†) after adding epinephrine, demonstrating the electrostatic interaction between V. negundo-MoNCs and epinephrine. The decline in the average lifetime of V. negundo-MoNCs from 3.02 ns to 1.65 ns in V. negundo-MoNCs–epinephrine suggests the identification of epinephrine by dynamic quenching (Fig. S7†).The FT-IR spectrum of V. negundo-MoNCs and V. negundo-MoNCs after the addition of epinephrine were examined to ascertain the interaction of epinephrine with the V. negundo-MoNCs (Fig. S15†). The FT-IR results demonstrated the increase in the distinctive peaks of –OH, –C–H, C![[double bond, length as m-dash]](https://www.rsc.org/images/entities/char_e001.gif) O and C
O and C![[double bond, length as m-dash]](https://www.rsc.org/images/entities/char_e001.gif) C bending in V. negundo-MoNCs by the introduction of epinephrine; however a significant increment in peak intensity at 1381 cm−1 representing –C–N stretching was observed in V. negundo-MoNCs–epinephrine leading to significant interaction between epinephrine and V. negundo-MoNCs. The sharp –C–O stretching peak at 1117 cm−1 was diminished in the FT-IR spectra of V. negundo-MoNCs–epinephrine, resulting in a broad peak, indicating the formation of V. negundo-MoNC–epinephrine complex.
C bending in V. negundo-MoNCs by the introduction of epinephrine; however a significant increment in peak intensity at 1381 cm−1 representing –C–N stretching was observed in V. negundo-MoNCs–epinephrine leading to significant interaction between epinephrine and V. negundo-MoNCs. The sharp –C–O stretching peak at 1117 cm−1 was diminished in the FT-IR spectra of V. negundo-MoNCs–epinephrine, resulting in a broad peak, indicating the formation of V. negundo-MoNC–epinephrine complex.
3.6. Selectivity of V. negundo-MoNCs towards epinephrine
The selective nature of V. negundo-MoNCs towards epinephrine was investigated with some interferents like cations (Na+, Cd2+, Cu2+, Zn2+, Fe3+, Co2+, and Cr6+, 500 μM), anions (Br−, Cl−, I−, SO42−, and PO43−, 500 μM) and biomarkers (dopamine, phenylalanine, tyrosine, and normetanephrine, 500 μM). As depicted in Fig. S16,† the fluorescence intensity of V. negundo-MoNCs remain unaffected after introducing the above-mentioned interfering agents. Furthermore, the emission intensity of V. negundo-MoNCs was markedly reduced only after the introduction of epinephrine to the interferents, demonstrating the selective detection ability of V. negundo-MoNCs toward epinephrine.3.7. Assessment of cytotoxicity of V. negundo-MoNCs
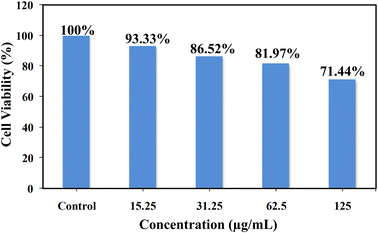
The cytotoxic effect of V. negundo-MoNCs was evaluated on the A549 lung carcinoma cell line using the methyl thiazolyl tetrazolium (MTT) method (Fig. 5). A549 lung cancer cells were incubated with various concentrations of V. negundo-MoNCs (15.25–125 μg mL−1). The viabilities of cell are 93.33%, 86.52%, 81.97%, and 71.44% by using 15.25, 31.25, 62.5, and 125 μg mL−1V. negundo-MoNCs, demonstrating the biocompatibility and nontoxicity of V. negundo-MoNCs and their potential utility as a biosensor for the visualization of different cells.3.8. Analysis of epinephrine in its pharmaceutical composition
The proposed method was evaluated by quantifying epinephrine in a pharmaceutical composition. For this, adrenaline injection of Rathi Laboratories (Hindustan) Pvt. Ltd. containing 1 mg of epinephrine was procured from a local medical store in Surat, India. As epinephrine was present in the adrenaline injection at a concentration of 1 mg mL−1, different concentrations of 100, 250 and 500 μM of epinephrine were made, and by employing V. negundo-MoNCs based sensor, epinephrine was quantified. As provided in Table S1 of the ESI,† epinephrine recovery values were in between 98.54 to 99.41% with a relative standard deviation (RSD) of <2%, displaying the probe usability and viability for epinephrine quantification in pharmaceutical samples.4. Conclusions
A novel and simple method is developed for the synthesis of MoNCs by using V. negundo leaf extract as a stabilizing and reducing agent. The as-synthesized V. negundo capped MoNCs exhibits cyan color fluorescence under UV light with a QY of 24.04%. The V. negundo-MoNCs emission intensity was drastically quenched on adding epinephrine, offering the possibility to detect the analyte by a “turn-off” mechanism. The technique provides a rapid response, inexpensive miniaturized analytical strategy for the specific quantification of epinephrine. The method enables a sensitive fluorescence determination of epinephrine with a LOD of 0.46 μM. The biosensor was satisfactorily used to detect epinephrine in a pharmaceutical composition. Hence, the as-fabricated V. negundo-MoNCs can be used as a miniaturized sustainable analytical tool for the identification of epinephrine in real samples.Conflicts of interest
There are no conflicts to declare.Acknowledgements
Authors greatly acknowledge the Department of Science and Technology (DST), Government of India (EMR/2016/002621/IPC) for providing a research grant for this work.References
- M. M. Charithra, J. G. Manjunatha, A. A. Al-Kahtani, A. M. Tighezza and N. Ataollahi, Top. Catal., 2022, 1–11 Search PubMed
.
- C. Wang, Q. Han, P. Liu, G. Zhang, L. Song, X. Zou and Y. Fu, ACS Sens., 2021, 6, 252–258 CrossRef CAS PubMed
.
- Q. Huang, Y. Liu, C. Zhang, Z. Zhang, F. Liu and J. Peng, ACS Omega, 2020, 5, 8423–8431 CrossRef CAS PubMed
.
- B. Soleymani, B. Zargar and S. Rastegarzadeh, J. Iran. Chem. Soc., 2020, 17, 1013–1025 CrossRef CAS
.
- T. M. Thenrajan, S. Ramasamy, P. K. Chidambaram and J. Wilson, Mater. Chem. Phys., 2022, 276, 125366 CrossRef CAS
.
-
T. Kant, N. S. Dahariya, V. K. Jain, B. Ambade and K. Shrivas, Silver Nanomaterials for Agri-Food Applications, Elsevier, 2021, pp. 429–452 Search PubMed
.
- R. Kumar, W. Dias, R. J. Rubira, A. V. Alaferdov, A. R. Vaz, R. K. Singh, S. R. Teixeira, C. J. Constantino and S. A. Moshkalev, IEEE Trans. Electron Devices, 2018, 65, 3943–3949 CAS
.
- A. Thakur and A. Kumar, Sci. Total Environ., 2022, 834, 155219 CrossRef CAS PubMed
.
- D. S. Rana, S. Kalia, R. Kumar, N. Thakur, R. K. Singh and D. Singh, Environ. Nanotechnol., Monit. Manage., 2022, 18, 100724 CAS
.
- D. S. Rana, S. Kalia, R. Kumar, N. Thakur, D. Singh and R. K. Singh, Mater. Chem. Phys., 2022, 287, 126283 CrossRef CAS
.
- E. C. Welch, J. M. Powell, T. B. Clevinger, A. E. Fairman and A. Shukla, Adv. Funct. Mater., 2021, 31, 2104126 CrossRef CAS
.
- H. Hashtroudi, R. Kumar, R. Savu, S. Moshkalev, G. Kawamura, A. Matsuda and M. Shafiei, Int. J. Hydrogen Energy, 2021, 46, 7653–7665 CrossRef CAS
.
- M. Elfiky, R. Kumar and A. Beltagi, J. Electroanal. Chem., 2022, 926, 116926 CrossRef CAS
.
- X. Yang, P. Zhao, Z. Xie, M. Ni, C. Wang, P. Yang, Y. Xie and J. Fei, Talanta, 2021, 233, 122545 CrossRef CAS PubMed
.
- S. Kalia, D. S. Rana, N. Thakur, D. Singh, R. Kumar and R. K. Singh, Mater. Chem. Phys., 2022, 287, 126274 CrossRef CAS
.
- M. Ying, G. Yang, Y. Xu, H. Ye, X. Lin, Y. Lu, H. Pan, Y. Bai and M. Du, Analyst, 2022, 147, 40–47 RSC
.
- M. Amjadi, T. Hallaj, J. L. Manzoori and T. Shahbazsaghir, Spectrochim. Acta, Part A, 2018, 201, 223–228 CrossRef CAS PubMed
.
- B. Zhou, X. Li, X. Tang, P. Li, L. Yang and J. Liu, ACS Appl. Mater. Interfaces, 2017, 9, 7772–7779 CrossRef CAS PubMed
.
- D. Wu, H. Xie, H. Lu, W. Li and Q. Zhang, Biomed. Chromatogr., 2016, 30, 1458–1466 CrossRef CAS PubMed
.
- A. Roychoudhury, K. A. Francis, J. Patel, S. K. Jha and S. Basu, RSC Adv., 2020, 10, 25487–25495 RSC
.
- H. Singh, A. Bamrah, S. K. Bhardwaj, A. Deep, M. Khatri, K. H. Kim and N. Bhardwaj, J. Hazard. Mater., 2021, 407, 124379 CrossRef CAS PubMed
.
- S. K. Pradhan, B. Ambade and P. K. Tarafder, Appl. Radiat. Isot., 2020, 160, 109126 CrossRef CAS PubMed
.
- S. K. Pradhan and B. Ambade, Radiochim. Acta, 2021, 109, 195–203 CrossRef CAS
.
- M. Zhang, Y. Zhang, C. Yang, C. Ma, Y. Zhang and J. Tang, Microchem. J., 2022, 172, 106911 CrossRef CAS
.
- S. Chen, M. Shi, J. Yang, Y. Yu, Q. Xu, J. Xu, X. Duan, Y. Gao and L. Lu, Microchim. Acta, 2021, 188, 1–11 CrossRef PubMed
.
- A. M. Abdelfatah, M. Fawzy, A. S. Eltaweil and M. E. El-Khouly, ACS Omega, 2021, 6, 25397–25411 CrossRef CAS PubMed
.
- M. Hosny, A. S. Eltaweil, M. Mostafa, Y. A. El-Badry, E. E. Hussein, A. M. Omer and M. Fawzy, ACS Omega, 2022, 7, 3121–3133 CrossRef CAS PubMed
.
- B. Wang, M. Zhao, M. Mehdi, G. Wang, P. Gao and K. Q. Zhang, Mater. Chem. Front., 2019, 3, 1722–1735 RSC
.
- J. Yang, Y. Peng, S. Li, J. Mu, Z. Huang, J. Ma, Z. Shi and Q. Jia, Coord. Chem. Rev., 2022, 456, 214391 CrossRef CAS
.
- L. Farzin, M. Shamsipur, L. Samandari, S. Sadjadi and S. Sheibani, Talanta, 2020, 214, 120886 CrossRef CAS PubMed
.
- B. Li, P. Zhang, B. Zhou, S. Xie, A. Xia, T. Suo, S. Feng and X. Zhang, Anal. Chim. Acta, 2021, 1148, 238194 CrossRef CAS PubMed
.
- Y. C. Chen, S. W. Hong, H. H. Wu, Y. L. Wang and Y. F. Chen, Nanomaterials, 2021, 11, 1789 CrossRef CAS PubMed
.
- S. Borse, Z. V. P. Murthy, T. J. Park and S. K. Kailasa, ACS Appl. Nano Mater., 2021, 4, 11949–11959 CrossRef CAS
.
- X. Lin, L. Zou, W. Lan, C. Liang, Y. Yin, J. Liang, Y. Zhou and J. Wang, Dalton Trans., 2022, 51, 27–39 RSC
.
- M. R. Kateshiya, D. J. Joshi, M. A. Kumar, N. I. Malek and S. K. Kailasa, J. Mol. Liq., 2022, 365, 120139 CrossRef CAS
.
- Y. Xu, R. Wang, J. Wang, J. Li, T. Jiao and Z. Liu, J. Chem. Eng., 2021, 417, 129233 CrossRef CAS
.
- S. Borse, Z. V. P. Murthy and S. K. Kailasa, J. Photochem. Photobiol., A, 2023, 435, 114323 CrossRef CAS
.
- A. K. Sharma, S. Pandey, N. Sharma and H. F. Wu, Mater. Sci. Eng., C, 2019, 99, 1–11 CrossRef CAS PubMed
.
- S. K. Sen, S. Dutta, M. R. Khan, M. S. Manir, S. Dutta, A. Al Mortuza, S. Razia and M. A. Hakim, Bionanoscience, 2019, 9, 873–882 CrossRef
.
- R. K. K. Reddy, S. Kailasa, B. G. Rani, N. Jayarambabu, H. Yasuhiko, G. V. Ramana and K. V. Rao, SN Appl. Sci., 2019, 1, 1–9 Search PubMed
.
- S. Rajagopal, D. Nataraj, O. Y. Khyzhun, Y. Djaoued, J. Robichaud, K. Senthil and D. Mangalaraj, CrystEngComm, 2011, 13, 2358–2368 RSC
.
- N. R. Dighore, P. L. Anandgaonker, S. T. Gaikwad and A. S. Rajbhoj, Mater. Sci.-Pol., 2015, 33, 163–168 CrossRef CAS
.
- Y. Zhao, K. Kamiya, K. Hashimoto and S. Nakanishi, J. Am. Chem. Soc., 2015, 137, 110–113 CrossRef CAS PubMed
.
- S. J. Xiao, X. J. Zhao, J. Zuo, H. Q. Huang and L. Zhang, Anal. Chim. Acta, 2016, 906, 148–155 CrossRef CAS PubMed
.
- F. Zhang, M. Wang, D. Zeng, H. Zhang, Y. Li and X. Su, Anal. Chim. Acta, 2019, 1089, 123–130 CrossRef CAS PubMed
.
- Y. Zhang, W. Ren, Y. Z. Fan, H. Q. Luo and N. B. Li, Sens. Actuators, B, 2020, 305, 127463 CrossRef CAS
.
- M. Zhang, Y. Zhang, C. Yang, C. Ma and J. Tang, Talanta, 2021, 224, 121840 CrossRef CAS PubMed
.
- L. V. da Silva, N. D. dos Santos, A. K. A. de Almeida, D. D. E. R. dos Santos, A. C. F. Santos, M. C. França, D. J. P. Lima, P. R. Lima and M. O. F. Goulart, J. Electroanal. Chem., 2021, 881, 114919 CrossRef CAS
.
- B. Si and E. Song, Microelectron. Eng., 2018, 187, 58–65 CrossRef
.
- A. G. Ramu, A. Umar, A. A. Ibrahim, H. Algadi, Y. S. A. Ibrahim, Y. Wang, M. M. Hanafiah, P. Shanmugam and D. Choi, Environ. Res., 2021, 200, 111366 CrossRef CAS PubMed
.
- S. E. Elugoke, O. E. Fayemi, A. S. Adekunle, P. S. Ganesh, S. Y. Kim and E. E. Ebenso, J. Electroanal. Chem., 2023, 929, 117120 CrossRef CAS
.
Footnote |
| † Electronic supplementary information (ESI) available. See DOI: https://doi.org/10.1039/d3sd00063j |
| This journal is © The Royal Society of Chemistry 2023 |

