 Open Access Article
Rapid and simultaneous detection of SARS-CoV-2 and influenza A using vertical flow assay based on AAO and SERS nanotags†
Yu
Lu
abc,
Ruihua
Fei
abc,
Jiahe
Zhang
abc,
Geng
Zhu
abc,
Xiufang
Mo
abc,
Yu
Wan
ad,
Yan
Huang
abc,
Qingjiang
Sun
 a,
Dianhuai
Meng
 *e and
Xiangwei
Zhao
 *abc
*abc
aState Key Laboratory of Digital Medical Engineering, School of Biological Science and Medical Engineering, Southeast University, Nanjing 210096, China. E-mail: xwzhao@seu.edu.cn
bInstitute of Biomaterials and Medical Devices, Southeast University, Suzhou 215163, China
cSoutheast University Shenzhen Research Institute, Shenzhen 518000, China
dJiangsu Simcere Pharmaceutical Co., Ltd, Nanjing 210042, China
eRehabilitation Medical Center, The First Affiliated Hospital of Nanjing Medical University, Nanjing, 210029, China. E-mail: dhdream@126.com
First published on 18th August 2023
Abstract
The clinical symptoms of coronavirus disease 2019 (COVID-19), caused by severe acute respiratory syndrome coronavirus 2 (SARS-CoV-2), are similar to those of influenza A infection. Therefore, accurate diagnosis of SARS-CoV-2 and influenza A in the early infection stage is essential for appropriate clinical treatment. In this work, a vertical flow assay (VFA) device based on Au@Ag@Au core–shell SERS nanotags and anodic aluminum oxide (AAO) was proposed to diagnose and distinguish between SARS-CoV-2 and influenza A at the same time. Antibodies paired with SARS-CoV-2 and influenza A were immobilized simultaneously on the AAO. In the presence of SARS-CoV-2 or influenza A antigens, sandwich immune-complexes were formed on the AAO and the corresponding SERS signals of nanotags could be detected. The whole detection process took only about 15 minutes, taking comparable or even shorter time than reported POCT antigen assays. The detection limit reached 0.47 pg ml−1 for SARS-CoV-2 nucleocapsid protein (NP) and 0.62 pg ml−1 for influenza A antigen. The clinical feasibility of the proposed VFA device was validated by testing clinical throat swab samples (3 SARS-CoV-2 positive samples and 17 negative samples). Real sample analysis indicated a well-distinguished positive/negative sample group. Conceptually, this VFA device is a potential POCT diagnosis tool for determining if a suspected patient is infected with SARS-CoV-2 or influenza A.
Introduction
Since the first case of COVID-19 infection was reported, this novel coronavirus has caused a worldwide pandemic, with huge implications for global public health.1,2 Evidence has shown that the transmission route of novel coronavirus can be aerial droplets, contact and fomites, and it has strong human-to-human and environment-to-human transmission ability.3–5 According to previous reports, SARS-CoV-2 spreads in a similar mode to influenza A, showing similar symptoms such as fever, cough, fatigue and muscular pain.6,7 Therefore, it is difficult to distinguish between these two respiratory viruses by symptoms alone. During seasonal epidemics, which are caused by influenza A viruses,8 the co-pandemics of these two respiratory infectious diseases may complicate clinical management and greatly burden health systems.9,10 In addition, the SARS-CoV-2 virus, just like the influenza A virus, has high probability to become an epidemic and coexist in humans for a long time.11 Therefore, a sensitive and accessible point-of-care test (POCT) method is significant for the timely diagnosis of SARS-CoV-2 and influenza A infection cases.Although self-testing is less sensitive than real-time polymerase chain reaction (RT-PCR),12 it is still considered to be the most effective method of testing for pandemic control since it can be performed frequently and provide results quickly. Undoubtedly, immunological assays of virus antigens with a simple workflow are more suitable for the self-testing and screening of SARS-CoV-2 and influenza A infections, especially when the virus antibodies appear after a period of infection.
Up to now, the simultaneous immunoassay of SARS-CoV-2 and influenza A infections has been widely performed on lateral flow immunoassay (LFA) strips for POCT applications.13–16 Vertical flow assay (VFA), known as immunofiltration, also plays a key role in POCT. The main advantages of LFA and VFA include ease of use, robustness, cost-effectiveness and fast-response time.17 However, the liquid in LFA is driven by capillarity. Therefore, liquid velocities at different positions of nitrocellulose (NC) vary. Speeds that are too fast lead to low immunobinding efficiency, while speeds that are too slow result in a high background signal. Although some LFAs with several test lines have been developed for multiplex detection, most LFAs only have one test line with a fixed position. Remarkably, VFA with separated immunoreaction spots on a single membrane can detect multi-targets simultaneously without intervention, showing better multiplexing capability over LFA.18 Moreover, the false-negative generating hook effect is prevented in VFA19 and VFA requires a short assay time due to rapid sample processing. However, the sensitivity of VFA is relatively low because of a fast liquid flow speed and short reaction length. Clinically, the lower the limit of detection (LOD), the easier the patient can be identified. In consequence, a series of strategies have been integrated with VFA for sensitivity improvement.20–22 Among these technologies, surface enhanced Raman scattering (SERS) has impressive advantages for VFA, including distinctive fingerprint signals, excellent multiplexing, and ultra-sensitivity.23 Recently, SERS nanotags have been introduced into immunoassay for improving the LOD, enriching the quantitative ability and multiplex detection.24–28 In addition, immunoassays based on SERS nanotags enable dual mode detection. The results can be observed by the naked eye and quantified based on SERS intensity enabling rapid and ultrasensitive detection.29–32 Encapsulating Raman dyes in the gap of core–shell SERS nanotags provides high SERS enhancement and signal stability.33–35 Among typical SERS substances, Au nanoparticles (NPs) possess excellent stability and biocompatibility, but their SERS activity is typically lower than that of Ag NPs.36,37 In contrast, Ag NPs have outstanding SERS activity but suffer from low stability. An effective solution is synthesizing Au@Ag@Au core–shell NPs, endowing SERS nanotags with gold's stable surface chemistry and silver's excellent SERS activity. In addition, VFA sensitivity can also be improved by using substitutes for NC, which is a commonly used sensing membrane in VFA. Anodic aluminum oxide (AAO) is a kind of nanomaterial with a regular pore structure. Compared with NC, the nanoconfined space of AAO increases the probability of antibody–antigen interaction and further improves the sensitivity of VFA. Moreover, the uniform nanochannel of AAO can improve the repeatability of VFA results.
In this work, a VFA platform based on Au@Ag@Au core–shell SERS nanotags and AAO was adopted for the quantitative detection of SARS-CoV-2 and influenza A. The developed strategy allows simultaneous detection for the nucleocapsid protein of SARS-CoV-2 and influenza A antigens. In the presence of SARS-CoV-2 or influenza A, immunocomplexes form on the test spots and SERS signals of nanotags can be detected for quantitative analysis of the targets. The LODs of the proposed approach for SARS-CoV-2 and influenza A detection are 0.47 pg ml−1 and 0.62 pg ml−1, respectively. The practical diagnostic potential of the proposed strategy was verified by testing 20 clinical throat swab samples. This SERS-based VFA could be an efficient diagnosis tool to identify SARS-CoV-2 or influenza A infection and take appropriate protective measures.
Experimental
Materials and methods
Silver nitrate (AgNO3), tetrachloroaurate(III) trihydrate and bovine serum albumin (BSA) were obtained from Sigma (St Louis, MO, USA). 4-Mercaptobenzonitrile (MB) and Nile blue A (NBA) were purchased from Alfa Aesar. Sodium hydroxide (NaOH), trisodium citrate, (3-aminopropyl)trimethoxysilane (APTMS), hexadecyltrimethylammonium chloride (CTAC), glutaraldehyde and ethanol were received from the Chinese medicine group. Mannitol, ascorbic acid (AA), sodium sulfite (Na2SO3) and polyvinyl pyrrolidone (PVP) were obtained from Aladdin Co. Ltd (Shanghai, China). PBS (10 mM, pH = 7.4) and Tris-HCl (1 M, pH = 9.0) were purchased from Sangon Biotech. AAO templates (DP450-350S-50000) with a diameter of 13 mm were purchased from Topology Technology Co. Ltd. (Shenzhen, China). The water used throughout the experiments was deionized water.The SARS-CoV-2 NP and a pair of monoclonal anti-SARS-CoV-2 NP antibodies (mAb) were purchased from Nanjing Biogot Technology, Co., Ltd (China). FITC-AFP (alpha-fetoprotein) monoclonal antibody, influenza A antigen, influenza A monoclonal capture mAb and detection mAb were purchased from Beijing Key-Bio Biotech Co., Ltd (China). Colloidal gold test strips for SARS-CoV-2 and influenza A were purchased from Baotai Bio-tech Co. Ltd. and Zhongshan Bio-tech Co. Ltd, respectively.
The zeta (ζ) potentials of nanoparticles were measured using a Malvern Zetasizer Nano ZS90 instrument (Malvern Instruments, UK). Transmission electron microscopy (TEM; FEI, Talos F200X) was used for SERS nanotag characterization. The nanostructure of the AAO membrane was characterized by scanning electron microscopy (SEM; Zeiss, Ultra Plus). The absorption spectra of the Au@Ag@Au core–shell NPs were measured using a Hitachi 5000 UV/vis/NIR spectrophotometer. Commercial FDTD software (Lumerical, Canada) was used to simulate the electromagnetic field distribution of the Au@Ag@Au NPs. The Raman spectra and SERS mapping images of the test zone on the AAO membrane were captured by an InVia Renishaw Raman microscope system (Renishaw, UK). The wavelength of the laser was 785 nm for excitation and the power was 3 mW at the sample position. The scattered light was collected by a 20× objective lens (numerical aperture NA = 0.4) to the CCD detector. All SERS spectra were collected with 10 s accumulation. Mapping images were obtained in a random 100 × 100 μm2 area with a step size of 5 μm covering 441 spots. Baseline correction and fluorescence band removal were performed in the WIRE 4.2 software (Renishaw, UK). Fluorescence images of the AAO membrane were captured using an inverted microscope (Olympus, Japan). Commercial LFA strips were photographed using a smartphone (iPhone 13, Apple) and analysed using the ImageJ software.
Synthesis of the Au@Ag@Au core–shell SERS nanotags
Gold nanoparticles with a diameter of 15 nm were prepared via the citrate reduction of tetrachloroaurate(III) trihydrate38 and Au NPs were used as the core of subsequent SERS nanotags. For the synthesis of the Au@Ag NPs, 33.96 mL of H2O, 4 mL of 100 mM CTAC, 2 mL of Au NPs of 15 nm and 0.04 mL of 100 mM NaOH were mixed and heated at 65 °C. Under magnetic stirring, 20 mL of 1 mM AgNO3 and a 20 mL mixture of 2 mM AA, 2 mM NaOH and 20 mM CTAC were injected into the beaker by syringe pumps. The resultant mixture was centrifuged at 6000 rpm for 20 min and the precipitates were resuspended in 20 mL of 10 mM CTAC solution. Before the synthesis of the outer gold shell, a stable AuI solution was prepared in advance. 8.775 ml of H2O, 0.1 mL of 25 mM HAuCl4·3H2O, 0.125 mL of 100 mM NaOH and 1 mL of 10 mM Na2SO3 were added into a glass bottle. The prepared AuI solution was colorless and stored at 4 °C for further use. For the simultaneous detection, NBA (0.8 mL 0.5 mM) and MB (0.8 mL 1 mM) were added into a mixture of 1 mL of 100 mM CTAC, 5.2 mL H2O and 1 mL Au@Ag NPs, respectively. After adsorption for 2 h, centrifugation (6000 rpm, 10 min) was conducted to remove excess Raman dye. Then, 1 mL of 20 mM NaOH and 1 mL of 10 mM Na2SO3 were added into the Raman dyes-modified Au@Ag NPs (Au@AgNBA and Au@AgMB). Subsequently, 4 mL of AuI solution and 4 mL of a mixture of 20 mM CTAC, 10 mM NaOH and 10 mM AA were injected into Au@AgNBA and Au@AgMB under magnetic stirring. After centrifugation at 5000 rpm for 10 min and removal of the supernatant, Au@AgNBA@Au and Au@AgMB@Au SERS nanotags were obtained and stored at 4 °C for further use.Preparation of the bio-functioned core–shell SERS nanotags
450 μL of 50 mM Tris-HCl buffer was mixed with 100 μL of Au@AgNBA@Au and Au@AgMB@Au solutions, respectively. SARS-CoV-2-NP-Ab and influenza A-Ab (1 mg ml−1, 6 μL) were added into the above solutions, respectively, and incubated at 37 °C for 1 h. Next, 50 μL of 20% w/v BSA was added and incubated at 37 °C for 1 h to block the nonspecific binding sites of the antibody-conjugated SERS nanotags. Finally, the mixture was centrifuged at 3000 rpm for 15 min. Precipitations containing SARS-CoV-2-NP-Ab conjugated Au@AgNBA@Au and influenza A-Ab conjugated Au@AgMB@Au were resuspended in 100 μL of 50 mM Tris-HCl buffer containing 1% w/v BSA, 1% w/v PVP and 1% w/v mannitol and stored at 4 °C for further use.Modification of the AAO membrane
The modification of AAO was performed as follows: first, the AAO was treated with oxygen plasma for 3 min to improve its hydrophilicity. Then, the AAO was immersed in APTMS solution (5% v/v in ethanol) at room temperature for 8 h. Subsequently, the AAO was washed with ethanol and deionized water several times to remove residual APTMS and baked at 120 °C for 30 min. Afterwards, the AAO was soaked in glutaraldehyde (5% v/v in PBS) for 2 h at room temperature to obtain formyl-group functionalized AAO. Unreacted glutaraldehyde was removed using deionized water and the AAO was blown dry. Afterwards, 20 μL of 0.1 mg ml−1 SARS-CoV-2-NP-Ab and influenza A-Ab were dropped onto the functionalized AAO at 4 °C for 12 h. After thorough washing with PBS, the AAO was incubated with 5% BSA at 37 °C for 1 h to block non-specific binding sites. Finally, the functionalized AAO was washed with PBS buffer and stored at 4 °C for further use.Single antigen assay for SARS-CoV-2 NP and influenza A antigen
For the single antigen assay, SARS-CoV-2-NP-Ab and influenza A-Ab (1 mg ml−1) were immobilized on two separate test spots on AAO. Different concentrations of SARS-CoV-2 NP or influenza A antigen were dropped onto single antibody-modified test spots and incubated for 10 min. Afterwards, SARS-CoV-2-NP-Ab conjugated Au@AgNBA@Au or influenza A-Ab conjugated Au@AgMB@Au were added onto the test spot. After 3 min, the AAO was washed with PBS to remove unbound species. SERS spectra of the test spots were measured and SERS intensities were used for target antigen quantification.Simultaneous antigen assays of SARS-CoV-2 NP and influenza A antigen and specificity tests
For the simultaneous detection of SARS-CoV-2 NP and influenza A antigen, SARS-CoV-2-NP-Ab and influenza A-Ab (1![[thin space (1/6-em)]](https://www.rsc.org/images/entities/char_2009.gif) :
:![[thin space (1/6-em)]](https://www.rsc.org/images/entities/char_2009.gif) 1, 1 mg mL−1) were simultaneously immobilized on the test zone of AAO. Sample solutions containing SARS-CoV-2 NP and influenza A antigen were mixed and dropped onto the AAO membrane. After incubation for 10 min, SARS-CoV-2-NP-Ab conjugated Au@AgNBA@Au and influenza A-Ab conjugated Au@AgMB@Au were mixed (1
1, 1 mg mL−1) were simultaneously immobilized on the test zone of AAO. Sample solutions containing SARS-CoV-2 NP and influenza A antigen were mixed and dropped onto the AAO membrane. After incubation for 10 min, SARS-CoV-2-NP-Ab conjugated Au@AgNBA@Au and influenza A-Ab conjugated Au@AgMB@Au were mixed (1![[thin space (1/6-em)]](https://www.rsc.org/images/entities/char_2009.gif) :
:![[thin space (1/6-em)]](https://www.rsc.org/images/entities/char_2009.gif) 1 (v/v)) and added onto the test zone. After the test zone was rinsed with PBS and dried, the corresponding SERS spectra were measured and analyzed.
1 (v/v)) and added onto the test zone. After the test zone was rinsed with PBS and dried, the corresponding SERS spectra were measured and analyzed.
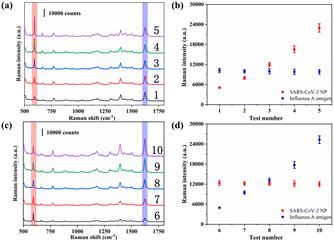
For the specificity test, 10 samples, SARS-CoV-2 NP (0.02, 0.1, 0.5, 2, 16 ng ml−1) and influenza A antigen (0.2 ng ml−1), SARS-CoV-2 NP (0.5 ng ml−1) and influenza A antigen (0.02, 0.2, 0.85, 3, 30 ng ml−1), were prepared and their SERS spectra were measured.
Results and discussion
Principles of VFA based on AAO and SERS nanotags
Fig. 1a illustrates the basic structure and working principles of the VFA based on AAO and SERS nanotags. SERS nanotags recognize and bind to antigens which were captured by corresponding antibodies on AAO to form a sandwich immunocomplex. As a result, SERS nanotags are captured onto the test spot, producing a colored spot. Colored test spots correspond to positive samples. For qualitative detection, colored dots can be observed by the naked eye due to the localized plasmon resonance effect of the SERS nanotags. For quantitative detection, SERS signals were measured by a Raman spectrometer. In single-antigen assay mode, Raman signals of the two test spots were measured separately for the quantitative analysis of the corresponding analytes (Fig. 1b). In simultaneous-antigen assay mode, the SERS signals of only one test spot were measured; SARS-CoV-2 NP and influenza A antigen were quantitatively analyzed according to the signal intensities of the corresponding characteristic Raman peaks (Fig. 1c).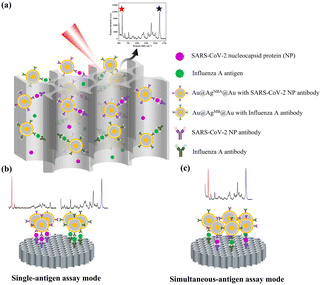 | ||
| Fig. 1 (a) Working principles of the proposed VFA method. (b) Schematic of the single-antigen assay mode. (c) Schematic of the simultaneous-antigen assay mode. | ||
Characterization of core–shell SERS nanotags
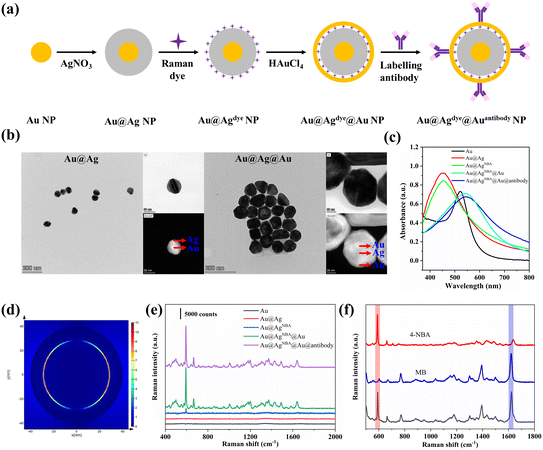
The synthesis route of the core–shell SERS nanotags is schematically shown in Fig. 2a. The Au@Ag@Au NPs were synthesized with the following characteristics: (i) a core–shell structure to prevent the leakage of Raman dyes, (ii) Raman dyes located in the gap to generate a strong SERS signal, and (iii) an outer Au shell to prevent a decline in SERS signal as a result of Ag oxidation. First of all, the size of the Au@Ag@Au NPs was optimized for maximum Raman enhancement. AuI solutions of different amounts (0.5/1/2/3/4/5/6 ml) were injected for different shell thickness. As shown in Fig. S2,† with an increase in the amount of the AuI solution, the absorption peak of the Au@Ag@Au NPs redshifted, which indicated an increase in the shell thickness. However, the SERS intensity of the Au@AgNBA@Au NPs decreased when more than 4 ml of AuI solution was used. The possible reason for this phenomenon could be that a thick shell prevents the output of the Raman signal of NBA. Therefore, 4 ml of AuI solution (corresponding to 55 μM of HAuCl4) was chosen for Au@Ag@Au NP preparation. The core–shell structure of the Au@Ag@Au NPs was clearly confirmed by TEM, as shown in Fig. 2b, which exhibit a spherical morphology with a diameter of 80 nm. As shown in Fig. 2c, the absorption peak of the Au NP core was 521 nm and blueshifted to 448 nm after the formation of the Ag shell. After coating the outer gold shell, the absorption peak of Au@Ag@Au redshifted to 540 nm. The labelling of antibodies caused a redshift in the absorption peak of 3 nm, which indicated successful modification. Changes in zeta potential also proved the success of each synthesis step (Fig. S3†). The near-field electromagnetic field distribution of the Au@Ag@Au NPs was simulated using FDTD software (Fig. S4†). The geometric parameters of the Au@Ag@Au NPs were set in accordance with the TEM elemental mapping image. As shown in Fig. 2d, the electromagnetic field is highly localized within the interior gap of the Au@Ag@Au NPs. Moreover, the SERS enhancement factor (EF) of the Au@Ag@Au NPs was calculated by using NBA as the Raman reporter molecule. The detailed calculation method is shown in ESI-1† and the EF value is 1.06 × 10⁵. The SERS signals of the nanoparticles were also measured in each synthesis step shown in Fig. 2e, where the SERS intensity of the Au@Ag@Au increased sharply after the formation of the outer gold shell. This might be the gap between Ag and Au generates a significantly higher electromagnetic field than that on the surface of Ag,39 which greatly improved the SERS performance of Au@Ag@Au. Also, the SERS intensity only slightly decreased after the modification of the antibody. In order to distinguish between and quantify SARS-CoV-2 and influenza A simultaneously, SERS nanotags with distinct Raman characteristic peaks are required. Fig. 2f shows the SERS spectra collected from SARS-CoV-2 NP-Ab conjugated Au@AgNBA@Au, influenza A-Ab conjugated Au@AgMB@Au and an equimolar mixture (v/v, 1![[thin space (1/6-em)]](https://www.rsc.org/images/entities/char_2009.gif) :
:![[thin space (1/6-em)]](https://www.rsc.org/images/entities/char_2009.gif) 1) of both functionalized nanoparticles. The marked characteristic Raman peak of NBA (591 cm−1) and MB (1621 cm−1) are distinct without any overlap with each other. This indicates that raw SERS spectra can be used for further quantitative analysis without spectral deconvolution. Meanwhile, the intensities of characteristic peaks are almost the same for both SERS nanotags, which facilitates the simultaneous quantitative detection of SARS-CoV-2 and influenza A.
1) of both functionalized nanoparticles. The marked characteristic Raman peak of NBA (591 cm−1) and MB (1621 cm−1) are distinct without any overlap with each other. This indicates that raw SERS spectra can be used for further quantitative analysis without spectral deconvolution. Meanwhile, the intensities of characteristic peaks are almost the same for both SERS nanotags, which facilitates the simultaneous quantitative detection of SARS-CoV-2 and influenza A.
Modification of the AAO sensing membrane
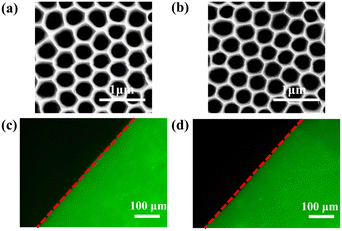
The SEM image of AAO membrane is shown in Fig. 3a. Regular holes with a diameter of 350 nm are ideal channels for fluid flow in VFA. The chemical modification process of AAO is shown in Fig. S5.† Firstly, the AAO surface was enriched with hydroxyl groups by oxygen plasma treatment. Secondly, amino groups were generated by a silanization reagent named APTMS. Thirdly, carboxyl groups were generated by reaction with glutaraldehyde. Lastly, the antibody immobilization onto the AAO was accomplished via a typical aldimine condensation reaction between NH2 group of antibodies and formyl group on the AAO surface. As shown in Fig. 3b, the morphology of AAO after chemical modification is almost identical to that before modification. This indicates that the chemical modification process does not destroy the morphology of AAO and that the modified AAO is still suitable for subsequent vertical flow immunoassay.The efficiency of antibody immobilization was checked by modifying AAO with anti-AFP-FITC. The microscopy image of AAO after immobilization of anti-AFP-FITC is shown in Fig. 3c. The observed fluorescence image demonstrates that antibodies were successfully immobilized on AAO and were available for the immunoreaction in the next steps. Fig. 3d shows the fluorescence image of anti-AFP-FITC functionalized AAO after being stored in PBS at 4 °C for 5 months. Antibodies remained fixed on AAO firmly, which proved that this antibody immobilization method via chemical bonding is very reliable.
Single-antigen assay mode
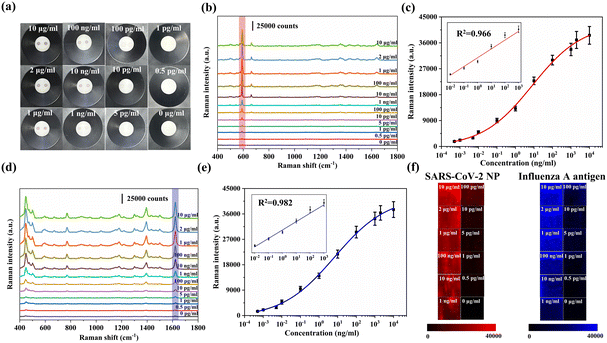
SARS-CoV-2 NP antibodies were immobilized on the AAO membrane for SARS-CoV-2 detection, while influenza A antibodies were immobilized on another test spot on AAO for influenza A detection. When SARS-CoV-2 NP and influenza A antigen were present in the sample, strong SERS signals of Au@AgNBA@Au and Au@AgMB@Au could be detected at two test spots, respectively. Fig. 4a shows images of the AAO of these two antigens with various concentrations. With a decrease in the corresponding antigen concentration, the color of the test zone became lighter. By observing the color change of the test spots, antigens could be measured qualitatively and semi-quantitatively.Further, the SERS spectra of test spots were collected for accurate quantification. SARS-CoV-2 NP and influenza A antigen were quantified by monitoring the SERS intensities of NB (591 cm−1) and MB (1621 cm−1). The SERS spectral changes of different concentrations (10 μg ml−1–0 pg ml−1) of SARS-CoV-2 NP are depicted in Fig. 4b. The calibration curve of SERS intensity at 591 cm−1versus the SARS-CoV-2 NP concentration is shown in Fig. 4c. There is a linear relationship between the SERS intensity and SARS-CoV-2 NP concentration in the range of 0.01 ng ml−1–1 μg ml−1. Fig. 4d shows SERS spectra changes in 0.01 ng ml−1–1 μg ml−1 concentration range of the influenza A antigen and the corresponding calibration curve is shown in Fig. 4e. The linear detection range of the influenza A antigen is 0.01 ng ml−1–1 μg ml−1. The signal intensities for LOD were calculated using LOD = X + 3SD, where X and SD are the mean and the standard deviation of the negative control, respectively. The LODs were calculated to be 0.15 pg ml−1 and 0.22 pg ml−1 for SARS-CoV-2 and influenza A, respectively.
Fig. 4f shows the Raman mapping images of SARS-CoV-2 and influenza A. A 100 × 100 μm2 area was randomly selected on the AAO membrane and the Raman mapping image was measured at 5 μm intervals. Both mapping images show uniform intensity distributions, which indicates that two kinds of immunocomplexes are evenly distributed in the test area, showing the reliability of the biosensor. Meanwhile, a 50 μm depth mapping was measured from the upper surface of AAO to the lower surface with 0.5 μm intervals (Fig. S6†). The test spot of the SARS-CoV-2 NP at a concentration of 10 ng ml−1 was selected and the mapping spot was randomly selected. The SERS intensity at 591 cm−1 remained constant within the 50 μm depth, which indicates that SERS nanotags and antibodies can penetrate deeply into the AAO freely rather than being limited to the top area only. These results further prove that the regular holes of AAO serve as ideal channels for the proposed SERS-VFA, improving antibody–antigen interaction probability.
Simultaneous-antigen assay mode
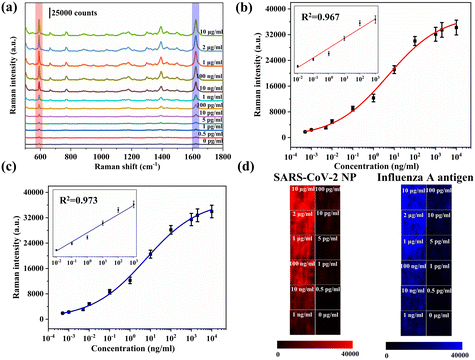
To further improve the detection efficiency of the proposed VFA strategy, simultaneous detection of SARS-CoV-2 NP and the influenza A antigen was performed on the VFA platform. SARS-CoV-2 NP antibodies and influenza A antibodies were simultaneously immobilized on the same test spot of AAO for simultaneous detection of SARS-CoV-2 and influenza A. Distinct SERS signals for both SERS nanotags were observed when SARS-CoV-2 NP and influenza A antigen were present in the sample. Therefore, it is possible to quantify the amount of SARS-CoV-2 NP and influenza A antigen simultaneously by monitoring the characteristic Raman peak intensities (591 cm−1 for NBA and 1621 cm−1 for MB) of both Raman dyes.Fig. 5a shows the SERS spectra of different concentrations of SARS-CoV-2 NP and influenza A antigen. The fitting curves of different concentrations of SARS-CoV-2 NP and influenza A antigen and the intensity of Raman characteristics peak (591 cm−1 and 1621 cm−1) are plotted in Fig. 5b and c, respectively. With an increase in each antigen concentration, the corresponding SERS intensity for both decreases in a similar pattern concomitantly. Thus, the concentration of each antigen can be accurately determined from the calibration curves. In simultaneous-detection mode, the LOD values for SARS-CoV-2 NP and influenza A antigen were calculated to be 0.47 pg ml−1 and 0.62 pg ml−1, respectively. Obviously, there is certain decrease in LOD in simultaneous-detection mode compared to single-antigen detection mode. The reason for this is that the surface area of AAO is occupied by multiplex probes.40 Meanwhile, various concentrations (0–100 ng ml−1) of SARS-CoV-2 NP and influenza A antigen were measured using commercial LFA strips (Fig. S7†). The LODs based on the colorimetric signals of the SARS-CoV-2 NP and influenza A antigen were 0.5 ng ml−1 and 1 ng ml−1, respectively. Compared with commercial LFA strips, the sensitivity of the proposed VFA was improved by approximately 1000 times. Fig. 5d shows the Raman mapping images of the test spots under different antigen concentrations. Both mapping images show uniform intensity distributions that indicate the reliability of the simultaneous-antigen detection mode.
Since SARS-CoV-2 NP and influenza A antigen were detected simultaneously, it was necessary to confirm that there was no cross-reaction between the two immunoassay systems. The concentration of one respiratory virus antigen was fixed, while the concentration of the other was varied. Then, two antigens were mixed and dropped onto AAO. The concentrations of ten samples are shown in Table S1† in detail. As can be seen from Fig. 6a, after adding different concentrations of SARS-CoV-2 NP to the AAO membrane, only SARS-CoV-2 NP antibodies bound to SARS-CoV-2 NP, and the intensity of the characteristic Raman peak (591 cm−1) varied. On the other hand, the characteristic Raman peak intensity of MB at 1621 cm−1 was maintained at a constant intensity regardless of the concentration of SARS-CoV-2 NP (shown in Fig. 6b). Conversely, as shown in Fig. 6c, when influenza A antigen of different concentrations were added onto AAO, only influenza A antibodies bound to influenza A antigens and the characteristic Raman peak intensity of MB at 1621 cm−1 changed. In this case, the Raman peak intensity at 591 cm−1 remained constant, as shown in Fig. 6d. These results indicate that there was no cross-reaction during the simultaneous detection of the SARS-CoV-2 NP and influenza A antigen.
Predictably, the simultaneous detection of more respiratory viruses, such as influenza B and respiratory syncytial virus (RSV), can be realized by simply setting more test spots on the AAO membrane without any additional cost.
Reproducibility and stability of the AAO-based SERS-VFA biosensor
Reproducibility has been widely established to be a significant requirement for SERS-VFA biosensors. Fifteen batches of the AAO based SERS-VFA were used for the detection of a mixture of SARS-CoV-2 NP and influenza A antigens. As shown in Fig. S8,† reproducible characteristic Raman peaks at 591 cm−1 and 1621 cm−1 were observed. The RSDs of the corresponding intensities were 5.4% (SARS-CoV-2 NP) and 5.8% (influenza A antigen), respectively. The reproducibility of commercial LFA strips was also assessed by repeating the detection of each analyte three times. The colorimetric results of the SARS-CoV-2 NP (100 ng ml−1, 10 ng ml−1 and 1 ng ml−1) are shown in Fig. S9.† According to greyscale analysis, the RSDs of the intensity of the T line are 14.8%, 15.7% and 10.5%. Compared with commercial LFA strips, the proposed SERS-VFA method is more reproducible.In practical applications, stability is also crucial for SERS-VFA biosensors. Fig. S10† shows the detection results for SARS-CoV-2 NP (1 μg ml−1) after being exposed to the air for 8 weeks. Apparently, the SERS intensity of the proposed SERS-VFA biosensor after being stored for 8 weeks decreased by only 17% compared with the original. This is due to the presence of the outer gold shell, which prevents the leakage of Raman dye molecules and the weaken of enhancement performance caused by oxidation. To further prove the stability of the proposed SERS-VFA in complex samples, Au@AgNBA@Au SERS nanotags were mixed with 10 mM PBS, 50 mM Tris-HCl, saliva, sputum and nasal mucus, respectively. The SERS spectra of each SERS nanotag were measured, as presented in Fig. S11.† This indicates that the proposed SERS nanotag is highly stable in complex biological samples, as well as being resistant to high salt concentrations and interference. Potentially, the Au@Ag@Au NPs can be applied in complex biological samples such as throat swab samples. Therefore, a negative real sputum sample was tested using our proposed SERS-VFA method. The sputum sample and SERS nanotags were dropped onto the AAO membrane in order. After sufficient immune-reaction and rinsing, the corresponding SERS spectra of the test spots were measured, as presented in Fig. S12(a).† For the negative sample, the SERS signal intensity was very weak, comparable to the background signal. Fig. S12(b) and (c)† show the images of AAO and absorption pad after detection. SERS nanotags passed through AAO and were absorbed by the absorption pad completely. Positively, organo components in the biological samples were observed to have no effect on the operation of the proposed SERS-VFA method. A comparison of the proposed SERS-VFA method with other assays for the simultaneous detection of SARS-CoV-2 and influenza A is shown in Table S2.† Compared with other assays, our method shows a wider linear dynamic range and lower LOD. In addition, this approach takes comparable or an even shorter test time than the other methods. On the one hand, the Au@Ag@Au SERS nanotag provides a strong and codable signal. On the other hand, the porous AAO provides abundant binding sites for analytes and increases the probability of antibody–antigen interaction. Therefore, the proposed SERS-VFA can realize the ultrasensitive simultaneous detection of SARS-CoV-2 and influenza A with a wide linear dynamic range.
Real sample analysis
Different concentrations of SARS-CoV-2 NP (0.1–10 ng ml−1) and influenza A antigen (0.1–10 ng ml−1) were spiked into real throat swab samples from healthy people and analyzed using the proposed method. As summarized in Table 1, the recoveries for SARS-CoV-2 NP and influenza A antigen ranged from 93.9–108.6% and 94.7–104.6% with coefficients of variation (CVs) below 10%, respectively. These results demonstrate that the SERS-VFA method is suitable for clinical real sample analysis with high accuracy and reliability.| Sample | Added (ng ml−1) | Found (ng ml−1) | Recovery (%) | CV (%) (n = 3) |
|---|---|---|---|---|
| SARS-CoV-2 NP | 10 | 9.39 | 93.9 | 9.2 |
| 1 | 1.04 | 104.4 | 7.5 | |
| 0.1 | 0.109 | 108.6 | 9.4 | |
| Influenza A antigen | 10 | 9.47 | 94.7 | 8.6 |
| 1 | 1.05 | 104.6 | 7.6 | |
| 0.1 | 0.096 | 95.8 | 6.4 |
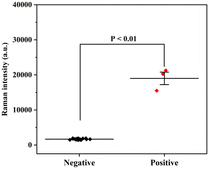
Finally, a total of 20 throat swab samples obtained from The First Affiliated Hospital of Nanjing Medical University were measured using the proposed SERS-VFA method (SARS-CoV-2 positive: 3, SARS-CoV-2 negative: 17). All experiments were conducted in accordance with relevant laws and approved by the Ethics Committee of The First Affiliated Hospital of Nanjing Medical University. Consent documents were also obtained from all human subjects. The SERS signal intensities of 591 cm−1 were measured and are displayed in Fig. 7. The SERS signals of the positive samples were strong (>15![[thin space (1/6-em)]](https://www.rsc.org/images/entities/char_2009.gif) 499) whereas those of the negative samples were weak (<1929). Non-parametric testing (Mann–Whitney test) confirmed that there was a significant difference between the positive and negative groups (P < 0.01). These preliminary results indicate that the AAO-based SERS-VFA is a useful diagnostic tool for clinical samples.
499) whereas those of the negative samples were weak (<1929). Non-parametric testing (Mann–Whitney test) confirmed that there was a significant difference between the positive and negative groups (P < 0.01). These preliminary results indicate that the AAO-based SERS-VFA is a useful diagnostic tool for clinical samples.
Conclusions
To distinguish whether a suspected patient is infected with SARS-CoV-2 or influenza A virus, an AAO based SERS-VFA was developed for simultaneous sensitive analysis of these two viruses. The synthesized Au@Ag@Au core–shell SERS nanotag exhibited excellent SERS effect and good stability. The proposed strategy enabled quantitative analysis of SARS-CoV-2 NP and influenza A antigen with high sensitivity without cross-reaction. The proposed method exhibited good performance with a linear range of 0.01 ng ml−1–1 μg ml−1 and a LOD of 0.47 pg ml−1 for SARS-CoV-2 NP, as well as a linear range of 0.01 ng ml−1–1 μg ml−1 and a LOD of 0.62 pg ml−1 for influenza A antigen. The clinical application potential of the SERS-VFA was further validated using 20 throat swab samples (SARS-CoV-2), including 3 positive samples and 17 negative samples. This method can be used to accurately distinguish positive samples from negative samples. With the advantages of high sensitivity, short test time, high reproducibility and multiple detection, the AAO based SERS-VFA is considered to be a new diagnostic tool for discriminating between these two respiratory diseases to control their spread. Further, this method can be extended to the multiplex diagnosis of other respiratory viruses infection, such as influenza B virus, respiratory syncytial virus, adenovirus and parainfluenza by setting more test spots on the AAO membrane and using different SERS nanotags.Author contributions
Yu Lu: conceptualization, methodology, writing – original draft. Ruihua Fei: methodology, data curation. Jiahe Zhang: methodology, investigation. Geng Zhu: methodology, investigation. Xiufang Mo: methodology. Yu Wan: resources. Yan Huang: resources. Qingjiang Sun: resources. Dianhuai Meng: resources. Xiangwei Zhao: funding acquisition, supervision.Conflicts of interest
There are no conflicts to declare.Acknowledgements
The authors gratefully acknowledge financial support from the Jiangsu Provincial Key Research and Development Program (BE2021664, BE2021012-4), the Central Funds Guiding the Local Science and Technology Development of Shenzhen (2021Szvup024), the National Natural Science Foundation of China (21976028) and the Postgraduate Research & Practice Innovation Program of Jiangsu Province (KYCX22_0246).Notes and references
- S. Haque, O. Ashwaq, A. Sarief and A. Mohamed, Future Virol., 2020, 15, 625–648 CrossRef CAS PubMed.
- F. Rahimi and A. Abadi, Travel Med. Infect. Dis., 2020, 37, 101677 CrossRef PubMed.
- F. Wu, S. Zhao, B. Yu, Y. M. Chen, W. Wang, Z. G. Song, Y. Hu, Z. W. Tao, J. H. Tian, Y. Y. Pei, M. L. Yuan, Y. L. Zhang, F. H. Dai, Y. Liu, Q. M. Wang, J. J. Zheng, L. Xu, E. C. Holmes and Y. Z. Zhang, Nature, 2020, 579, 265–269 CrossRef CAS PubMed.
- N. C. Peeri, N. Shrestha, M. S. Rahman, R. Zaki, Z. Q. Tan, S. Bibi, M. Baghbanzadeh, N. Aghamohammadi, W. Y. Zhang and U. Haque, Int. J. Epidemiol., 2020, 49, 717–726 CrossRef PubMed.
- E. A. Nardell and R. R. Nathavitharana, JAMA, J. Am. Med. Assoc., 2020, 324, 141–142 CrossRef CAS PubMed.
- W. H. Kong, Y. Li, M. W. Peng, D. G. Kong, X. B. Yang, L. Y. Wang and M. Q. Liu, Nat. Microbiol., 2020, 5, 675–678 CrossRef CAS PubMed.
- A. Sharma, S. Tiwari, M. K. Deb and J. L. Marty, Int. J. Antimicrob. Agents, 2020, 56, 106054 CrossRef CAS PubMed.
- J. K. Taubenberger and D. M. Morens, Annu. Rev. Pathol., 2008, 3, 499–522 CrossRef CAS PubMed.
- W. L. Wang, Y. L. Xu, R. Q. Gao, R. J. Lu, K. Han, G. Z. Wu and W. J. Tan, JAMA, J. Am. Med. Assoc., 2020, 323, 1843–1844 CAS.
- A. S. Fauci, H. C. Lane and R. R. Redfield, N. Engl. J. Med., 2020, 382, 1268–1269 CrossRef CAS PubMed.
- J. S. Lavine, O. N. Bjornstad and R. Antia, Science, 2021, 371, 741–745 CrossRef CAS PubMed.
- D. B. Larremore, B. Wilder, E. Lester, S. Shehata, J. M. Burke, J. A. Hay, T. Milind, M. J. Mina and R. Parker, Sci. Adv., 2021, 7, eabd5393 CrossRef CAS PubMed.
- C. W. Wang, X. S. Yang, S. Zheng, X. D. Cheng, R. Xiao, Q. J. Li, W. Q. Wang, X. X. Liu and S. Q. Wang, Sens. Actuators, B, 2021, 345, 130372 CrossRef CAS PubMed.
- W. Q. Wang, X. S. Yang, Z. Rong, Z. J. Tu, X. C. Zhang, B. Gu, C. W. Wang and S. Q. Wang, Nano Res., 2023, 16, 3063–3073 CrossRef CAS PubMed.
- Z. Z. Liu, C. W. Wang, S. Zheng, X. S. Yang, H. Han, Y. W. Dai and R. Xiao, Nanomedicine, 2023, 47, 102624 CrossRef CAS PubMed.
- M. D. Lu, Y. Joung, C. S. Jeon, S. Kim, D. Yong, H. Jang, S. H. Pyun, T. Kang and J. Choo, Nano Convergence, 2022, 9, 39 CrossRef CAS PubMed.
- K. M. Koczula and A. Gallotta, Essays Biochem., 2016, 60, 111–120 CrossRef PubMed.
- N. Jiang, R. Ahmed, M. Damayantharan, B. Unal, H. Butt and A. K. Yetisen, Adv. Healthcare Mater., 2019, 8, 1900244 CrossRef PubMed.
- Y. K. Oh, H. A. Joung, S. Kim and M. G. Kim, Lab Chip, 2013, 13, 768–772 RSC.
- J. R. Clarke, B. L. Goodall, H. P. Hui, N. Vats and C. L. Brosseau, Anal. Chem., 2017, 89, 1405–1410 CrossRef PubMed.
- A. Ben Aissa, B. Araújo, E. Julián, M. V. B. Zanoni and M. I. Pividori, Sensors, 2021, 21, 5992 CrossRef CAS PubMed.
- M. Tahmasebi, T. Bamdad, W. E. Svendsen and M. Forouzandeh-Moghadam, Anal. Bioanal. Chem., 2022, 414, 3605–3615 CrossRef CAS PubMed.
- K. C. Xu, R. Zhou, K. Takei and M. H. Hong, Adv. Sci., 2019, 6, 1900925 CrossRef PubMed.
- R. P. Chen, X. Du, Y. J. Cui, X. Y. Zhang, Q. Y. Ge, J. Dong and X. W. Zhao, Small, 2020, 16, 2002801 CrossRef CAS PubMed.
- R. P. Chen, B. Liu, H. B. Ni, N. Chang, C. X. Luan, Q. Y. Ge, J. Dong and X. W. Zhao, Analyst, 2019, 144, 4051–4059 RSC.
- Q. Li, X. B. Li, P. Y. Zhou, R. Chen, R. Xiao and Y. F. Pang, Biosens. Bioelectron., 2022, 215, 114548 CrossRef CAS PubMed.
- P. H. Liang, Q. Guo, T. Y. Zhao, C. Y. Wen, Z. Y. Tian, Y. X. Shang, J. Y. Xing, Y. Z. Jiang and J. B. Zeng, Anal. Chem., 2022, 94, 8466–8473 CrossRef CAS PubMed.
- Y. Ma, K. Promthaveepong and N. Li, Adv. Opt. Mater., 2017, 5, 170013 Search PubMed.
- L. D. Zhang, Y. Su, X. H. Liang, K. Cao, Q. M. Luo and H. M. Luo, Nano Res., 2023, 16, 7459–7469 CrossRef CAS PubMed.
- S. F. Zong, Z. Y. Wang, H. Chen, G. H. Hu, M. Liu, P. Chen and Y. P. Cui, Nanoscale, 2014, 6, 1808–1816 RSC.
- S. Choi, J. Hwang, S. Lee, D. W. Lim, H. Joo and J. Choo, Sens. Actuators, B, 2017, 240, 358–364 CrossRef CAS.
- X. L. Fu, J. H. Wen, J. W. Li, H. Lin, Y. M. Liu, X. M. Zhuang, C. Y. Tian and L. X. Chen, Nanoscale, 2019, 11, 15530–15536 RSC.
- N. G. Khlebtsov, L. Lin, B. N. Khlebtsov and J. Ye, Theranostics, 2020, 10, 2067–2094 CrossRef CAS PubMed.
- L. Lin, H. C. Gu and J. Ye, Chem. Commun., 2015, 51, 17740–17743 RSC.
- D. K. Lim, K. S. Jeon, J. H. Hwang, H. Kim, S. Kwon, Y. D. Suh and J. M. Nam, Nat. Nanotechnol., 2011, 6, 452–460 CrossRef CAS PubMed.
- J. F. Li, Y. F. Huang, Y. Ding, Z. L. Yang, S. B. Li, X. S. Zhou, F. R. Fan, W. Zhang, Z. Y. Zhou, D. Y. Wu, R. Bin, Z. L. Wang and Z. Q. Tian, Nature, 2010, 464, 392–395 CrossRef CAS PubMed.
- M. Rycenga, X. H. Xia, C. H. Moran, F. Zhou, D. Qin, Z. Y. Li and Y. N. Xia, Angew. Chem., Int. Ed., 2011, 50, 5473–5477 CrossRef CAS PubMed.
- G. Frens, Nature Phys. Sci., 1973, 241, 20–22 CrossRef CAS.
- J. M. Nam, J. W. Oh, H. Lee and Y. D. Suh, Acc. Chem. Res., 2016, 49, 2746–2755 CrossRef CAS PubMed.
- B. Liu, D. Zhang, H. B. Ni, D. L. Wang, L. Y. Jiang, D. G. Fu, X. F. Han, C. Zhang, H. Y. Chen, Z. Z. Gu and X. W. Zhao, ACS Appl. Mater. Interfaces, 2018, 10, 21–26 CrossRef CAS PubMed.
Footnote |
| † Electronic supplementary information (ESI) available. See DOI: https://doi.org/10.1039/d3sd00118k |
| This journal is © The Royal Society of Chemistry 2023 |

